Cory:
Unlock Your AI Assistant Now!
Abstract
Background: Treating a coronary stenosis by percutaneous coronary intervention (PCI) aims to relieve myocardial ischaemia by improving coronary blood flow. The evolution of coronary flow and resistance post-PCI is not fully understood.
Aims: This study aimed to investigate the immediate impact of PCI on absolute coronary flow (Q), and epicardial and microvascular resistance (Repi and Rμ).
Methods: In a two-centre cohort including 52 patients, pre- and post-PCI physiological assessments were performed using continuous thermodilution, via a combination of a pressure-temperature sensor wire and a dedicated infusion microcatheter.
Results: Resting Q remained similar before and after PCI (Δ +2 [interquartile range [IQR] −9 to 21] mL/min; p=0.21), as a 193 Wood unit (WU) reduction in resting Repi (Δ −193 [IQR −400 to −59] WU; p<0.001) was offset by a 267 WU increase in resting Rμ (Δ +267 [IQR −20 to 474] WU; p=0.002). Conversely, hyperaemic Q rose significantly (Δ +44 [IQR 16 to 92] mL/min; p<0.001), reflecting a 195 WU reduction in hyperaemic Repi (Δ −195 [IQR −379 to −82] WU; p<0.001), while hyperaemic Rμ remained stable (Δ +3 [IQR −96 to 75] WU; p=0.87). The median microvascular resistance reserve (MRR) did not change significantly after PCI (Δ −0.2 [IQR −0.7 to 0.6]; p=0.301). Pre- and post-PCI fractional flow reserve (FFR) were strongly and inversely associated with Repi and predicted the improvement of hyperaemic Q.
Conclusions: PCI significantly reduces epicardial resistance, leading to a pronounced increase in hyperaemic flow, which can be predicted by FFR. Resting Q remained unchanged because of compensatory increases in microvascular resistance, providing direct evidence of coronary flow autoregulation in humans. The MRR was unaffected by PCI, confirming its specificity as an index of microvascular function.
The progression of the atherosclerotic process within the coronary arteries results in the development of coronary stenoses, which can significantly reduce coronary blood flow during exercise, resulting in angina as a result of myocardial ischaemia and subsequent functional, metabolic, and structural changes of the myocardium1.
Percutaneous coronary intervention (PCI) aims to address epicardial coronary narrowing to improve coronary blood flow and relieve angina symptoms associated with myocardial ischaemia2.
Over the years, several coronary flow-surrogate indices (fractional flow reserve [FFR], bolus thermodilution, and Doppler-based indices) have been developed and validated, but more recently, the introduction of the continuous thermodilution method has represented a step forward in facilitating a direct and highly reproducible assessment of absolute coronary flow (Q) and resistance3 both at rest and during maximal hyperaemia4.
The aim of the present work was to investigate, for the first time, the impact of PCI on myocardial blood flow and coronary resistance (assessed by continuous intracoronary thermodilution) across the spectrum of patients with ischaemic heart disease.
Methods
Patients admitted to the Oxford Heart Centre and the Essex Cardiothoracic Centre from December 2021 until October 2022 for a clinically indicated coronary angiogram were enrolled into the Oxford Acute Myocardial Infarction (OxAMI) study and the Essex Stable Angina and Acute Myocardial Infarction study, respectively (REC number 10/H0408/24 and REC reference 22/EE/0016). Both studies were conducted in accordance with the Declaration of Helsinki, and all patients provided informed, written consent for participation in the study. A list of the OxAMI study investigators is provided in Supplementary Appendix 1.
The inclusion criteria were the presence of a significant coronary stenosis in a proximal or mid-segment of an epicardial vessel with a diameter of >3.0 mm, with confirmed presence of ischaemia in the respective myocardial territory and suitability for percutaneous revascularisation. Patients presenting with either acute coronary syndrome (non-ST-segment elevation myocardial infarction or unstable angina) or chronic coronary syndrome were included in the present study. Patients were excluded if they presented with ST-segment elevation myocardial infarction, haemodynamic or electrical instability, or out-of-hospital cardiac arrest. Further exclusion criteria were age <18 years, pregnant status, renal impairment (defined as a glomerular filtration rate below 30 mL/min), contraindication to the administration of adenosine, significant valvular disease, and previous coronary artery bypass grafting.
Study protocol
Enrolled patients underwent a coronary physiology assessment using the continuous thermodilution technique before proceeding to intervention. It was left to the operator’s discretion whether to predilate with an undersized balloon (≤2.0 mm for vessels with a diameter ≤3.5 mm and ≤2.5 mm for vessels with a diameter >3.5 mm) in the presence of a subtotal occlusion (diameter stenosis >90%). PCI was performed by default with a drug-eluting stent. Upon completion of PCI, the physiological assessment was repeated, ensuring that the location of the pressure-wire sensor and the continuous thermodilution microcatheter tip matched their locations during the preprocedural assessment.
Quantitative coronary angiography
Two-dimensional quantitative coronary angiography (QCA) was performed offline using the integrated analysis software of the Philips console (Philips). Measurements were obtained in end-diastolic frames, minimising vessel foreshortening and overlap. The reference vessel diameter, minimal lumen diameter (MLD), lesion length, and percentage diameter stenosis (DS%) were automatically computed and manually adjusted when required.
Coronary physiology assessment
The index vessel was instrumented with a combined pressure/thermistor guidewire (PressureWire X [Abbott Vascular]). After pressure-waveform equalisation of the wire, aortic pressure (Pa) was measured via the guide catheter, and distal coronary pressure (Pd) was measured via the pressure wire (CoroFlow v3.01 [Abbott]). The resting Pd/Pa ratio and FFR were computed as the ratio of Pd and Pa at rest and during maximal hyperaemia induced by continuous intracoronary infusion of saline at room temperature through the RayFlow microcatheter (Hexacath) as described below.
Continuous thermodilution was used to measure Q during resting and hyperaemic conditions as previously described5. A thermo-pressure coronary wire (PressureWire X) was placed distally in the artery under assessment, and the dedicated RayFlow microcatheter was positioned just beyond the vessel ostium. Room-temperature saline was infused through the microcatheter via a mechanical pump (MEDRAD Mark 7 Arterion [Bayer]). After zeroing the temperature, infusion was started, and the temperature of the blood-saline mixture (Tmix), Pa, and Pd were all recorded (CoroFlow). Resting measurements were obtained with saline infusion at 10 mL/min, annotating resting Tmix (Tmix,rest) and Pd (Pd,rest) values after a steady state was reached (e.g., at least 1 minute after infusion)6. Hyperaemic measurements were then acquired with an infusion rate of 20 mL/min for the left anterior descending artery (or 15 mL/min for other vessels), annotating hyperaemic Tmix (Tmix,hyp) and Pd (Pd,hyper) values after a steady state was reached (e.g., at least 1 minute after infusion). Finally, the wire was retracted into the microcatheter to record the infusion temperature (Tinf) at rest (Tinf,rest) and during hyperaemia (Tinf,hyp).
Resting absolute coronary flow (Qrest) was calculated during a low saline infusion rate (10 mL/min) as follows:

Equation 1.
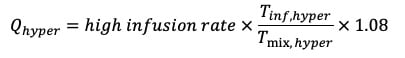
Hyperaemic absolute coronary flow (Qhyper) was calculated during a high saline infusion rate (20 mL/min or 15 mL/min) as follows:
Equation 2.
Resting absolute microvascular resistance (Rμ,rest) was calculated as follows:

Equation 3.
Hyperaemic absolute microvascular resistance (Rμ,hyper) was calculated as follows:

Equation 4.
Resting epicardial resistance (Repi,rest) was calculated as follows:

Equation 5.
Hyperaemic epicardial resistance (Repi,hyper) was calculated as follows:

Equation 6.
The total resting and hyperaemic absolute resistance (Rtotal,rest and Rtotal,hyper) was calculated as the sum of the respective epicardial and microvascular resistances as follows:

Equation 7.
and

Equation 8.
The coronary flow reserve (CFR) was calculated as follows:

Equation 9.
The microvascular resistance reserve (MRR) was calculated as follows7:

Equation 10.
Statistical analysis
After normality assessment (Shapiro-Wilk), data are expressed as mean±standard deviation (SD) or median (interquartile range [IQR]). Categorical variables are expressed as n (%). For the paired comparison of absolute values before and after PCI, we calculated the absolute difference (post-PCI−pre-PCI) for each parameter. The statistical significance of these paired absolute differences was assessed using a one-sample t-test when normally distributed or a Wilcoxon signed-rank test when not normally distributed. Two-sided p-values<0.05 were considered statistically significant. Paired differences are expressed as a percentage (Δ%) of the pre-PCI value, and their significance versus zero was assessed on paired data by a one-sample t-test or Wilcoxon signed-rank test for non-normally distributed differences. Correlations between variables are expressed using Spearman coefficients. The relative change of Qhyper was defined as the primary outcome. Because data exhibited marked skewness even after Yeo-Johnson transformation (Shapiro-Wilk p<0.05), and to minimise the influence of outliers, we modelled the median response using univariable quantile generalised additive models (qGAMs) at τ=0.5. Each smooth term was specified as a cubic regression spline (k=4) and fitted via the extended log-F likelihood, with smoothing parameters selected by restricted maximum likelihood. Model performance is reported as effective degrees of freedom (EDF), Wald χ², p-values, deviance explained, and adjusted pseudo-R². All predictions were back-transformed for the display of partial-effect curves. Pre-PCI Qhyper was intentionally excluded from the predictive models, because its presence in both the numerator and the denominator of the percentage-change outcome would introduce mathematical coupling and regression to the mean, yielding a spurious, non-biological association. Statistical analysis was performed with RStudio 2021.09.0 (Build 351 [R Foundation for Statistical Computing]). All tests were 2-sided, and a p-value<0.05 was considered significant.
Results
A total of 52 patients were included in the present study, of whom 41 enrolled at the Oxford Heart Centre and 11 at the Essex Heart Centre. Invasive physiology data were successfully measured before and after PCI in all 52 treated vessels, but two vessels were excluded from the final analysis because of technical issues (significant temperature [≥0.05°C] and/or pressure ratio drift [≥0.03 FFR]). Baseline and angiographic characteristics are summarised in Table 1. All patients underwent successful PCI without any procedural complications, and only one patient was treated with a drug-eluting balloon.
Table 1. Baseline, angiographic, and procedural characteristics.
| Population | n=52 |
|---|---|
| Baseline characteristics | |
| Age, years | 64±10 |
| Male | 41 (79) |
| Body mass index, kg/m2 | 28 (26-32) |
| Hypertension | 28 (54) |
| Diabetes mellitus | 10 (19) |
| Hypercholesterolaemia | 20 (39) |
| Acute coronary syndrome | 30 (58) |
| Previous coronary intervention | 11 (21) |
| Smoking habit | 22 (42) |
| Angiographic characteristics | |
| Vessel | |
| Left anterior descending | 34 (65) |
| Left circumflex | 6 (12) |
| Right coronary | 12 (23) |
| Diameter stenosis, % | 67±14 |
| Minimal lumen diameter, mm | 0.95±0.42 |
| Lesion length, mm | 22.1 (17.5-37.1) |
| Reference vessel diameter, mm | 2.81±0.49 |
| Procedural characteristics | |
| Contrast, mL | 213±67 |
| Stent volume, mm3 | 114 (69-162) |
| Stent length, mm | 32 (24-48) |
| Values are presented as mean±standard deviation, median (interquartile range), or n (%). | |
Coronary physiology changes associated with PCI
Physiological measurements before and after PCI are presented in Table 2 and in Supplementary Table 1. In 15 (29%) cases, pre-PCI assessment had to be performed after predilation with an undersized balloon. After PCI, we observed a significant improvement in the resting Pd/Pa ratio from 0.83 (IQR 0.71-0.90) to 0.95 (IQR 0.93–0.99;
Δ +0.13 [IQR 0.04-0.25]; p<0.001), FFR from 0.59±0.15 to 0.86±0.09 (Δ +0.27±0.17; p<0.001) and CFR from 1.7 (IQR 1.4-1.9) to 2.2 (IQR 1.9-2.6; Δ +0.5 [IQR 0.1-1.1]; p<0.001). The median Qrest did not significantly increase after PCI (76 [IQR 52-94] mL/min vs 80 [IQR 56-102] mL/min; Δ +2 [IQR −9 to 21] mL/min; p=0.210) (Figure 1A), nor did Rtotal,rest (1,226 [IQR 909-1,843] WU vs 1,130 [IQR 958-1,716] WU; Δ −2 [IQR −293 to 297] WU; p=0.819). This was the result of a significant decrease in the Repi,rest post-PCI from 235 (IQR 144-502) WU to 76 (IQR 33-152) WU (Δ −193 [IQR −400 to −59] WU; p<0.001) coupled with a concomitant increase in the Rμ,rest from 899 (IQR 625-1,381) WU to 1,097 (IQR 907-1,567) WU (Δ +267 [IQR −20 to 474] WU; p=0.002) (Figure 1B-Figure 1C). In contrast, the median Qhyper significantly increased after PCI from 122 (IQR 89-154)±57 mL/min to 190 (IQR 124-230) mL/min (Δ +44 [IQR 16-92] mL/min; p<0.001) (Figure 1D), while the Rtotal,hyper decreased from 724 (IQR 558-935) WU to 512 (IQR 411-708) WU (Δ −164 [IQR −328 to −38] WU; p<0.001). This was driven by a significant decrease in Repi,hyper post-PCI from 275 (IQR 168-454) WU to 72 (IQR 29-122) WU (Δ −195 [IQR −379 to −82] WU; p<0.001) (Figure 1E), whereas Rμ,hyper remained unchanged (from 429 [IQR 343-538] WU to 452 [IQR 325-581] WU; Δ +3 [IQR −96 to 75] WU; p=0.866) (Figure 1F). The median MRR did not significantly change after PCI (from 2.7 [IQR 2.4-3.4] to 2.6 [IQR 2.2-3.4]; Δ −0.2 [IQR −0.7 to 0.6]; p=0.301). A sensitivity analysis excluding patients who required gentle predilation before the physiological measurements yielded results consistent with the overall findings (Supplementary Table 2).
Of note, a decrease in Qrest and Qhyper after PCI was observed in 23 (46%) and in 4 (8%) cases, respectively, despite an improvement in both the Pd/Pa ratio and FFR post-PCI (Supplementary Table 3). Neither Qrest nor Qhyper changes were statistically different across the types of coronary syndrome presentation or vessel treated (Supplementary Figure 1).
Table 2. Pre-PCI and post-PCI invasive physiology measurements.
| Variable | Pre-PCI | Post-PCI | ∆ absolute change | p-value |
|---|---|---|---|---|
| Pa,rest, mmHg | 91 (83-101) | 96 (87-104) | +5 (–3 to 10) | 0.018 |
| Pd,rest, mmHg | 68±20 | 89±13 | +21±19 | <0.001 |
| Pa,hyper, mmHg | 88 (80-99) | 91 (83-105) | +3 (–3 to 9) | 0.136 |
| Pd,hyper, mmHg | 53±15 | 78±15 | +24±16 | <0.001 |
| Pd/Pa | 0.83 (0.71-0.90) | 0.95 (0.93-0.99) | +0.13 (0.04 to 0.25) | <0.001 |
| FFR | 0.59±0.15 | 0.86±0.09 | +0.27±0.17 | <0.001 |
| Pa ratio | 1.02 (0.98-1.08) | 1.02 (0.98-1.07) | +0.01 (–0.06 to 0.09) | 0.518 |
| Qrest, mL/min | 76 (52-94) | 80 (56-102) | +2 (–9 to 21) | 0.210 |
| Qhyper, mL/min | 122 (89-154) | 190 (124-230) | +44 (16 to 92) | <0.001 |
| Rμ,rest, WU | 899 (625-1,381) | 1,097 (907-1,567) | +267 (–20 to 474) | 0.002 |
| Repi,rest, WU | 235 (144-502) | 76 (33-152) | –193 (–400 to –59) | <0.001 |
| Rtotal,rest, WU | 1,226 (909-1,843) | 1,130 (958-1,716) | –2 (–293 to 297) | 0.819 |
| Rμ,hyper, WU | 429 (343-538) | 452 (325-581) | +3 (–96 to 75) | 0.866 |
| Repi,hyper, WU | 275 (168-454) | 72 (29-122) | –195 (–379 to –82) | <0.001 |
| Rtotal,hyper, WU | 724 (558-935) | 512 (411-708) | –164 (–328 to –38) | <0.001 |
| CFR | 1.7 (1.4-1.9) | 2.2 (1.9-2.6) | +0.5 (0.1 to 1.1) | <0.001 |
| MRR | 2.7 (2.4-3.4) | 2.6 (2.2-3.4) | –0.2 (–0.7 to 0.6) | 0.301 |
| CFR/FFR ratio | 2.9±1.0 | 2.7±1.1 | –0.2±1.2 | 0.329 |
| Values are presented as mean±SD or median (interquartile range). CFR: coronary flow reserve; FFR: fractional flow reserve; hyper: hyperaemic; MRR: microvascular resistance reserve; Pa: aortic pressure; Pa,hyper: hyperaemic aortic pressure; Pa ratio: resting to hyperaemic aortic pressure; Pa,rest: resting aortic pressure; PCI: percutaneous coronary intervention; Pd: distal pressure; Pd,hyper: hyperaemic distal pressure; Pd,rest: resting distal pressure; Q: absolute coronary flow; Repi: epicardial resistance; rest: resting; Rtotal: total myocardial resistance; Rμ: microvascular resistance; SD: standard deviation; WU: Wood units; ∆: delta | ||||
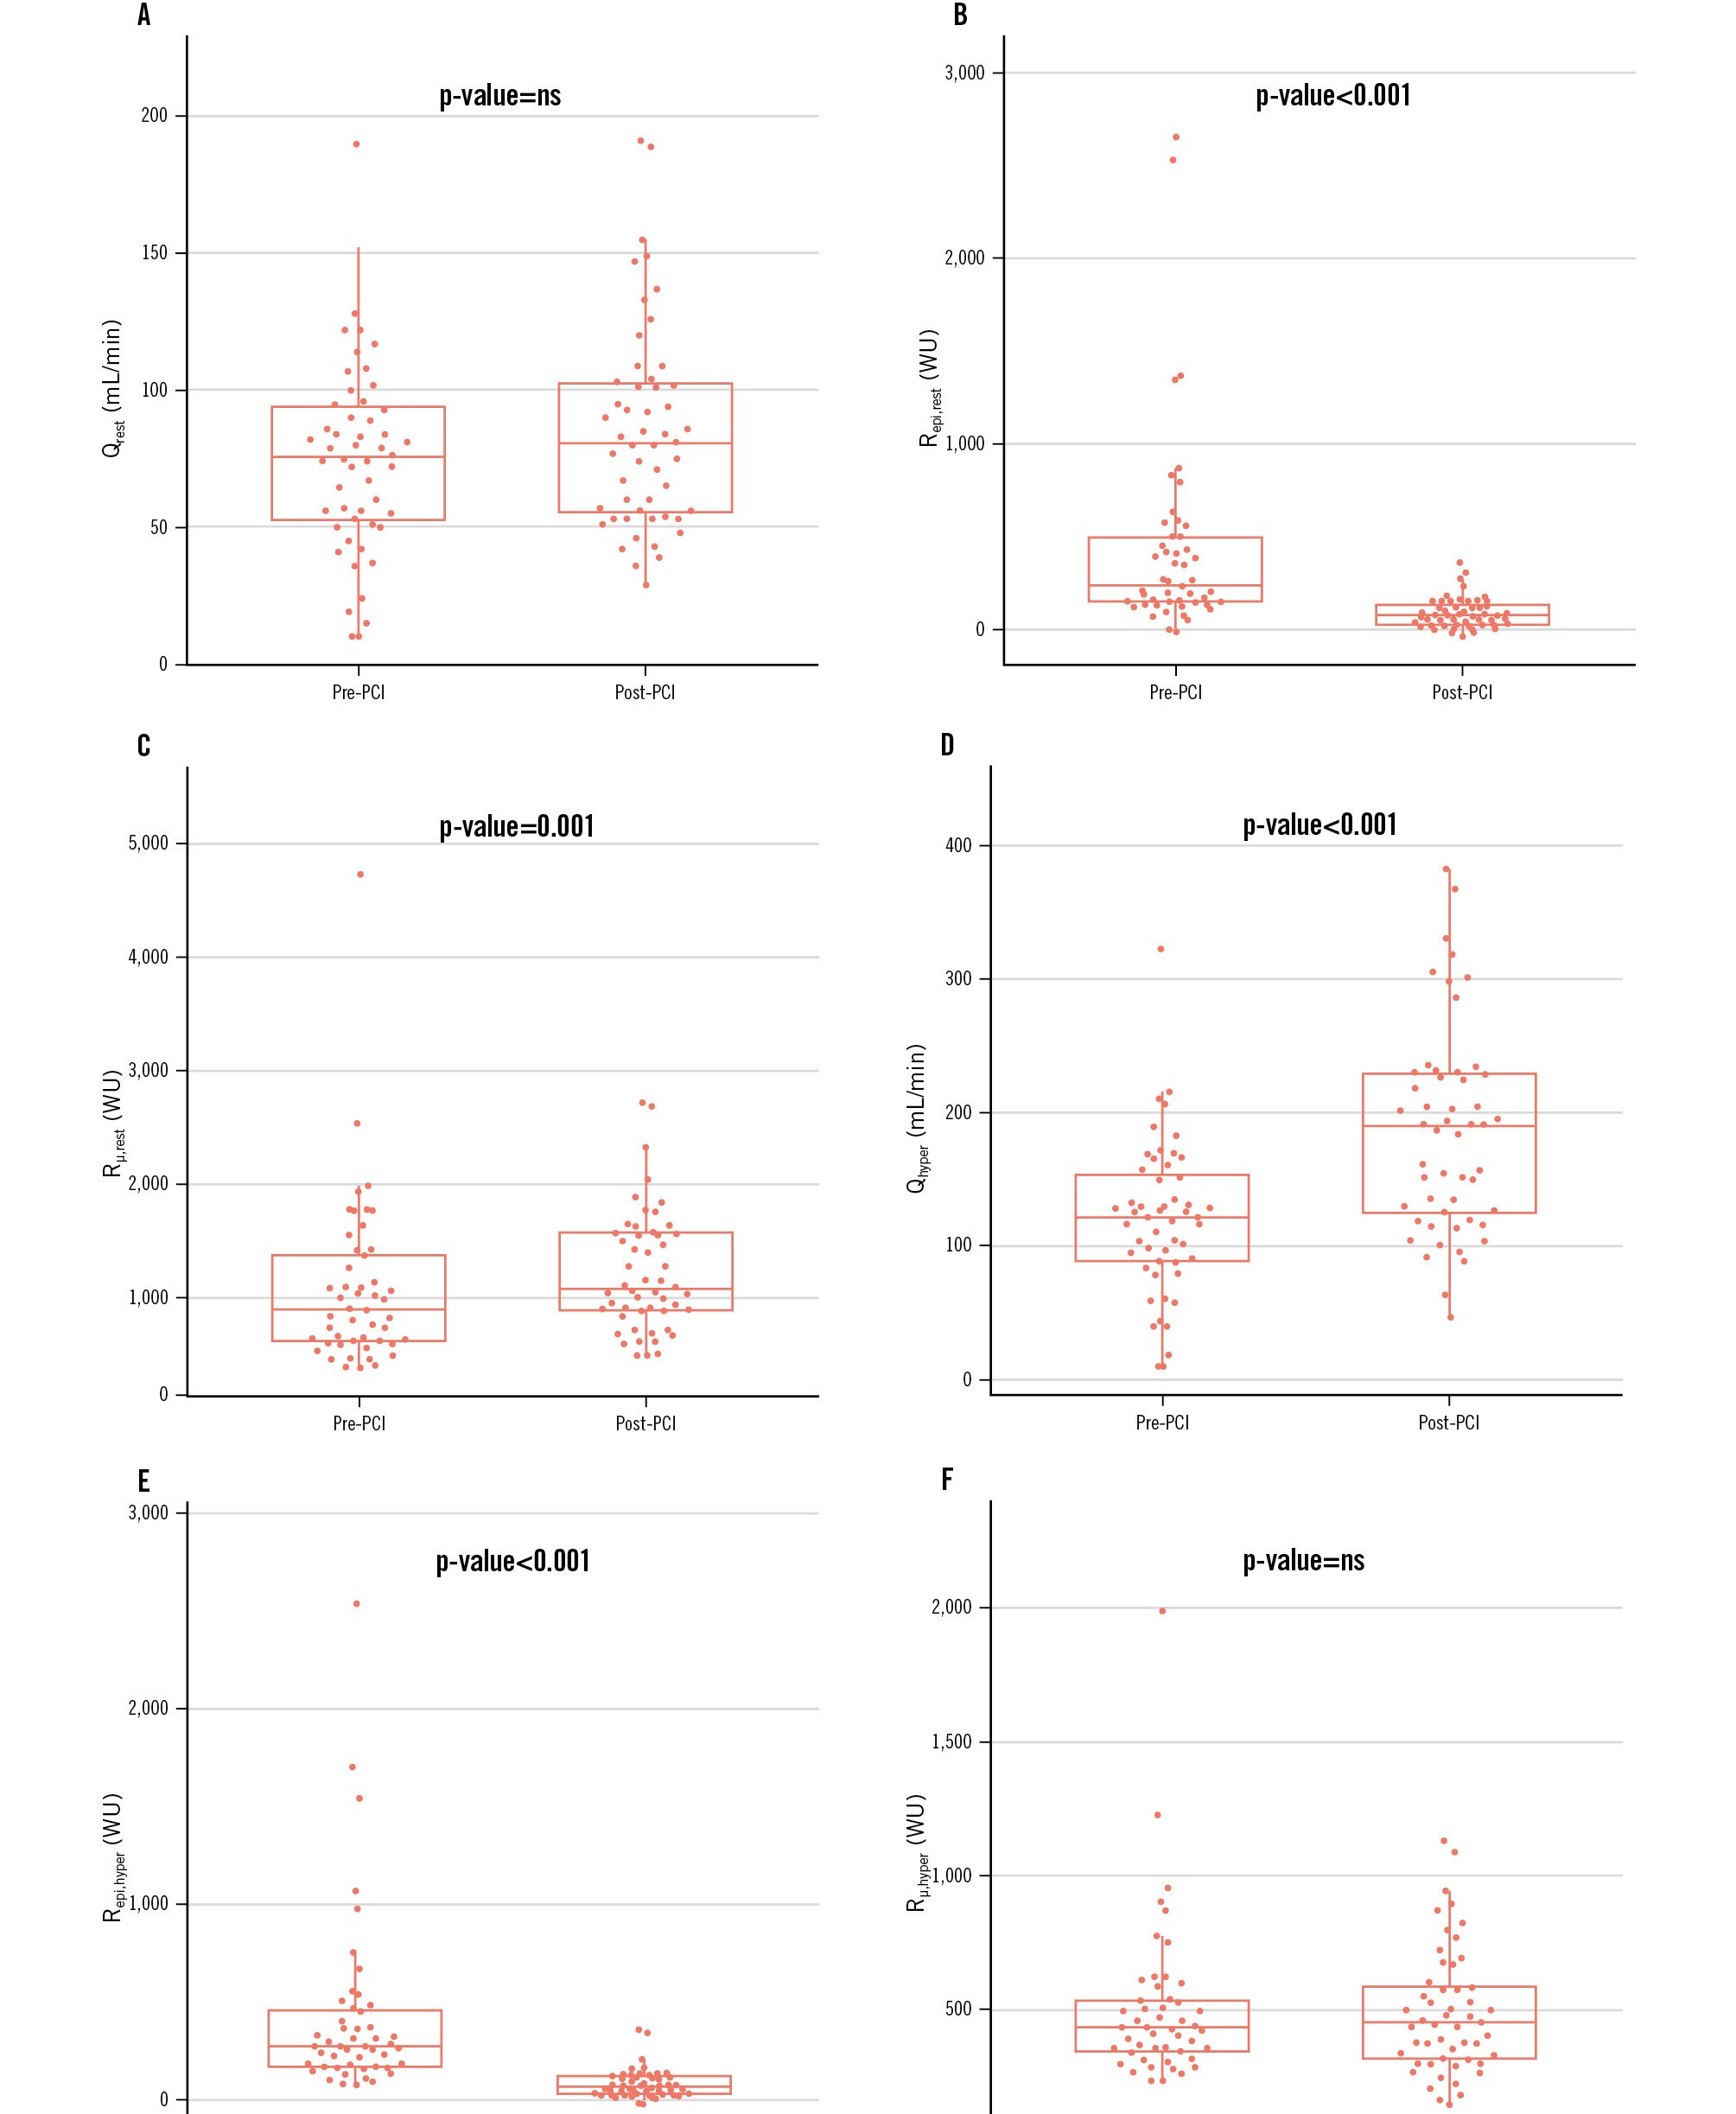
Figure 1. Pre- and post-PCI changes in coronary flow and resistance (absolute changes). Six paired box plots (A-F) compare baseline (pre-PCI) with post-intervention (post-PCI) values for each physiological variable: (A) Qrest; (B) Repi,rest; (C) Rµ,rest; (D) Qhyper; (E) Repi,hyper; (F) Rµ,hyper. Centre lines show the medians, boxes the IQR, and whiskers 1.5×IQR. Above each panel the Wilcoxon signed-rank p-value is reported as “p-value=ns” when p≥0.05, “p-value<0.001” when p<0.001, otherwise the exact value to 3 decimal places. ns: not significant; PCI: percutaneous coronary intervention; Qhyper: hyperaemic absolute coronary flow; Qrest: resting absolute coronary flow; Repi,hyper: hyperaemic epicardial resistance; Repi,rest: resting epicardial resistance; Rμ,hyper: hyperaemic microvascular resistance; Rµ,rest resting microvascular resistance; WU: Wood units
Quantitative coronary angiography
QCA was available in 32 out of 52 vessels. Four vessels were excluded because of poor image quality, and in 15 vessels, QCA could not be performed because calibration data were missing. The mean DS% was 67±14%, with a reference vessel diameter of 2.81±0.49 mm, an MLD of 0.95±0.42 mm, and a median lesion length of 22.1 mm (IQR 17.5-37.1). DS% correlated inversely with FFR (p=−0.40; p=0.030) and Pd/Pa (p=−0.39; p=0.037), whereas MLD correlated positively with FFR (p=0.48; p=0.009) and Pd/Pa (p=0.46; p=0.012). MLD also showed a moderate inverse correlation with hyperaemic epicardial resistance (Repi,hyper; p=−0.40; p=0.035). None of the QCA-derived parameters showed a significant correlation with microcirculatory resistance, either at rest or during hyperaemia. When assessing changes after PCI, the relative change of Repi,hyper correlated inversely with DS% (p=−0.39; p=0.042) and positively with MLD (p=0.42; p=0.024), indicating that more severe anatomical stenoses were associated with greater reductions in epicardial resistance following stenting. No significant correlations were observed between any QCA parameter and the relative increase in resting or hyperaemic absolute coronary flow after PCI (Supplementary Figure 2).
Pre-PCI predictors of change in hyperaemic coronary flow
The relative change in Qhyper (ΔQhyper) was significantly associated with a lower pre-PCI FFR (p=−0.53; p<0.001), and higher Repi,hyper (p=0.51; p<0.001) (Supplementary Figure 3). Notably, FFR demonstrated a strong inverse correlation with Repi,hyper (p=−0.83; p-value <0.001) (Figure 2). CFR, Rμ,hyper and MRR pre-PCI were not significantly correlated with ΔQhyper.
In univariate qGAMs (τ=0.50) on Yeo-Johnson-transformed ΔQhyper, baseline FFR demonstrated a hyperbolic association (EDF=1.94, χ²=5.61; p=0.074), with the steepest increases in median ΔQhyper occurring at lower FFR values and a plateau (ΔQhyper → 0) as FFR exceeded ~0.8 (Figure 3A). This model explained 19.4% of the deviance (adjusted pseudo-R²=0.23). In contrast, baseline epicardial resistance (Repi,hyper) exhibited a highly significant linear association (EDF=1.00, χ²=214.4; p<2×10⁻¹⁶), accounting for 28.6% of the deviance (adjusted pseudo-R²=0.45) (Figure 3B). These fin+dings indicate that, although both pre-PCI FFR and Repi,hyper predict median hyperaemic flow gain, epicardial resistance offers the stronger univariate signal.
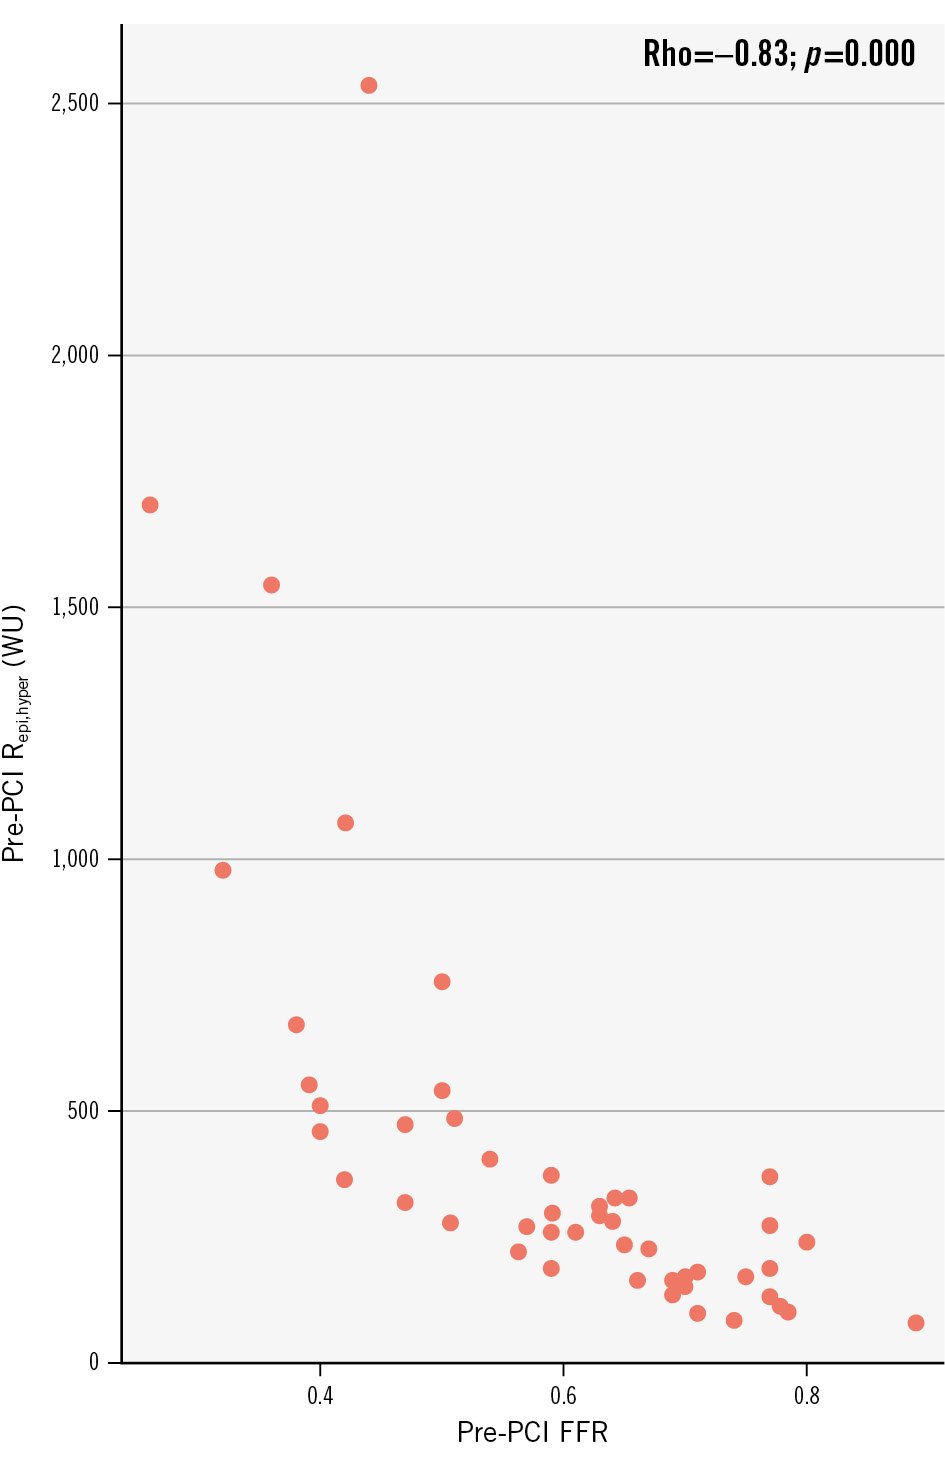
Figure 2. Relationship between fractional flow reserve and epicardial resistance. FFR: fractional flow reserve; PCI: percutaneous coronary intervention; Repi,hyper: epicardial resistance during hyperaemia; Rho: Spearman’s rho; WU: Wood units
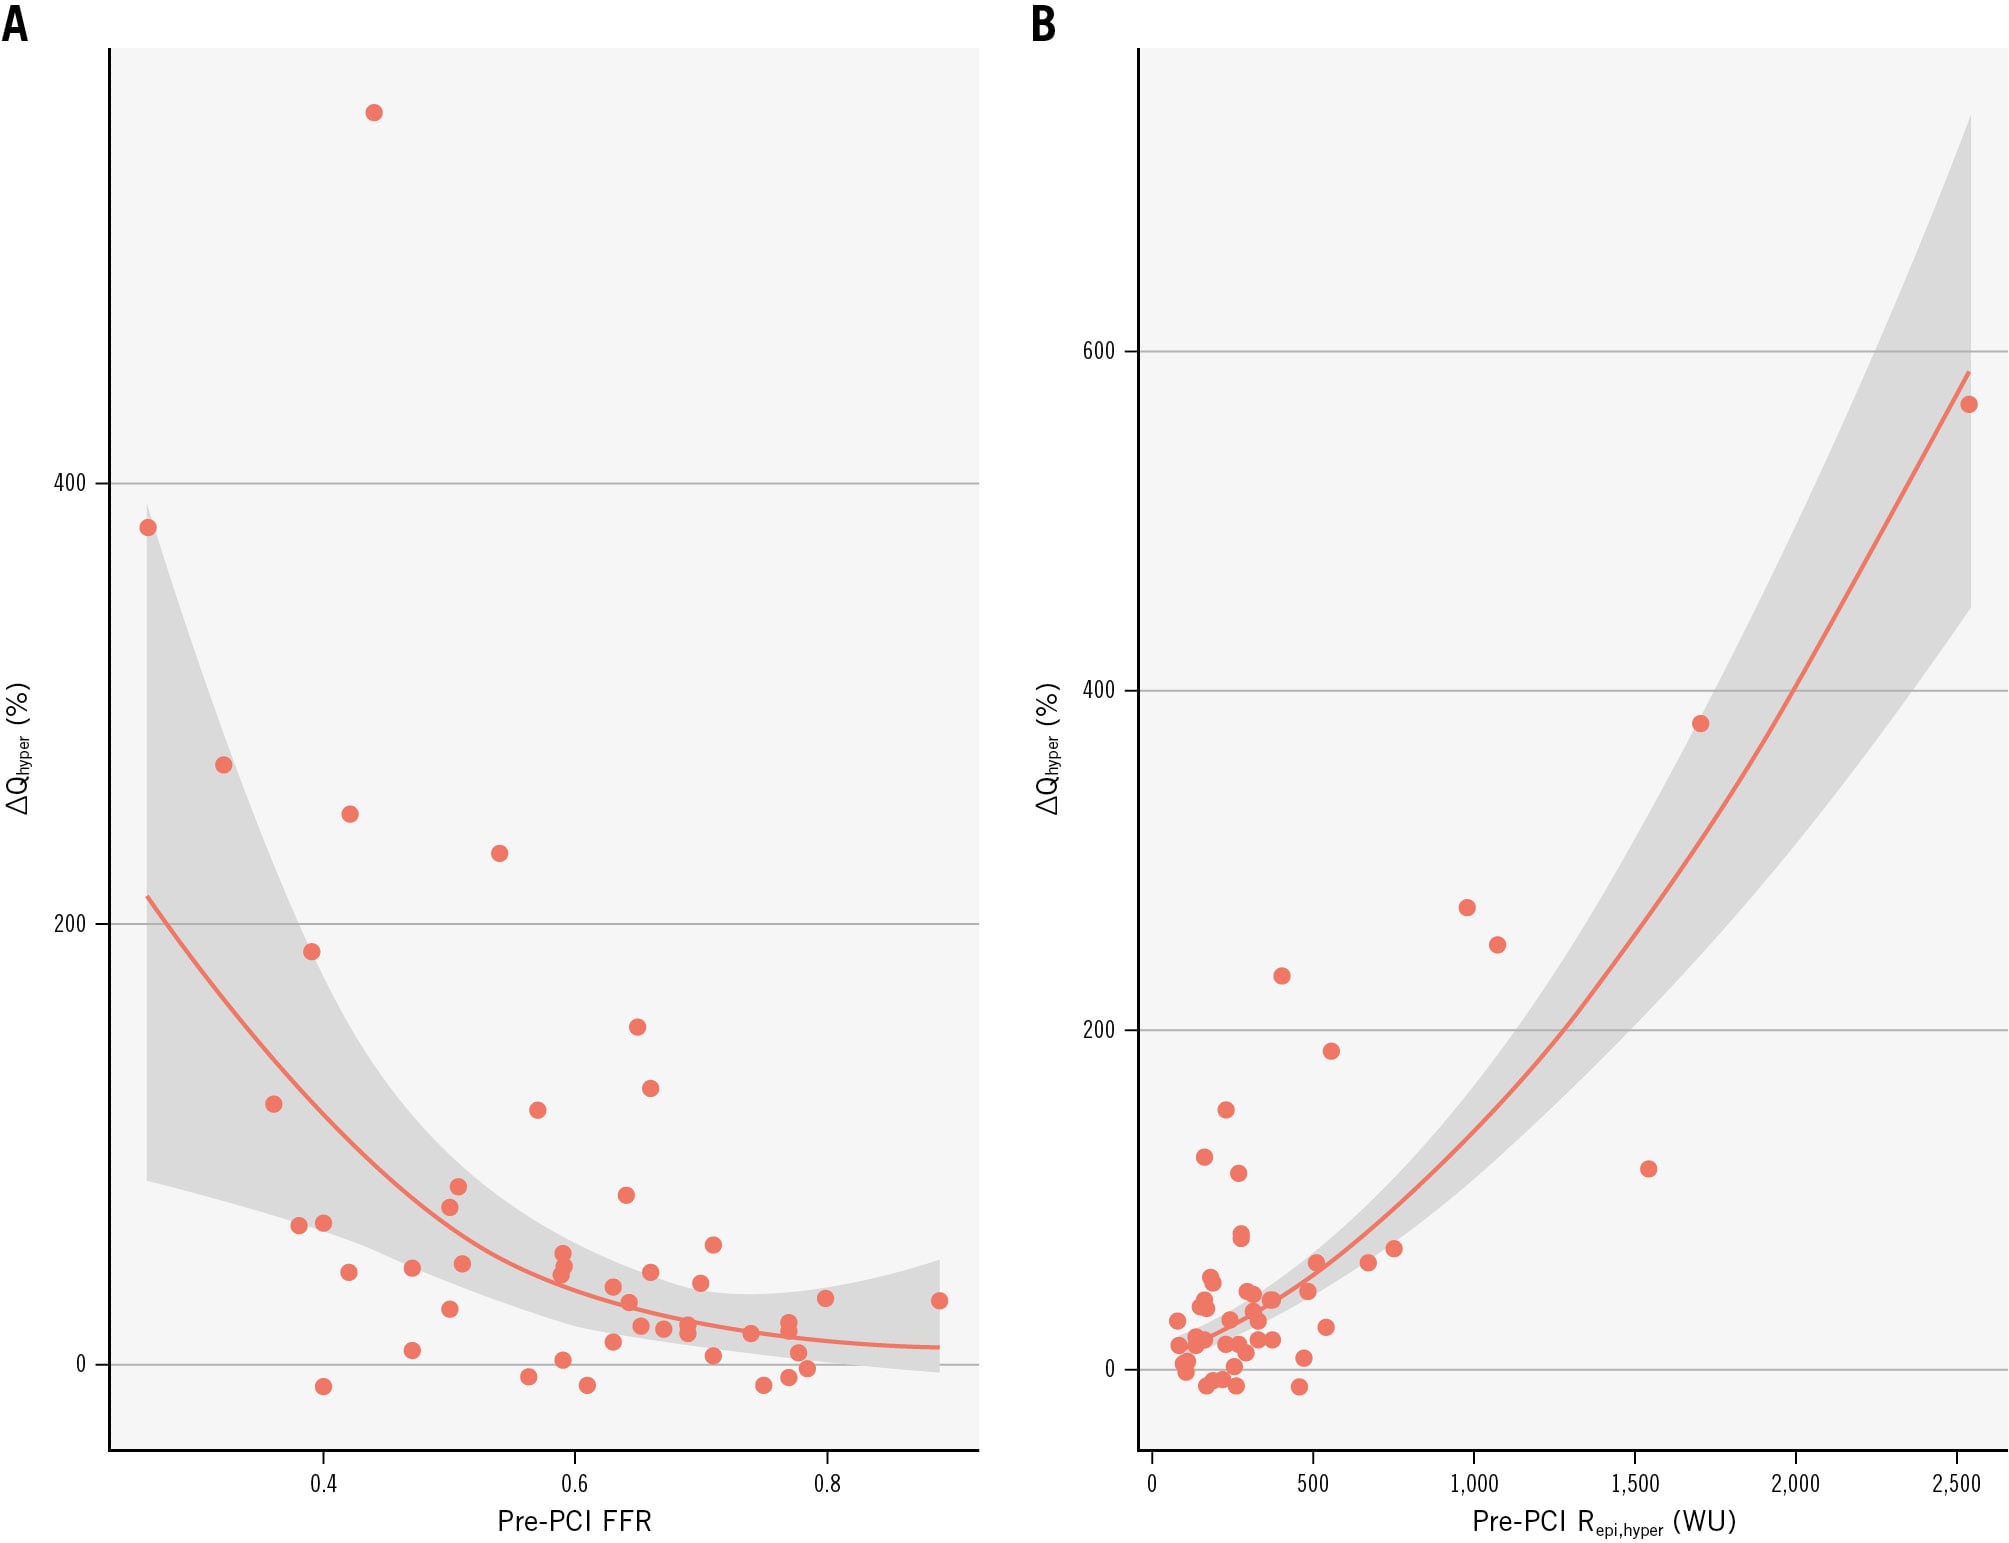
Figure 3. Pre-PCI predictors of hyperaemic flow change. Partial‐effect curves from univariate qGAMs (τ=0.5) showing the median ΔQhyper (%) plotted against baseline (pre-PCI) FFR and hyperaemic epicardial resistance (Repi,hyper): a hyperbolic increase in flow gain is seen at low FFR values, which plateaus as FFR approaches unity (A), and an approximately linear rise in flow gain is observed with higher Repi,hyper (B); shaded ribbons indicate 95% confidence intervals. FFR: fractional flow reserve; PCI: percutaneous coronary intervention; qGAM: quantile generalised additive model; Qhyper: hyperaemic absolute coronary flow
Impact of PCI on epicardial and microvascular hyperaemic myocardial resistance
ΔQhyper was strongly related to the reduction in total hyperaemic resistance (ΔRtotal,hyper; p=−0.84; p<0.001) and to its epicardial and microvascular components after PCI (ΔRepi,hyper; p=−0.47; p<0.001 and ΔRμ,hyper; p=−0.68; p<0.001, respectively).
Epicardial resistance decreased in 95% of vessels after PCI, and the reduction of Repi,hyper was strongly associated with the improvement of FFR (p=−0.84; p-value <0.001) (Figure 4A), which in turn was related to the improvement of ΔQhyper (p=0.52; p-value<0.001) as shown in Figure 4B.
Microvascular resistance showed a bimodal pattern, decreasing in 48% of vessels and increasing in the remainder. Accordingly, the increase in ΔQhyper was significantly larger in vessels with a reduction in Rμ,hyper post-PCI compared with those with an increase (+58.4 mL/min132 vs +15.4 mL/min [34.7]; p-value <0.001), despite a similar reduction in Repi,hyper in the two subgroups (−78.9 WU [33.6] vs −67.2 WU [38.6]; p-value=0.62).
To further assess the joint contribution of epicardial and microvascular resistance changes to the flow response, we fitted univariable and multivariable models. Both ΔRepi,hyper and ΔRμ,hyper were independently associated with the median increase in hyperaemic flow (ΔRepi,hyper: EDF 1.00, χ²=11.8; p=0.0006; ΔRμ,hyper: EDF 2.82, χ²=124.6; p<0.001). Figure 5 displays the back-transformed partial-effect curves from the multivariable model. In Figure 5A, progressive reductions in epicardial resistance are associated with an almost linear increase in the median ΔQhyper across the observed range. In Figure 5B, the relationship between ΔRμ,hyper and ΔQhyper is non-linear: when microvascular resistance decreases post-PCI, the median ΔQhyper rises steeply, whereas the increase in microvascular resistance progressively offsets the beneficial effect of epicardial resistance relief, so that the net flow gain is largely neutralised.
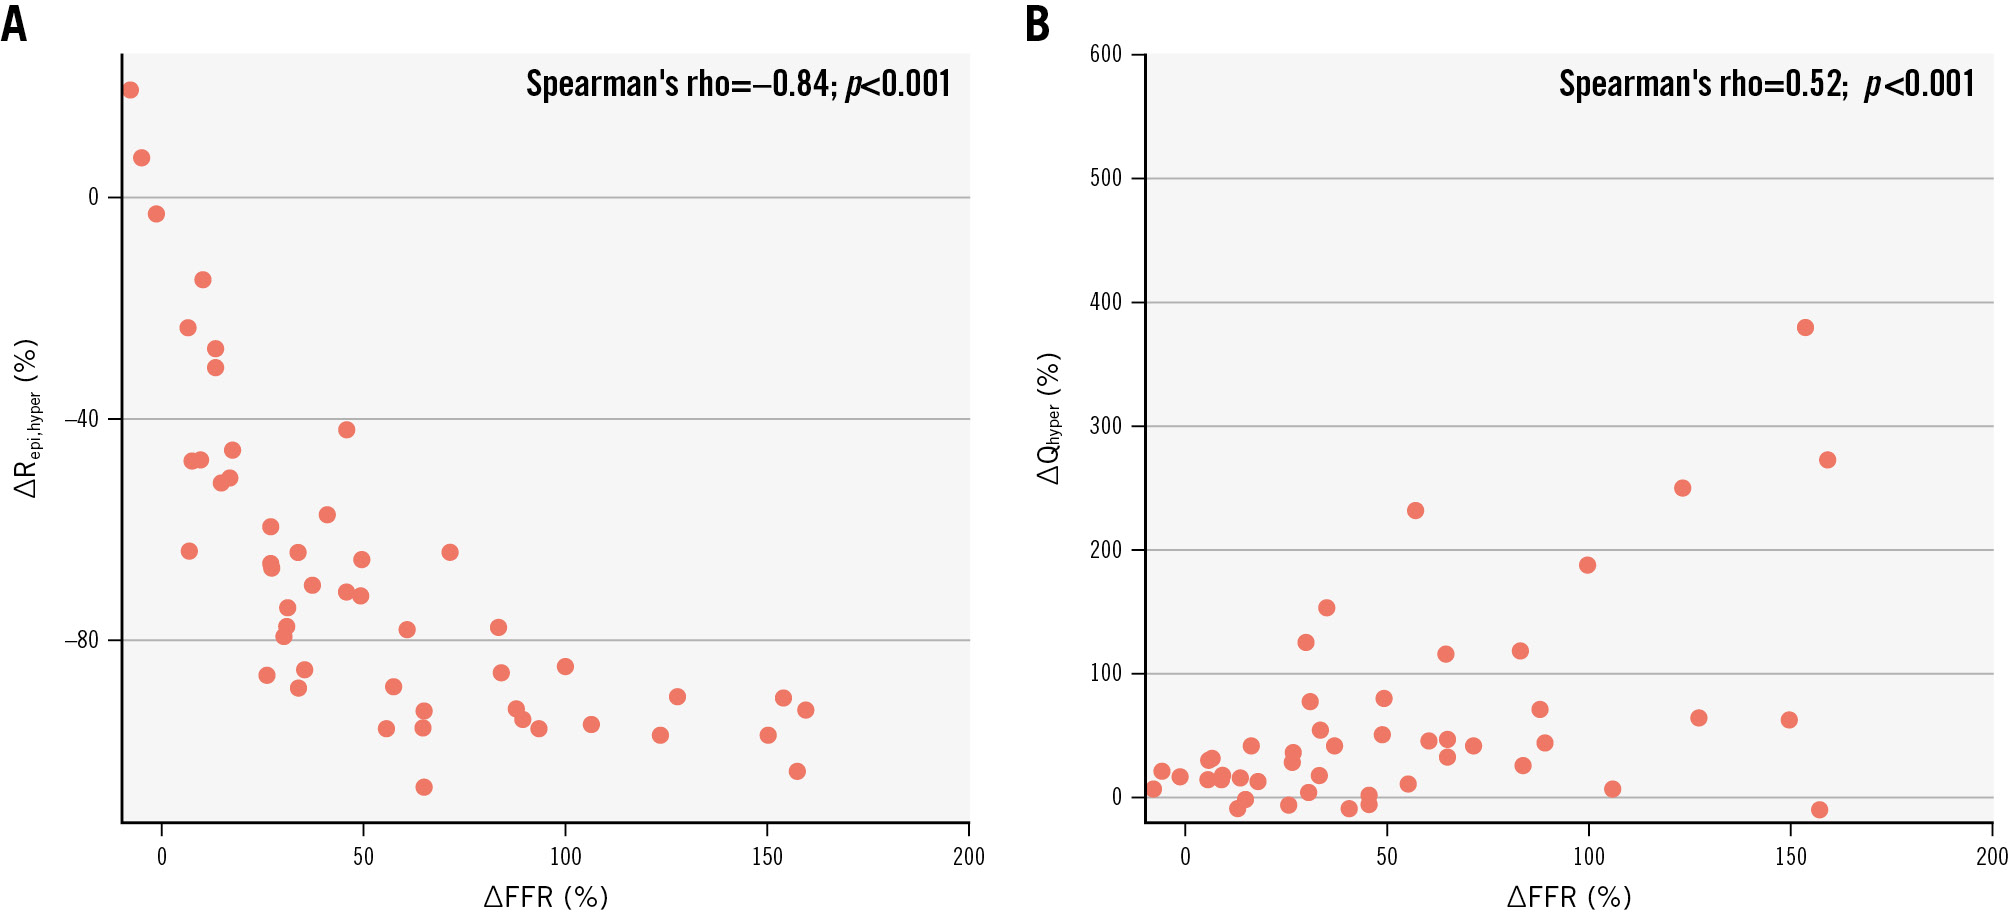
Figure 4. Correlation between the relative change in FFR and epicardial resistance and the relative hyperaemic flow change after PCI. A) The relative change (Δ) in FFR and Repi,hyper post-PCI; (B) the relative change in FFR and Qhyper post-PCI. FFR: fractional flow reserve; PCI: percutaneous coronary intervention; Qhyper: hyperaemic absolute coronary flow; Repi,hyper: hyperaemic epicardial resistance
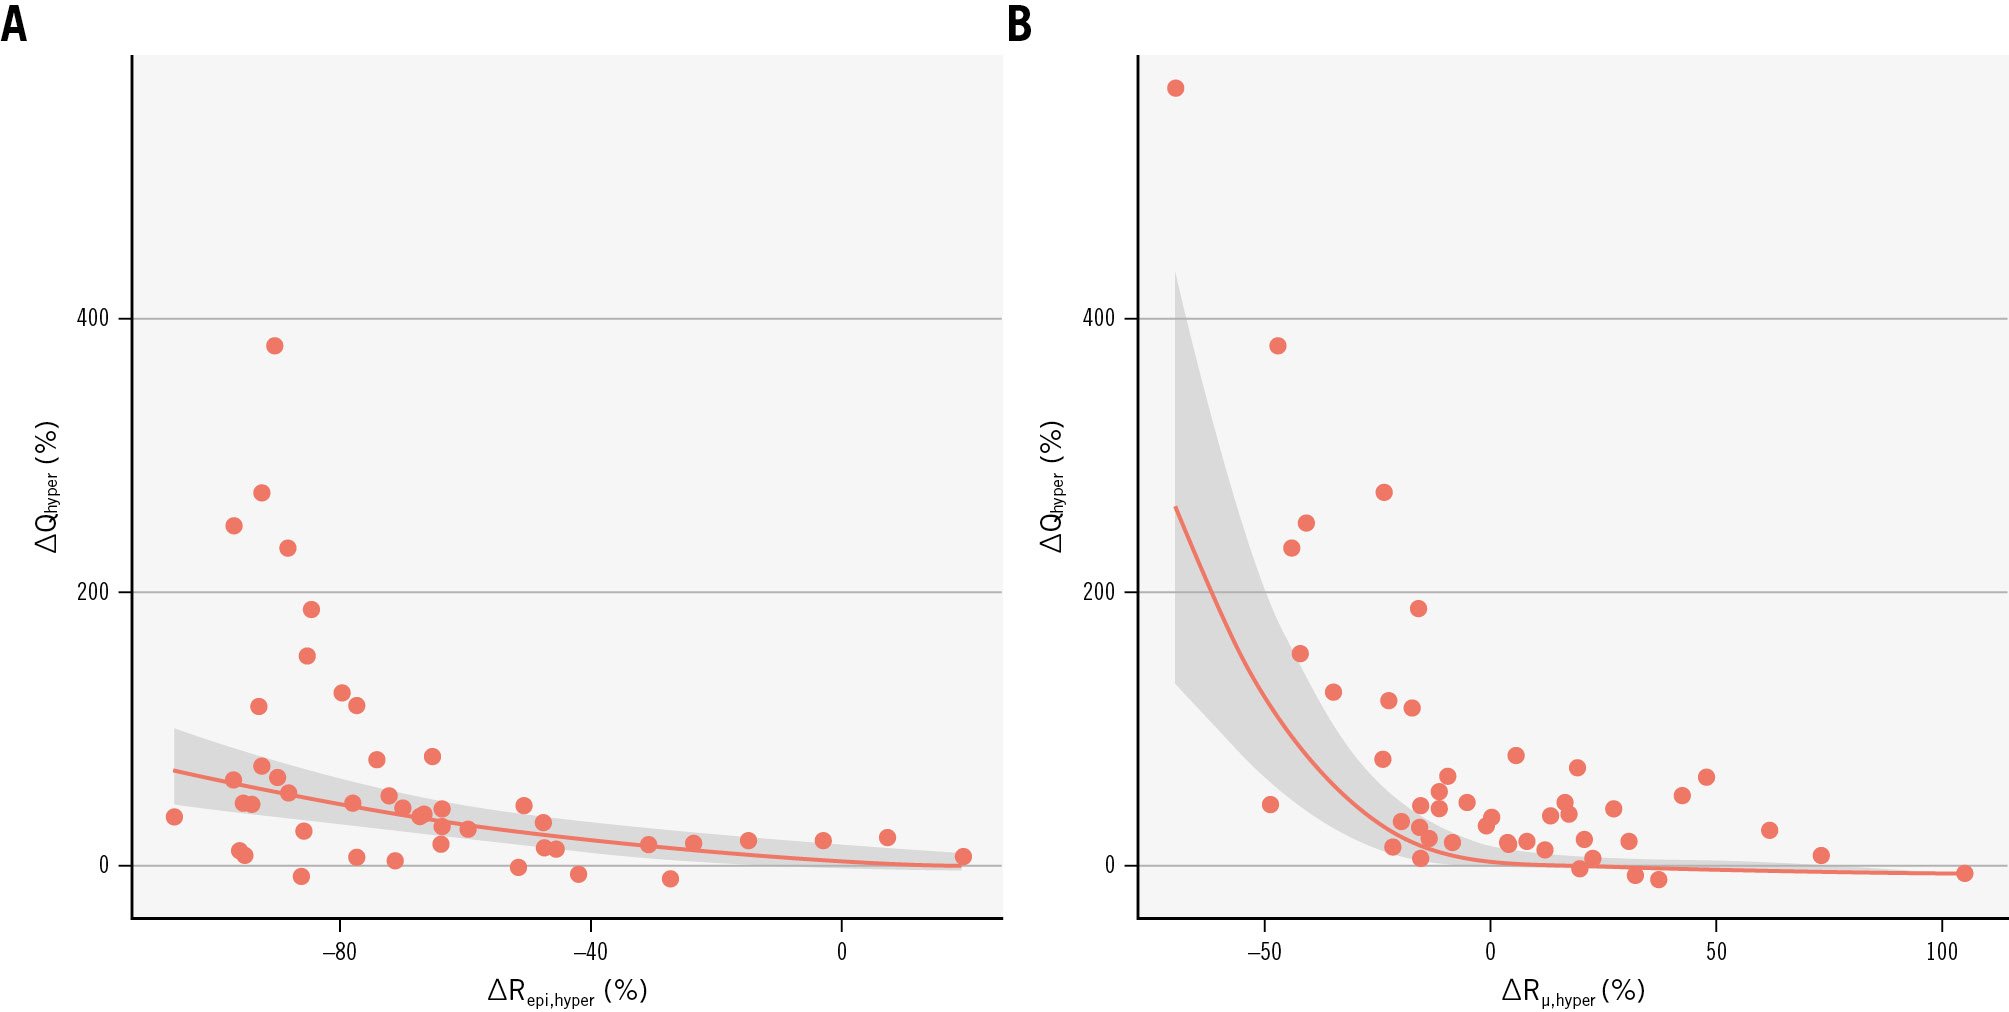
Figure 5. Impact of epicardial and microvascular resistance changes after PCI on hyperaemic flow. Partial-effect plots relating ΔRepi,hyper (A) and ΔRμ,hyper (B) to the relative hyperaemic flow increase (ΔQhyper). PCI: percutaneous coronary intervention; ΔQhyper: change in hyperaemic absolute coronary flow; ΔRepi,hyper: change in hyperaemic epicardial resistance; ΔRμ,hyper: change in hyperaemic microvascular resistance
Discussion
The present study investigated, for the first time, the impact of PCI on absolute coronary blood flow and myocardial resistance measured with continuous intracoronary thermodilution. The main findings of the study are the following (Central illustration): (1) PCI improves Qhyper with no significant impact on Qrest; (2) both resting and hyperaemic Repi decrease post-PCI; (3) Rμ,rest increases after PCI, whilst Rμ,hyper remains constant; (4) the main pre-PCI determinants of flow changes are FFR and epicardial resistance. Post-PCI flow is influenced by the relative changes in both epicardial and microvascular resistances.
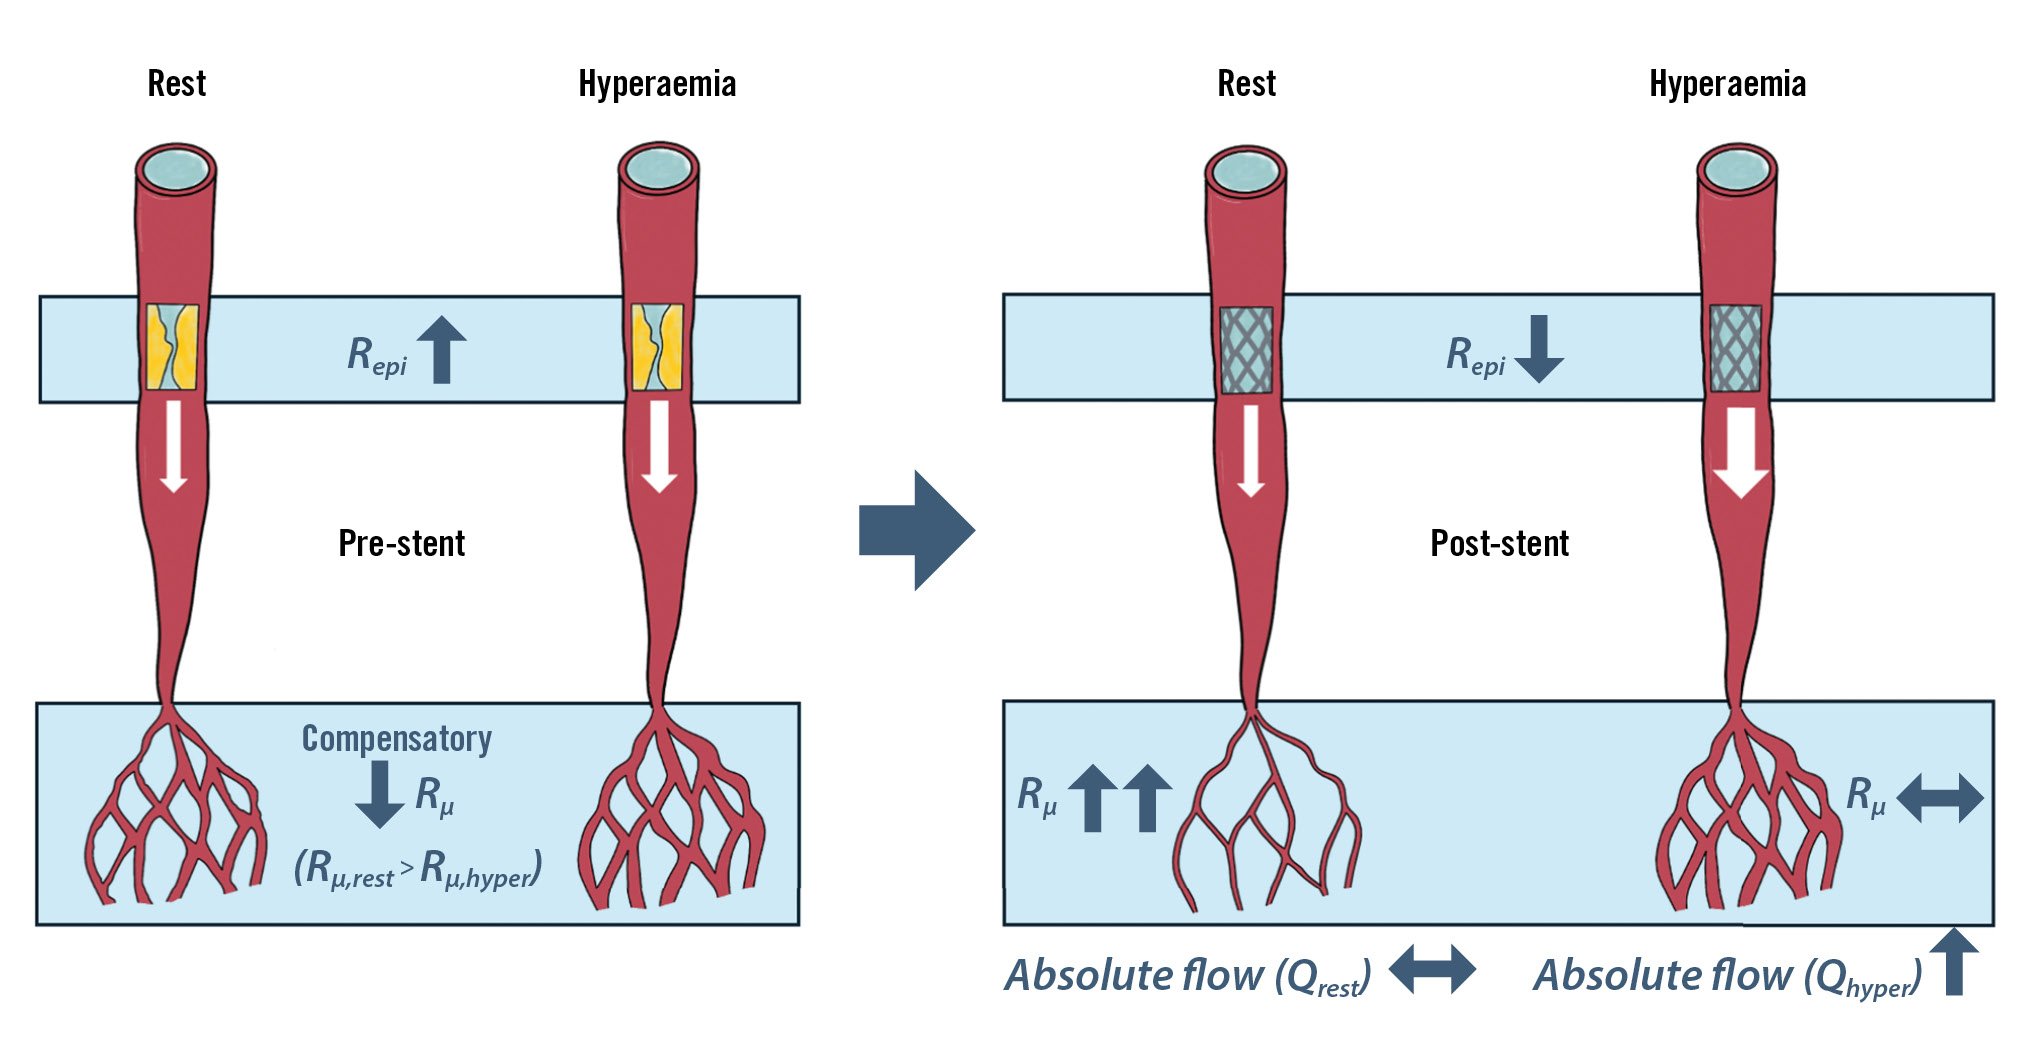
Central illustration. Immediate physiological effects of percutaneous coronary intervention on coronary flow and resistance. Qhyper: hyperaemic absolute coronary flow; Qrest: resting absolute coronary flow; Repi: epicardial resistance; Rμ: microvascular resistance; Rμ,hyper: hyperaemic microvascular resistance; Rμ,rest: resting microvascular resistance
The relation between flow and resistance at rest
In accordance with Ohm’s law, absolute coronary flow is inversely related to the total myocardial resistance, which is the sum of the epicardial and microvascular resistances. In our work, we demonstrated, using the continuous thermodilution technique, that despite PCI significantly reducing Repi,rest, Qrest remained unchanged. This is the result of a concomitant increase in Rμ,rest post-PCI, buffering the reduction in Repi,rest and keeping the Rtotal,rest unchanged. Of note, Qrest remained stationary, despite the fact that the resting aortic pressure showed a modest but statistically significant increase after PCI, further supporting the role of microcirculation in regulating flow. The behaviour of microvascular resistance at rest provides direct proof of coronary autoregulation as the mechanism maintaining consistency of blood flow across different degrees of coronary stenosis through a compensatory drop in microcirculatory resistances. Ischaemia is the result of the exhaustion of autoregulation that PCI aims to restore89. Our observations are consistent with those by Nijjer et al, who − by measuring flow velocity with a Doppler wire system − showed that there was a significant increase in resting flow velocity after intervention only in stenoses with an FFR ≤0.6010.
The relation between flow and resistance during hyperaemia
Contrary to Qrest, Qhyper was shown to significantly improve after PCI in our work (relative change: +39% [IQR 14.7-88.8]), as Repi,hyper decreased and Rμ,hyper remained stationary. It should be highlighted that the hyperaemic aortic pressure (Pa,hyper) did not change significantly before or after PCI, supporting the hypothesis that the improvement in flow is driven by the reduction in total resistance. These findings are again aligned with what was shown by Nijjer et al, who reported an increase in hyperaemic flow velocity, measured with a Doppler wire system, across all stenoses, with a relative change that was higher for the most significant stenoses (FFR <0.80). Equally, Kanaji et al11 showed that Qhyper significantly increased after PCI and that Rμ remained unchanged, though their findings were limited by the application of the continuous thermodilution technique using a non-dedicated single lumen microcatheter. The improvement of Qhyper resulted in a significant increase in the CFR, while MRR remained unchanged after PCI. These data prove that MRR, unlike CFR, is minimally influenced by Repi, as shown by Mahendiran et al, who, using a human model of controlled graded epicardial stenosis, demonstrated that regardless of the epicardial resistance, MRR exhibited a negligible decrease while CFR significantly decreased1213.
The value of FFR pre- and post-PCI
Pre-PCI FFR is a well-established marker of lesion severity; our data confirmed a significant correlation between FFR and epicardial resistance, as well as between angiographic indices (MLD and DS%). We observed a continuous relationship between pre-PCI FFR values and the magnitude of coronary flow improvement after PCI. In contrast, no significant correlations were observed between any QCA parameter and the relative increase in resting or hyperaemic absolute coronary flow after PCI. Aligning with this finding, the Placebo-controlled Trial of Percutaneous Coronary Intervention for the Relief of Stable Angina (ORBITA-2) trial by Foley et al demonstrated that physiological stenosis severity, as measured by FFR and the instantaneous wave-free ratio, predicts placebo-controlled angina relief from PCI14. Additionally, Johnson et al showed that lower pre-PCI FFR values are associated with a higher risk, thereby conferring larger absolute benefits from revascularisation15. We reinforce the value of physiology-guided revascularisation in predicting coronary flow improvement post-PCI, symptom relief, and the prognostic benefits of myocardial revascularisation.
The correlation observed between a change in FFR and hyperaemic flow change after intervention supports the value of pre- and post-PCI FFR (FFRpre and FFRpost, respectively) assessment as a potential surrogate of coronary flow improvement. FFR is theoretically defined as the maximum achievable blood flow in the presence of a stenosis divided by the maximum flow (Qmax) if there is no obstructive epicardial coronary disease at all16 (Equation 11). It follows that the ratio of pre- and post-PCI FFR equals the ratio of pre- and post-PCI hyperaemic flow (Qpre and Qpost, respectively) (Equation 12).

Equation 11.

Equation 12.
As hypothesised, we found a strong relation between the pre- and post-PCI ratios of FFR and hyperaemic flow (p=0.63; p<0.001) (Figure 6), supporting the expected coupling between the change in FFR and the change in hyperaemic flow. This is in agreement with previous findings from Aarnoudse et al who found good agreement between the increase in thermodilution-derived volumetric blood flow after PCI and the increase in FFR5. In contrast, Kanaji et al11 found no relationship between the change in FFR and the increase in hyperaemic flow. This discrepancy may stem from different equipment and hyperaemia-induction methods. In our study, saline was infused using a dedicated microcatheter with four side holes (RayFlow), which is the demonstrated gold standard for continuous thermodilution4. Kanaji et al measured flow using a microcatheter with a single distal end-hole (3.9 Fr, KIWAMI [Terumo]). The microcatheter used in our study has a larger outer diameter (0.84 mm vs 1.3 mm for KIWAMI), which might translate into greater haemodynamic impact on the FFR measurement, especially in diseased vessels. The haemodynamic effect of the microcatheter is indeed a well-established cause of discordance when FFR is measured conventionally or with continuous thermodilution, with a mean difference of ~0.03 FFR317. In this regard, in our cohort, we found a broadly similar difference in FFR values measured with the two approaches (0.05 FFR)317. Another difference between our study and that of Kanaji et al lies in the method for induction of maximal hyperaemia. Kanaji et al reached maximal hyperaemia with a continuous intracoronary infusion of saline at 20 mL/min on top of peripheral adenosine infusion, postulating that adenosine infusion can further increase Q when compared with saline infusion only. In our study, maximal hyperaemia was reached only with a continuous infusion of saline through the RayFlow microcatheter, as previous studies have shown that it guarantees maximal hyperaemia18192021.
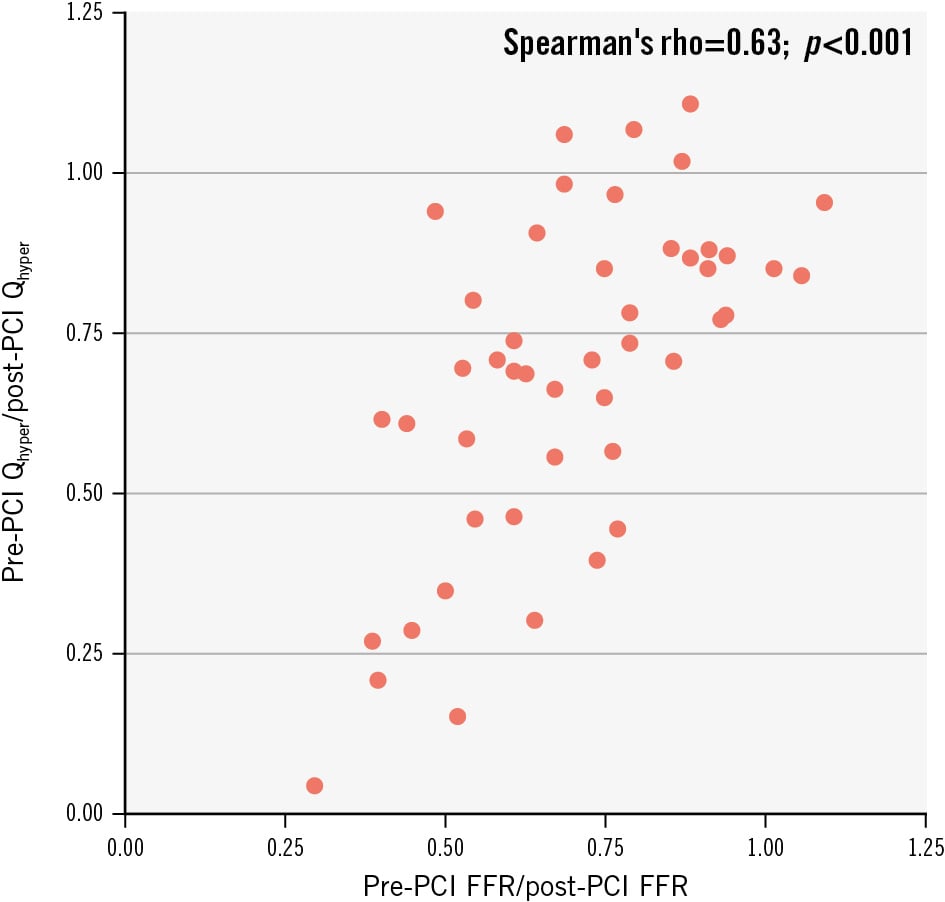
Figure 6. Correlation between the pre- and post-PCI ratio of FFR and the pre- and post-PCI ratio of hyperaemic coronary flow. FFR: fractional flow reserve; PCI: percutaneous coronary intervention; Qhyper: hyperaemic absolute coronary flow
The impact of microvascular resistance change after PCI
Despite the strong relation between pre- and post-PCI ratios of FFR and hyperaemic flow as shown in Figure 6, in our study we observed a reduction in Qhyper following PCI in 4 out of 52 cases (8%), despite an improvement in FFR post-PCI and stationary haemodynamic conditions compared with pre-PCI. This pattern is compatible with previous literature. Matsuda et al showed a 14% discordance rate between FFR and flow velocity following successful PCI22. Similarly, Kanaji et al observed a reduction in coronary sinus flow, as measured by phase-contrast cine-magnetic resonance, in 24% of patients with successful PCI despite positive FFR changes11. In our study, cases with a discordance between a drop in Qhyper and improvement in FFR were all associated with increased Rμ post-PCI. The relative changes of Rμ,hyper after PCI could explain the potential discordance between FFR and Q changes after PCI. The equivalence between FFR and Q ratio (Equation 12) is based on the assumption that microvascular resistance is minimal and constant after PCI, a condition not often met, as evidenced in our cohort. Indeed, we observed that after PCI, Rμ,rest increased in 35 vessels (71%) and decreased in 14 (29%), leading to a significant cohort-level increase. Conversely, Rμ,hyper increased in 25 vessels (51%) and decreased in 24 (49%), resulting in a neutral overall effect.
Several mechanisms may explain the observed changes in Rμ after PCI. As discussed above, the increase in Rμ,rest after PCI, paired with the modestly changed Rμ,hyper is a hallmark of the autoregulation mechanism that occurred in 13 (27%) cases. However, in 22 cases (45%), we observed a simultaneous increase in Rμ,rest and Rμ,hyper; this phenomenon can be interpreted as the result of distal embolisation after PCI232425. On the other hand, a combined decrease in Rμ,rest and Rμ,hyper after PCI (observed in our cohort in 11 cases [22%]) can be the result of an intrinsic vasodilatory response of the microcirculation immediately after the procedure. This would fit with what has been reported by Verhoeff et al, who showed a decrease of Rμ,hyper to a level below that of the corresponding non-treated reference vessel in the immediate post-PCI period26. Equally, in a larger cohort of 245 vessels, Murai et al showed that the index of microvascular resistance significantly decreased after PCI (median 1.9 [IQR −4.9 to 10.1])27. The reduction of hyperaemic resistance after PCI is supposed to be related to an increase in distal pressure after the intervention, which leads to an increase in the diameter (flow-mediated dilation) of the microvasculature, according to a mechanism often referred to as “pressure dependence of hyperaemic microvascular resistance”282930.
This is the first study investigating the relative changes of Q, Repi, and Rμ at rest and during maximal hyperaemia in a real-world cohort of patients undergoing PCI. Our data reveal that flow results from a complex interaction between epicardial and microvascular resistances, both of which can be directly and indirectly affected by PCI. Despite advancements in PCI techniques, residual angina persists in up to 60% of patients undergoing PCI, as recently demonstrated in the ORBITA-2 study31. While various hypotheses have been proposed to explain this phenomenon, it would seem that a better understanding of the behaviour of coronary flow and resistance after PCI might play a role, underscoring the need for further research in the field.
Limitations
Several limitations of our study should be acknowledged. First, an a priori sample size calculation was not possible because of the lack of preliminary data. This may affect the statistical power of our findings and their generalisability, which should therefore be considered hypothesis-generating and useful for the design of future studies. The relatively small sample size also limits our ability to draw firm conclusions for different subgroups. Coronary flow is influenced by haemodynamic variables, such as heart rate and driving pressure. Additionally, flow was not indexed for the subtended myocardial mass. However, we believe that the paired data analysis adopted in our study effectively addresses this limitation, enhancing the robustness and reliability of our conclusions. Flow and resistance were measured 5 to 10 minutes after PCI, and our results may be influenced by the presence of acute and reversible mechanisms. Wedge pressure and central venous pressure measurements were largely unavailable, precluding quantification of collateral flow; therefore, we cannot exclude a contribution of collateral dynamics to the observed changes in absolute coronary flow after PCI. In this study, maximal hyperaemia was induced by intravenous adenosine infusion, which should be regarded as a surrogate of exercise-induced hyperaemia and not an equivalent stimulus. The physiological and haemodynamic responses to adenosine hyperaemia cannot be considered directly comparable to those observed during exercise. An invasive follow-up was not part of our protocol.
Impact on daily practice
This study demonstrated that percutaneous coronary intervention (PCI) markedly reduces epicardial resistance, resulting in a significant flow increase that is strongly predicted by pre-PCI fractional flow reserve (FFR). The improvement in FFR after PCI closely reflects the gain in flow, supporting the measurement of post-PCI FFR not only as a prognostic index but also as an indicator of effective flow restoration. Furthermore, the finding that resting flow remains unchanged underscores the compensatory role of the coronary microcirculation, with important implications for patient management.
Conclusions
This study demonstrated that PCI significantly reduces epicardial resistance, leading to a pronounced increase in hyperaemic flow, which can be predicted by FFR. Resting flow remained unchanged because of compensatory increases in microvascular resistance, providing direct evidence of coronary flow autoregulation in humans. MRR was unaffected by PCI, confirming its specificity as an index of microvascular function.
Conflict of interest statement
The authors have no conflicts of interest to declare related to the present manuscript.
Supplementary data
To read the full content of this article, please download the PDF.