Cory:
Unlock Your AI Assistant Now!
Abstract
Background: Assessing aortic stenosis (AS) haemodynamics under stress may distinguish physiological responses beyond traditional severity metrics.
Aims: We aimed to evaluate symptomatic patients with moderate AS and preserved left ventricular ejection fraction (LVEF) using invasive and non-invasive assessments at rest and during stress, hypothesising that the stress aortic valve index (SAVI) would show only modest agreement with echocardiographic parameters of AS severity but would be associated with clinical outcomes.
Methods: We prospectively enrolled 52 patients with moderate AS and preserved LVEF but who were symptomatic without an alternative explanation. The SAVI, quantifying the relative reduction in maximal flow, was measured but remained blinded. Comprehensive assessment included echocardiography (at rest, bicycle and dobutamine stress), calcium scoring, and clinical outcomes. Patients were managed according to current standards without knowledge of the SAVI and followed for ≥1 year.
Results: Invasive transvalvular gradient increased from 25±9 mmHg at rest to 42±14 mmHg during dobutamine. The aortic-to-left ventricular pressure ratio declined from 0.82 (interquartile range [IQR] 0.78-0.88) at rest to a SAVI of 0.70 (IQR 0.63-0.79) under stress. Resting aortic valve area (AVA) did not predict stress haemodynamics, underscoring physiological heterogeneity. Notably, 25/52 (48%) of patients demonstrated a SAVI ≤0.70, comparable with a severe AS cohort studied separately. Blinded SAVI scores independently predicted the need for clinical aortic valve (AV) intervention (hazard ratio 5.7; p=0.007), whereas AVA and sex-specific calcium thresholds did not.
Conclusions: Stress haemodynamic assessment in moderate AS unmasks a subgroup, not identified by conventional metrics, who are at significantly higher risk for AV intervention. Patients with abnormal stress physiology despite only moderate AS at rest may benefit from AV intervention, supporting this pilot study as the basis for a future randomised trial.
Moderate aortic stenosis (AS) occurs twice as frequently as severe AS12 and is associated with a worse survival than no or mild AS34. However, guideline management essentially recommends watchful waiting, assuming the accuracy of technical measurements56. Additionally, quantification of AS severity usually takes place under baseline or resting conditions when patients are asymptomatic, while complaints of exertional dyspnoea or angina arise during stress conditions.
These inconsistencies suggest an imperfect distinction between moderate and severe AS. Indeed, it has long been appreciated that a stenotic aortic valve (AV) does not behave like an orifice7, as is demanded by the aortic valve area (AVA) equation proposed without empirical support in 1951 by the Gorlins8. Diseased aortic valves display a variety of responses to exercise7 or dobutamine stress910, implying that baseline or resting measurements alone do not fully capture their abnormal physiology.
With this background, we propose a stress aortic valve index (SAVI) based on two key principles9. First, measurements should be made during stress conditions to better match when symptoms develop. Second, the metric should track with the relative reduction in maximal flow due to the stenotic valve – a “fractional flow” for AS – unlike the absolute gradient that lacks a clear physiological interpretation9. After developing and validating SAVI in patients with severe AS9, we demonstrated similar findings in low-gradient AS11.
The current prospective study measured the SAVI in patients with moderate AS who presented with symptoms (dyspnoea, chest pain, or syncope) without an alternative explanation. We hypothesised that the SAVI would display only modest agreement with echocardiographic parameters of aortic stenosis severity at rest and during stress, and that the SAVI would be associated with clinical outcomes during follow-up. Our objectives were (1) to compare the SAVI with echocardiographic parameters obtained at rest, during bicycle exercise, and during dobutamine stress for the evaluation of aortic valve stenosis severity and (2) to evaluate the association between the SAVI and clinical outcomes.
Methods
Our prospective, multicentre, blinded, observational trial enrolled patients with moderate AS and unexplained cardiac symptoms. Each local ethics board approved the protocol, and each subject provided written informed consent. The study was prospectively registered at ClinicalTrials.gov: NCT04514250 (SAVI-AoS), and its protocol was published previously12. We received partial industry and government funding for this work, but these organisations played no role in study design, data analysis, or manuscript preparation.
Study population
Symptomatic patients with only moderate AS were eligible if they met the following inclusion criteria: age ≥50 years, standard resting echocardiogram within the prior 3 months showing an AVA >1 cm2 plus either an AV peak velocity of 2.5-3.9 m/s or an AV mean gradient of 15-39 mmHg, baseline ejection fraction >50%, and the ability to undergo exercise stress testing. The AVA was calculated using the continuity equation, based on the left ventricular outflow tract (LVOT) diameter, LVOT velocity-time integral, and transaortic velocity-time integral.
Exclusion criteria included untreated and significant proximal coronary artery disease; severe valvular regurgitation of any valve including mitral and tricuspid; interventricular septal thickness ≥15 mm; uni- or bicuspid aortic valve anatomy; atrial fibrillation with uncontrolled ventricular response; severe comorbidities with a life expectancy <2 years; advanced lung disease like chronic obstructive pulmonary disease, home oxygen dependence, ≥2 pulmonary inhalers, or severe pulmonary hypertension; and symptomatic right ventricular failure.
Cardiac catheterisation
Clinical pathways differed among sites, but ultimately each subject underwent a clinically indicated invasive cardiac catheterisation for unexplained symptoms and to quantify aortic valve severity. If significant coronary artery disease was discovered, the patient was documented as a screen failure. Medications such as beta blockers were held on the day of the procedure to avoid blunting the dobutamine response.
Following routine coronary angiography, a 0.014” pressure sensor was introduced into the aorta and equalised. Subsequently, the aortic valve was crossed in standard retrograde fashion using a typical guiding catheter (Amplatz left or Judkins right), and the pressure wire was inserted into the left ventricle (LV). The catheter was then retracted into the high ascending aorta while keeping the pressure wire in the LV, thus providing continuous and simultaneous pressure tracings from both locations. After recording baseline measurements (including the aorta/left ventricle ratio [Ao/LV] at rest), an infusion of dobutamine at 20 or 40 μg/kg/min was started (depending on the severity of the resting gradient) and continued for approximately 10 minutes at a fixed dose13. Finally, the pressure wire was retracted into the aorta to assess for drift and signs of LVOT obstruction. Only 1 case (subject #30) demonstrated dynamic LVOT obstruction during dobutamine; for the analysis of that subject, stress measurements were taken before dynamic obstruction. Another isolated case had an interrupted acquisition during which the pressure wire was temporarily ejected into the aorta and needed to be reinserted.
The analysis of anonymous pressure tracings was performed centrally and in a blinded fashion using previously described software algorithms914. These post hoc results, including the SAVI, were not disclosed to the managing cardiologists during the study, although operators were aware of the mean valve gradients during the procedure as per routine. The Central illustration depicts the set-up and SAVI calculation. As detailed previously9, the SAVI reflects relative pressure loss over the aortic valve during systolic ejection at peak stress. For example, a value of 1.0 implies no pressure loss, whereas a SAVI of 0.7 indicates that, under peak conditions, 30% of the driving pressure from the LV is lost across the AV. This relative reduction in pressure loss strongly correlates with the relative reduction in maximal flow due to the stenotic AV, surpassing the mean valve gradient during stress (correlation coefficient: 0.831 for SAVI vs –0.756 for the absolute stress gradient)9.
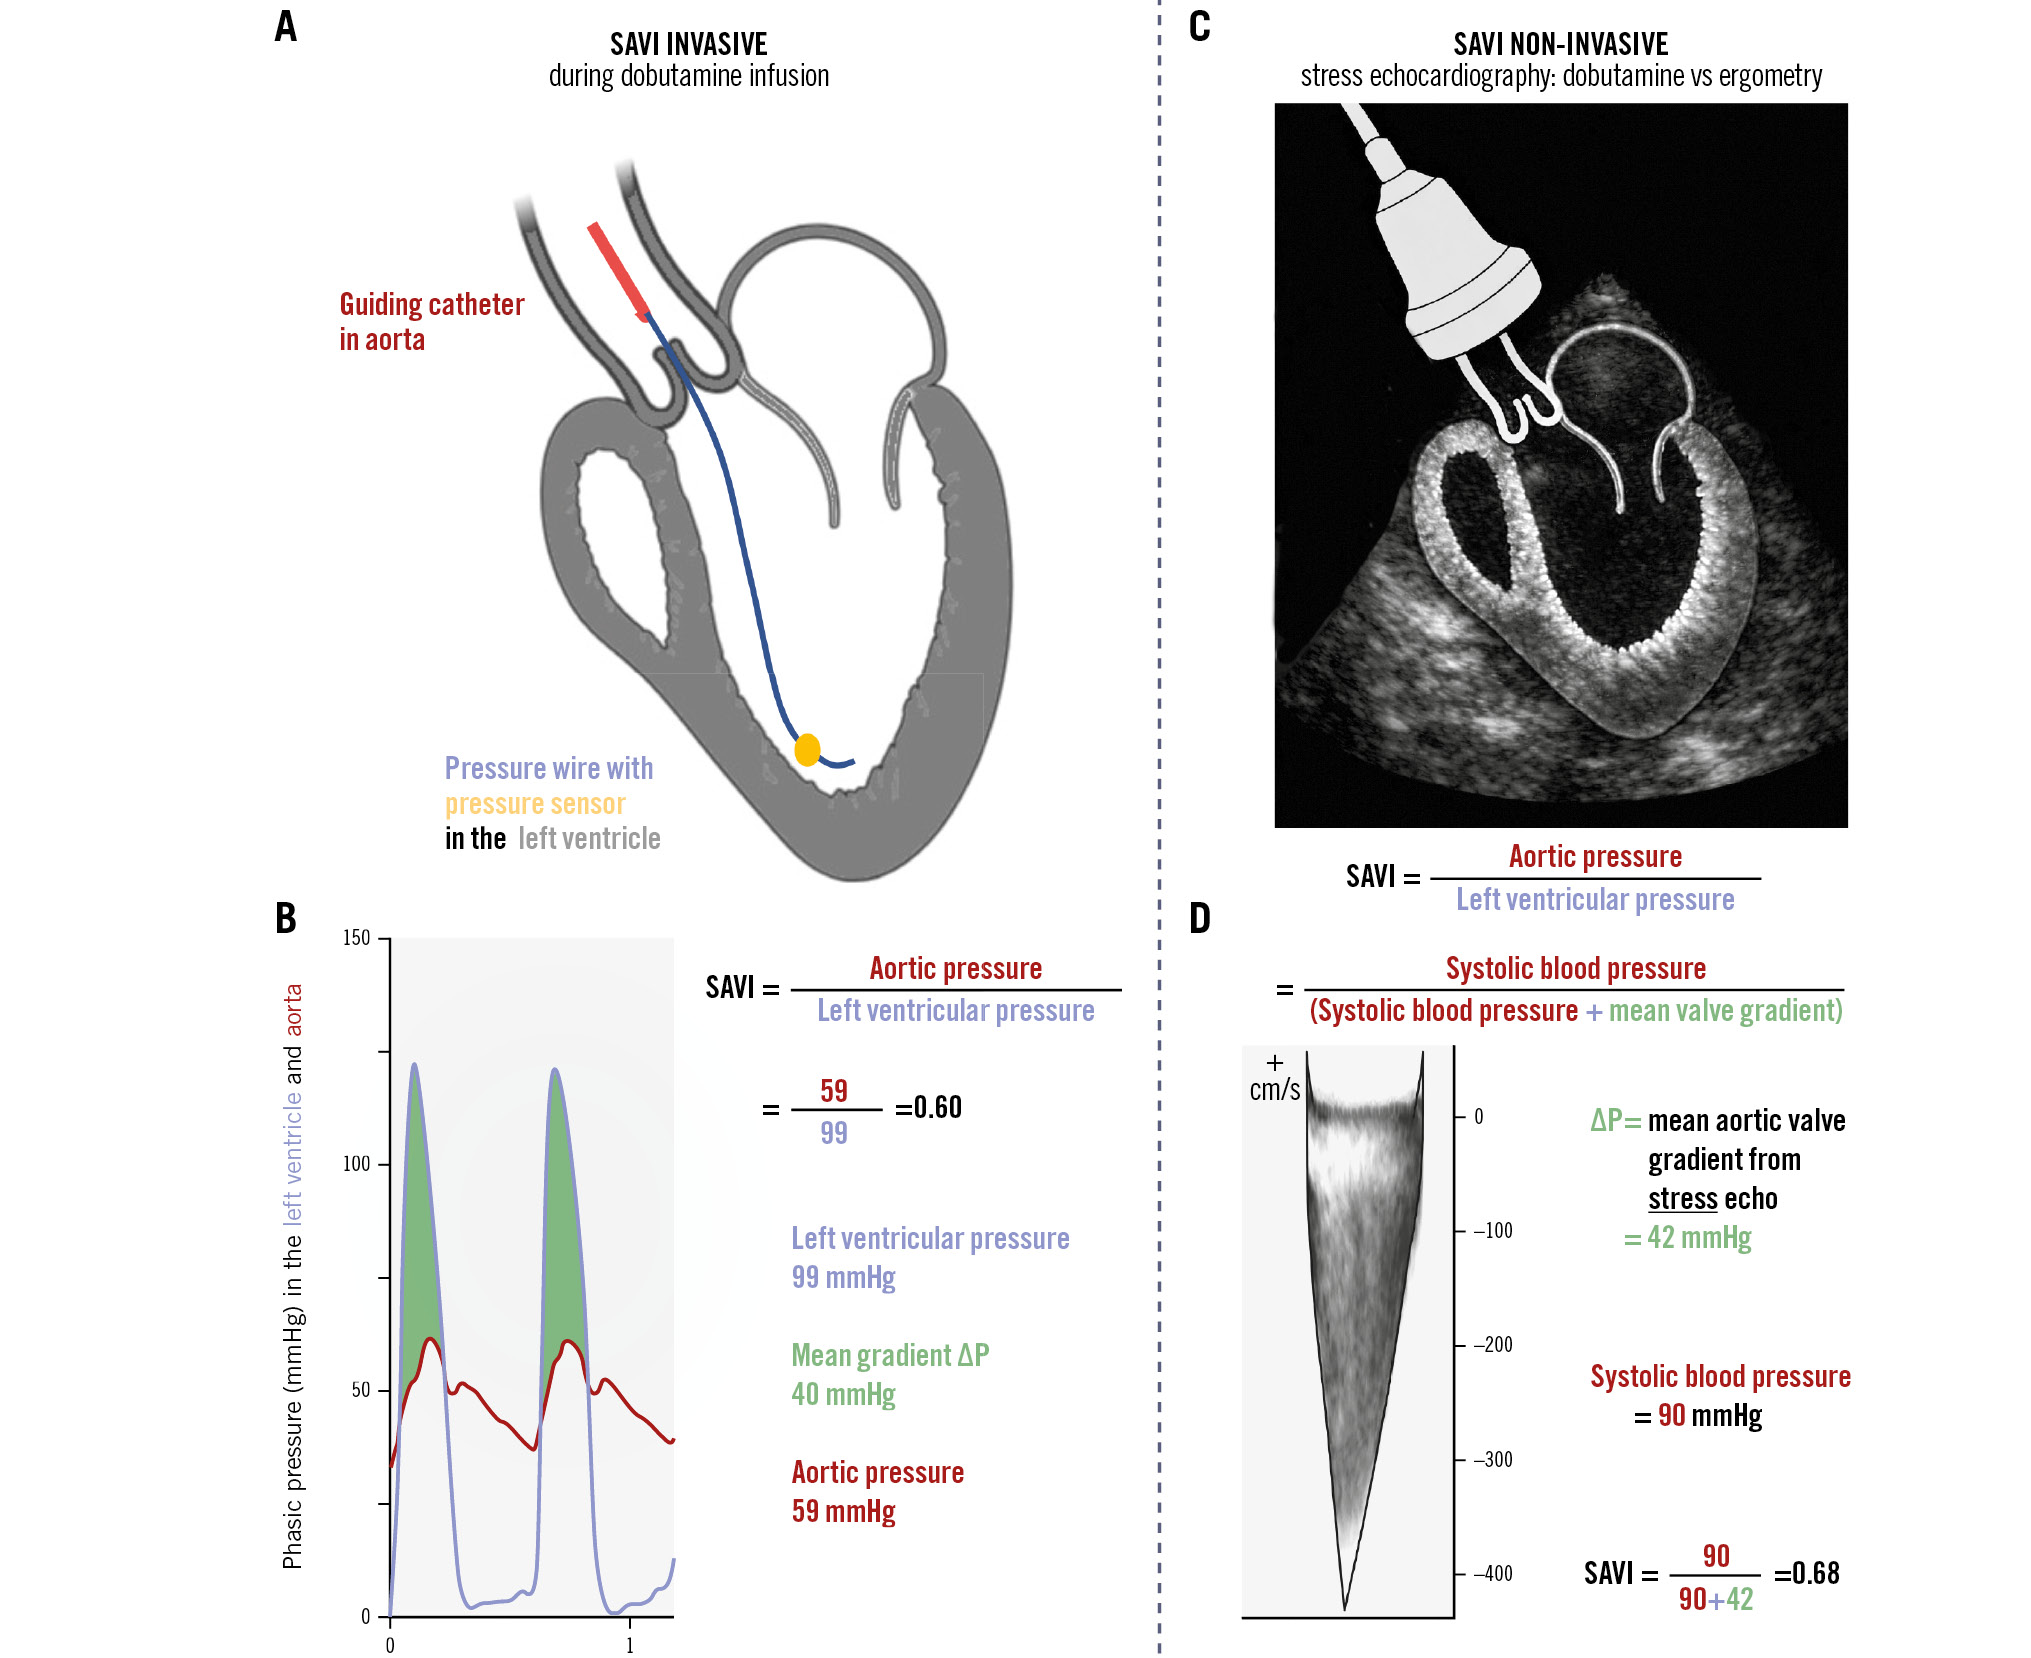
Central illustration. What is the SAVI? A) Invasive set-up, annotated. B) Example illustrating the calculation of the stress aortic valve index (SAVI) during invasive aortic valve assessment with the use of dobutamine. C) Non-invasive set-up. D) An example where the SAVI is calculated with the use of bicycle stress ergometry (same calculation when using dobutamine stress echocardiography). ΔP: aortic valve pressure gradient
Stress echocardiography
Dobutamine stress echocardiography (DSE) was performed concurrently with cardiac catheterisation. Measurements were acquired at rest and during dobutamine infusion. In a separate setting, subjects underwent bicycle stress echocardiography (BSE) using a standard incremental protocol (starting at 25 watts, then increasing by 25 watts every 2 minutes until fatigue). For both types of stress echocardiography, aortic valve pressure gradients (ΔP) were traced offline in a central and blinded fashion by experienced cardiac imagers. The SAVI was calculated using the formula (systolic blood pressure)/(systolic blood pressure+ΔP) as previously detailed9.
Cardiac computed tomography
Subjects underwent a baseline multidetector computed tomography (MDCT) scan of the heart using electrocardiogram gating. For contrast images, at least one full cardiac cycle was acquired to measure systolic and diastolic parameters and to evaluate valve anatomy. The AVA was traced in mid-systole (20-30% of the R-R interval). The aortic valve calcium (AVC) score was derived from the non-contrast MDCT images. Cutoff values for AVC were sex-specific and based on recommendations from the European guidelines (>2,000 Agatston units [AU] for males, >1,200 AU for females)6. If no valvular intervention was performed, then the MDCT scan for calcium scoring was repeated after 1 year. MDCT images were centrally analysed by experienced imaging cardiologists and radiologists blinded to the haemodynamic assessments.
Clinical evaluation
Symptoms underwent physician assessment using the standard Canadian Cardiovascular Society (CCS) classification of angina pectoris, New York Heart Association (NYHA) grading of heart failure, and the presence of otherwise unexplained syncope or presyncope. Subjects completed the Kansas City Cardiomyopathy Questionnaire (KCCQ) and a 6-minute walk test (6MWT). High-sensitivity cardiac troponin and N-terminal pro-B-type natriuretic peptide (NT-proBNP) were drawn. After 1 year, these assessments were repeated in subjects who had not received aortic valve replacement (AVR) by either transcatheter aortic valve implantation (TAVI), surgical aortic valve replacement (SAVR), or balloon valvuloplasty. Subjects were followed for at least 1 year for clinical events including all-cause death, AVR (TAVI, SAVR, or balloon valvuloplasty), stroke, new-onset atrial fibrillation, and hospitalisation for heart failure. Management by the local cardiologist was neither prescribed nor influenced by the study protocol and reflected current practice as influenced by geography, longitudinal monitoring of symptoms, and potentially repeat testing and patient preference.
Statistical analysis
The primary endpoint assessed the association between the SAVI and echocardiographic parameters. Secondary endpoints included the predictive ability of the SAVI for clinical outcomes during follow-up, its relationship with clinical and imaging parameters (including the KCCQ quality-of-life survey, functional capacity 6MWT, biomarkers like troponin, and valve calcium score), and its variation by the type of stress and measurement modality.
Statistical analysis was performed with SPSS, version 29 (IBM) and RStudio, version 2023.03.0 (Posit PBC). We employed standard statistical techniques with further details in Supplementary Appendix 1. Applicable tests were two-tailed, and p<0.05 was considered statistically significant. The binary threshold for the SAVI was 0.70 based on prior work in patients with severe AS before and after TAVI9. However, the chosen value of 0.70 was further investigated by predicting AVR during follow-up using receiver operating characteristic (ROC) curve analysis and the Youden index for the optimal threshold, including an additional time-dependent ROC analysis. Our published cohort of 16 subjects with severe AS undergoing TAVI9 served as a comparator for the frequency of an abnormal SAVI ≤0.7.
Originally the sample size target was 100 subjects12, based on the differential correlation of SAVI versus AVA (Pearson correlation coefficients of 0.831 vs 0.555, respectively) with peak flow reduction due to severe AS that improved after TAVI9. However, due to logistical reasons, we were only able to recruit 52 total subjects, which reduced the study’s power. Therefore, we considered the multivariable survival models to be mainly hypothesis-generating and utilised a “multiverse analysis” approach15 instead of focusing on a potentially biased subset.
Results
Between April 2021 and September 2023, we prospectively recruited subjects from 5 hospitals across the Netherlands, United States, and Denmark. Supplementary Figure 1 details study recruitment, testing, and follow-up. No subject experienced complications related to the comprehensive aortic valve evaluation. Notably, 11 subjects were screen failures due to significant coronary artery disease, and 1 subject died from an out-of-hospital cardiac arrest between study consent and invasive coronary angiography. Finally, 52 subjects underwent invasive evaluation of the SAVI and formed the basis for the following results.
Table 1 details key baseline characteristics for the entire cohort, as well as for subgroups with a normal SAVI>0.7 and abnormal SAVI ≤0.7; complete characteristics can be found in Supplementary Table 1. Notably, no striking differences existed between normal and abnormal SAVI subjects, especially when considering the large number of comparisons. Symptoms assessed by the KCCQ and functional status assessed by a 6MWT were not strong predictors of a low SAVI. Supplementary Table 2 presents the univariate predictors of a continuous and binary SAVI and found no strong associations.
Table 2 summarises the comprehensive assessment of the aortic valve, again with complete results in Supplementary Table 1. Notably, neither the AVA at baseline by echocardiography nor the AV calcium score distinguished between normal SAVI>0.7 and abnormal SAVI ≤0.7 responses to dobutamine stress. Supplementary Table 3 examines the univariate predictors of a continuous and binary SAVI, while Supplementary Table 4 and Supplementary Figure 2-Supplementary Figure 3-Supplementary Figure 4-Supplementary Figure 5 present pairwise correlations between many variables (including SAVI vs biomarkers, calcium score, and 6MWT; as well as SAVI vs dobutamine stress, bicycle exercise, and resting echocardiography). In general, worse AV haemodynamics at rest (mean gradient, peak velocity, and the Ao/LV ratio) were associated with a higher likelihood of an abnormal SAVI ≤0.7 – albeit with substantial overlap – while stress parameters logically showed the strongest associations with the SAVI.
Each subject had a maximum of 3 distinct assessments of the SAVI: invasive using dobutamine, non-invasive using dobutamine, and non-invasive using bicycle ergometry. Supplementary Figure 6-Supplementary Figure 7-Supplementary Figure 8 provide pairwise Bland-Altman analyses. Bicycle ergometry produced less vigorous stress than dobutamine, as evidenced by higher SAVI values when compared with either invasive (+0.15; paired p-value<0.001) or non-invasive (+0.06; paired p-value<0.001) assessment. At similar dobutamine levels, invasive measurements yielded higher gradients compared with non-invasive measurements, as the SAVI was lower by 0.07 (paired p-value<0.001) or –9%, potentially due to challenges with finding a high-quality Doppler signal during stress conditions.
Figure 1 demonstrates the heterogeneous response of the valve to stress by comparing the resting mean Ao/LV (that has no physiological interpretation) against the SAVI during dobutamine infusion (indicating the relative reduction in maximal transvalvular flow). In the current cohort, 48% of valves demonstrated an abnormal SAVI, comparable to the stress severity seen in a prior cohort of patients with severe AS undergoing TAVI for clinical indications9. Supplementary Figure 9 displays the individual haemodynamic responses for each subject in the cohort.
All subjects either experienced an event (death) or completed 1-year clinical follow-up; the median total follow-up was 20 (interquartile range 12-29) months. Table 3 summarises all clinical events as well as the repeated 1-year assessments in subjects who did not undergo AVR or die. Despite clinicians being blinded to the SAVI value, the incidence of TAVI or SAVR during follow-up was significantly higher in patients with an abnormal SAVI ≤0.70. Figure 2 depicts the survival curves for AVR stratified by various metrics, of which the SAVI demonstrated the strongest predictive ability. The optimal threshold of 0.70 for SAVI to predict AVR was established by ROC analyses (Supplementary Figure 10, Supplementary Figure 11). Supplementary Table 5 provides univariate models predicting AVR, with a graphical display in Supplementary Figure 12. Supplementary Table 6 presents the C-statistic and correlation coefficients of baseline imaging and haemodynamic parameters with changes in valve area, gradients, calcium score, NT-proBNP, 6MWT distance, and KCCQ score at 1-year follow-up. The set of multivariable models15 in Supplementary Figure 13 demonstrated that a continuous SAVI remained a strong predictor of AVR during follow-up, with 20% of models showing an adjusted p-value between 0.05 and 0.10 and 19% of models having an adjusted p-value<0.05.
Table 1. Baseline characteristics.
| Total cohort N=52 | SAVI ≤0.70 N=25 | SAVI >0.70 N=27 | p-value | |
|---|---|---|---|---|
| Age, years | 76 (71-81) | 76 (71-81) | 76 (72-80) | 0.71 |
| Male | 36 (69) | 17 (68) | 19 (70) | 1.00 |
| BMI, kg/m2 | 29±5 | 28±5 | 30±5 | 0.26 |
| Risk factors | ||||
| Hypertension | 36 (69) | 17 (68) | 19 (70) | 1.00 |
| Dyslipidaemia | 33 (64) | 15 (60) | 18 (67) | 0.83 |
| Diabetes mellitus | 10 (19) | 5 (20) | 5 (19) | 1.00 |
| Renal insufficiency | 9 (17) | 4 (16) | 6 (22) | 0.83 |
| Medical history | ||||
| Myocardial infarction | 10 (20) | 3 (13) | 7 (26) | 0.39 |
| PCI | 18 (35) | 7 (28) | 11 (41) | 0.50 |
| CABG | 9 (17) | 1 (4) | 8 (30) | 0.038 |
| Cerebral vascular disease | 7 (14) | 3 (12) | 4 (15) | 1.00 |
| Peripheral vascular disease | 9 (17) | 4 (16) | 5 (19) | 1.00 |
| COPD | 5 (10) | 0 (0) | 5 (19) | 0.07 |
| Atrial fibrillation | 21 (40) | 9 (36) | 12 (44) | 0.59 |
| Permanent pacemaker | 4 (8) | 1 (4) | 3 (11) | 0.74 |
| Medications | ||||
| Beta blocker | 26 (50) | 8 (32) | 18 (67) | 0.026 |
| Diuretic | 21 (40) | 9 (36) | 12 (44) | 0.74 |
| Statin | 28 (54) | 11 (44) | 17 (63) | 0.29 |
| Symptoms | ||||
| Angina CCS ≥2 | 22 (42) | 12 (48) | 9 (39) | 1.00 |
| Dyspnoea NYHA ≥2 | 42 (81) | 20 (80) | 21 (84) | 0.86 |
| Hospitalisation for heart failure | 3 (6) | 2 (8) | 1 (4) | 0.6 |
| Syncope | 2 (4) | 2 (8) | 0 (0) | 0.44 |
| Laboratory values | ||||
| Haemoglobin, mmol/L | 8.4 (7.8-9.0) | 8.4 (7.8-9.0) | 8.4 (7.8-9.0) | 0.93 |
| Creatinine, µmol/L | 92 (79-102) | 87 (74-100) | 94 (82-110) | 0.18 |
| LDL cholesterol, mmol/L | 2.3 (1.9-2.9) | 2.4 (1.5-2.9) | 2.1 (1.7-2.7) | 0.75 |
| Troponin, ng/L | 15 (11-30) | 14 (9-26) | 15 (10-32) | 0.51 |
| NT-proBNP, pg/mL | 268 (113-670) | 180 (74-386) | 330 (145-981) | 0.20 |
| Functional status | ||||
| KCCQ overall score | 57±24 | 55±23 | 60±25 | 0.39 |
| 6-minute walk test, m | 309 (245-393) | 311 (227-402) | 304 (273-371.3) | 0.83 |
| Data are expressed as counts (percentages), mean±standard deviation, or median (interquartile range). BMI: body mass index; CABG: coronary artery bypass grafting; CCS: Canadian Cardiovascular Society; COPD: chronic obstructive pulmonary disease; KCCQ: Kansas City Cardiomyopathy Questionnaire; LDL: low-density lipoprotein; NT-proBNP: N-terminal pro-B-type natriuretic peptide; NYHA: New York Heart Association; PCI: percutaneous coronary intervention; SAVI: stress aortic valve index | ||||
Table 2. Comprehensive valve assessment.
| Total cohort N=52 | SAVI ≤0.70 N=25 | SAVI >0.70 N=27 | p-value | |
|---|---|---|---|---|
| SAVI invasive | 0.70 (0.65-0.79) | 0.65 (0.57-0.67) | 0.79 (0.72-0.83) | <0.001 |
| SAVI (DSE) | 0.80 (0.70-0.80) | 0.73 (0.69-0.81) | 0.83 (0.76-0.88) | 0.004 |
| SAVI (BSE) | 0.83 (0.81-0.87) | 0.81 (0.77-0.82) | 0.87 (0.85-0.90) | <0.001 |
| Invasive haemodynamics | ||||
| Mean AV gradient (rest), mmHg | 23 (17-30) | 29 (26-36) | 18 (16-23) | <0.001 |
| Mean AV gradient (stress), mmHg | 41 (29-53) | 53 (45-58) | 31 (24-37) | <0.001 |
| Resting echocardiography | ||||
| AVA (rest), cm2 | 1.2±0.3 | 1.2±0.2 | 1.3±0.3 | 0.50 |
| Mean AV gradient (rest), mmHg | 24 (20-27) | 26 (22-28) | 21 (17-25) | 0.002 |
| Max AV velocity (rest), m/s | 3.2 (3.0-3.5) | 3.4 (3.2-3.7) | 3.1 (3.0-3.3) | 0.004 |
| DVI (rest) | 0.31 (0.27-0.34) | 0.31 (0.28-0.34) | 0.32 (0.26-0.35) | 0.94 |
| Stress echocardiography* | ||||
| AVA (dobutamine), cm2 | 1.4±0.3 | 1.3±0.3 | 1.4±0.3 | 0.63 |
| AVA (ergometry), cm2 | 1.1±0.3 | 1.1±0.2 | 1.1±0.3 | 0.84 |
| Mean AV gradient (dobutamine), mmHg | 34 (28-44) | 42 (33-50) | 30 (21-36) | 0.004 |
| Mean AV gradient (ergometry), mmHg | 36 (24-44) | 44 (39-46) | 24 (22-30) | <0.001 |
| Max AV velocity (dobutamine), m/s | 4.1 (3.6-4.5) | 4.3 (4.2-4.9) | 3.8 (3.3-4.1) | 0.003 |
| Max AV velocity (ergometry), m/s | 3.9 (3.5-4.3) | 4.2 (4.0-4.5) | 3.5 (3.2-3.6) | <0.001 |
| DVI (dobutamine) | 0.39 (0.31-0.64) | 0.37 (0.26-0.90) | 0.43 (0.33-0.64) | 0.43 |
| DVI (ergometry) | 0.29 (0.24-0.34) | 0.29 (0.24-0.31) | 0.30 (0.27-0.41) | 0.28 |
| CT scan at baseline | ||||
| AV calcium score, Agatston units | 1,868 (1,161-2,405) | 1,870 (1,718-2,739) | 1,494 (915-2,375) | 0.09 |
| Abnormal AV calcium score** | 25 (48) | 14 (56) | 11 (41) | 0.76 |
| AVA, cm2 | 1.3±0.3 | 1.2±0.2 | 1.4±0.3 | 0.004 |
| Data are expressed as mean±standard deviation, median (interquartile range), or n (%). *Stress echocardiography was performed in 35 patients using dobutamine and 25 patients using bicycle ergometry. **Agatston thresholds: >2,000 units for males and >1,200 units for females. AV: aortic valve; AVA: aortic valve area; BSE: bicycle stress echo; CT: computed tomography; DSE: dobutamine stress echo; DVI: Doppler velocity index; SAVI: stress aortic valve index | ||||
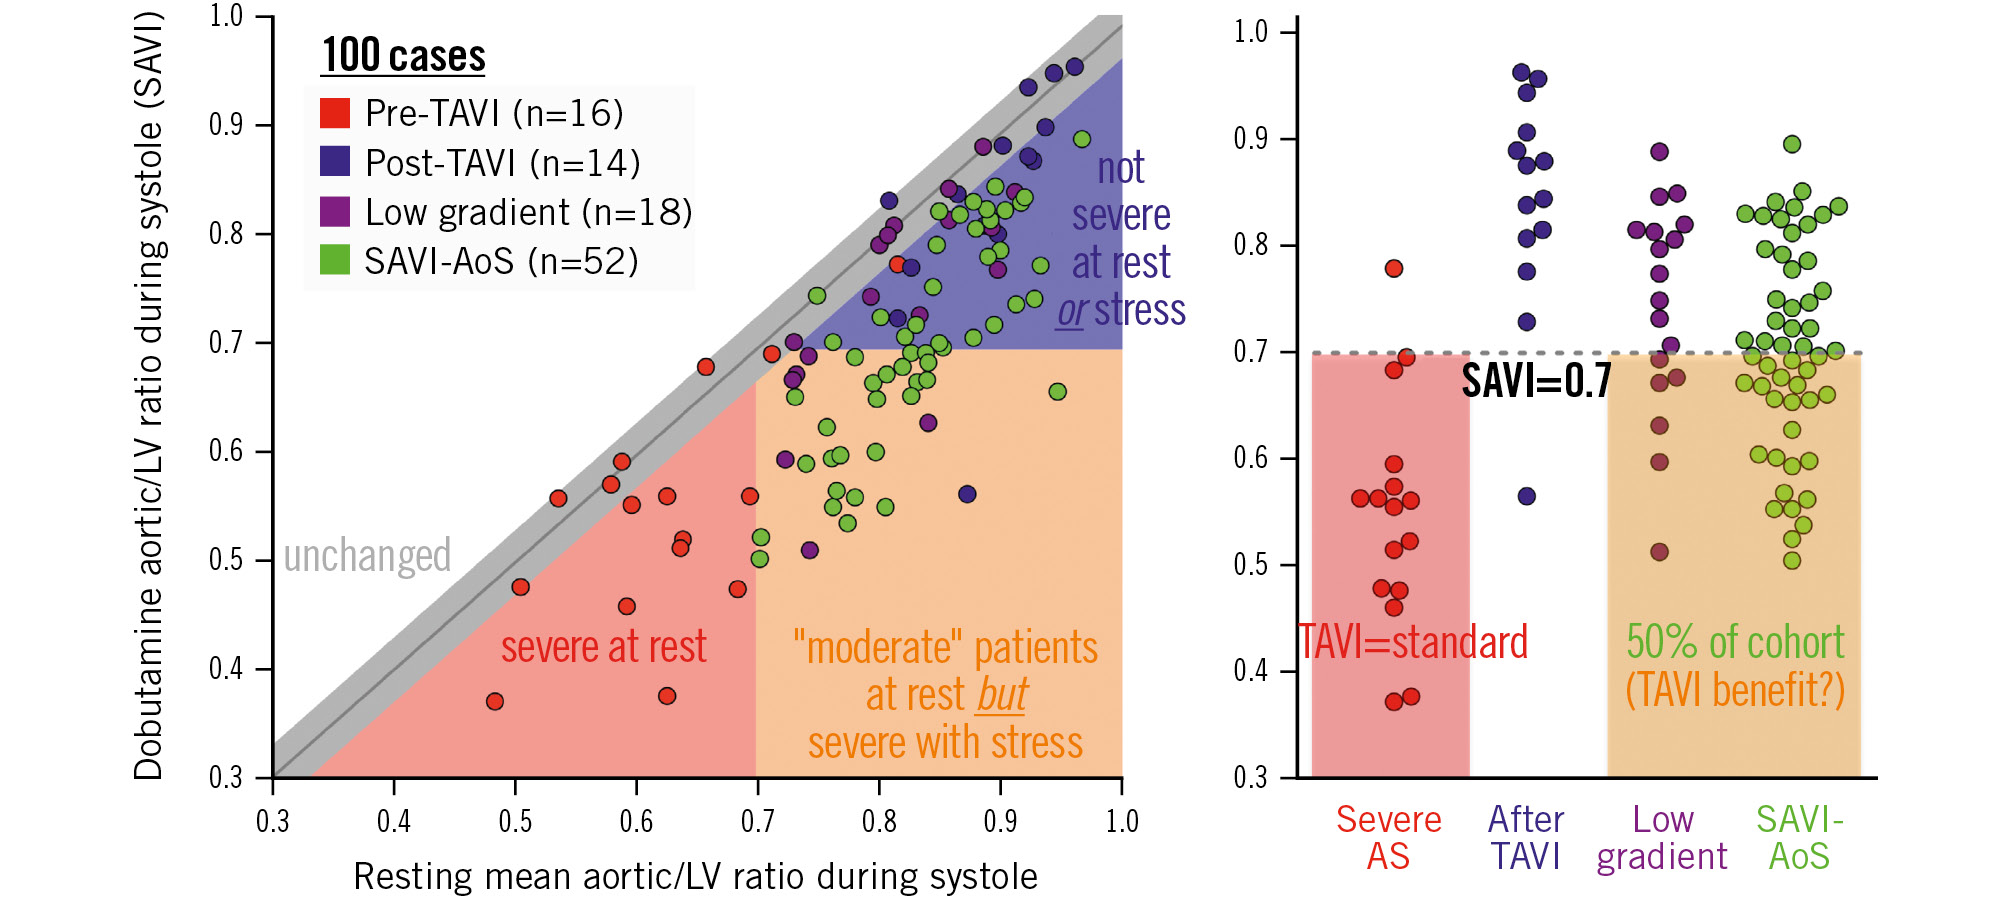
Figure 1. Baseline versus stress valve haemodynamics in SAVI-AoS compared with other cohorts. Red and blue dots are patients from Johnson et al9. Purple dots are patients from Zelis et al11. Green dots are patients from the current cohort. Before transcatheter aortic valve implantation (TAVI; red dots), all subjects except one had an aortic/left ventricular ratio during systole of 0.7 or less. After TAVI (blue dots), all patients except one had a stress aortic/left ventricular systolic pressure ratio (stress aortic valve index [SAVI]) greater than 0.7. In moderate aortic stenosis patients (green dots), 48% of the patients exhibited severe aortic stenosis physiology (comparable with red dots) during stress. The cutoff of 0.70 predicted aortic valve replacement within 1 year and over the entire follow-up (area under the curve 0.74); this cutoff is numerically the same SAVI threshold as that seen in a previous study9. AS: aortic stenosis; LV: left ventricular
Table 3. Clinical events and 1-year changes.
| SAVI ≤0.70 N=25 | SAVI >0.70 N=27 | p-value | |
|---|---|---|---|
| Clinical outcomes | |||
| AVR# | |||
| Within 1 year | 14 (56) | 3 (11) | <0.001 |
| During extended follow-up | 18 (72) | 6 (22) | <0.001 |
| Death | 4 (16) | 1 (4) | 0.10 |
| All-cause | 3 (12) | 0 (0) | 0.05 |
| Cardiac | 1 (4) | 1 (4) | 0.90 |
| Stroke | 2 (8) | 0 (0) | 0.10 |
| Heart failure admission | 0 (0) | 5 (19) | 0.04 |
| New onset atrial fibrillation | 0 (0) | 2 (7) | 0.20 |
| Permanent pacemaker | 1 (4) | 0 (0) | 0.30 |
| 1-year changes* | |||
| ∆ AVA, cm2, | 0.0±0.6 | 0.0±0.3 | 0.96 |
| ∆ Mean AV gradient, mmHg | 5±14 | 0±9 | 0.25 |
| ∆ Max AV velocity, cm/s | 47±88 | 15±65 | 0.20 |
| ∆ Calcium score, Agatston units | 304 (164 to 686) | 134 (–91 to 197) | 0.22 |
| ∆ NT-proBNP, pg/mL | 0 (–36 to 64) | –1 (–83 to 252) | 0.74 |
| ∆ 6MWT distance, m | –41 (–83 to –16) | 2 (–15 to 18) | 0.015 |
| ∆ KCCQ overall score | –16 (–38 to –3) | –1 (–14 to 8) | 0.031 |
| Data are expressed as counts (percentages), mean±standard deviation or median (interquartile range). #AVR includes surgical aortic valve replacement, transcatheter aortic valve implantation, and balloon valvuloplasty. *For subjects still alive and without intervening AVR. One-year changes were calculated as the difference between the baseline value and the value at 1 year. 6MWT: six-minute walk test; AV: aortic valve; AVA: aortic valve area; AVR: aortic valve replacement; CT: computed tomography; KCCQ: Kansas City Cardiomyopathy Questionnaire; NT-proBNP: N-terminal pro-B-type natriuretic peptide; SAVI: stress aortic valve index | |||
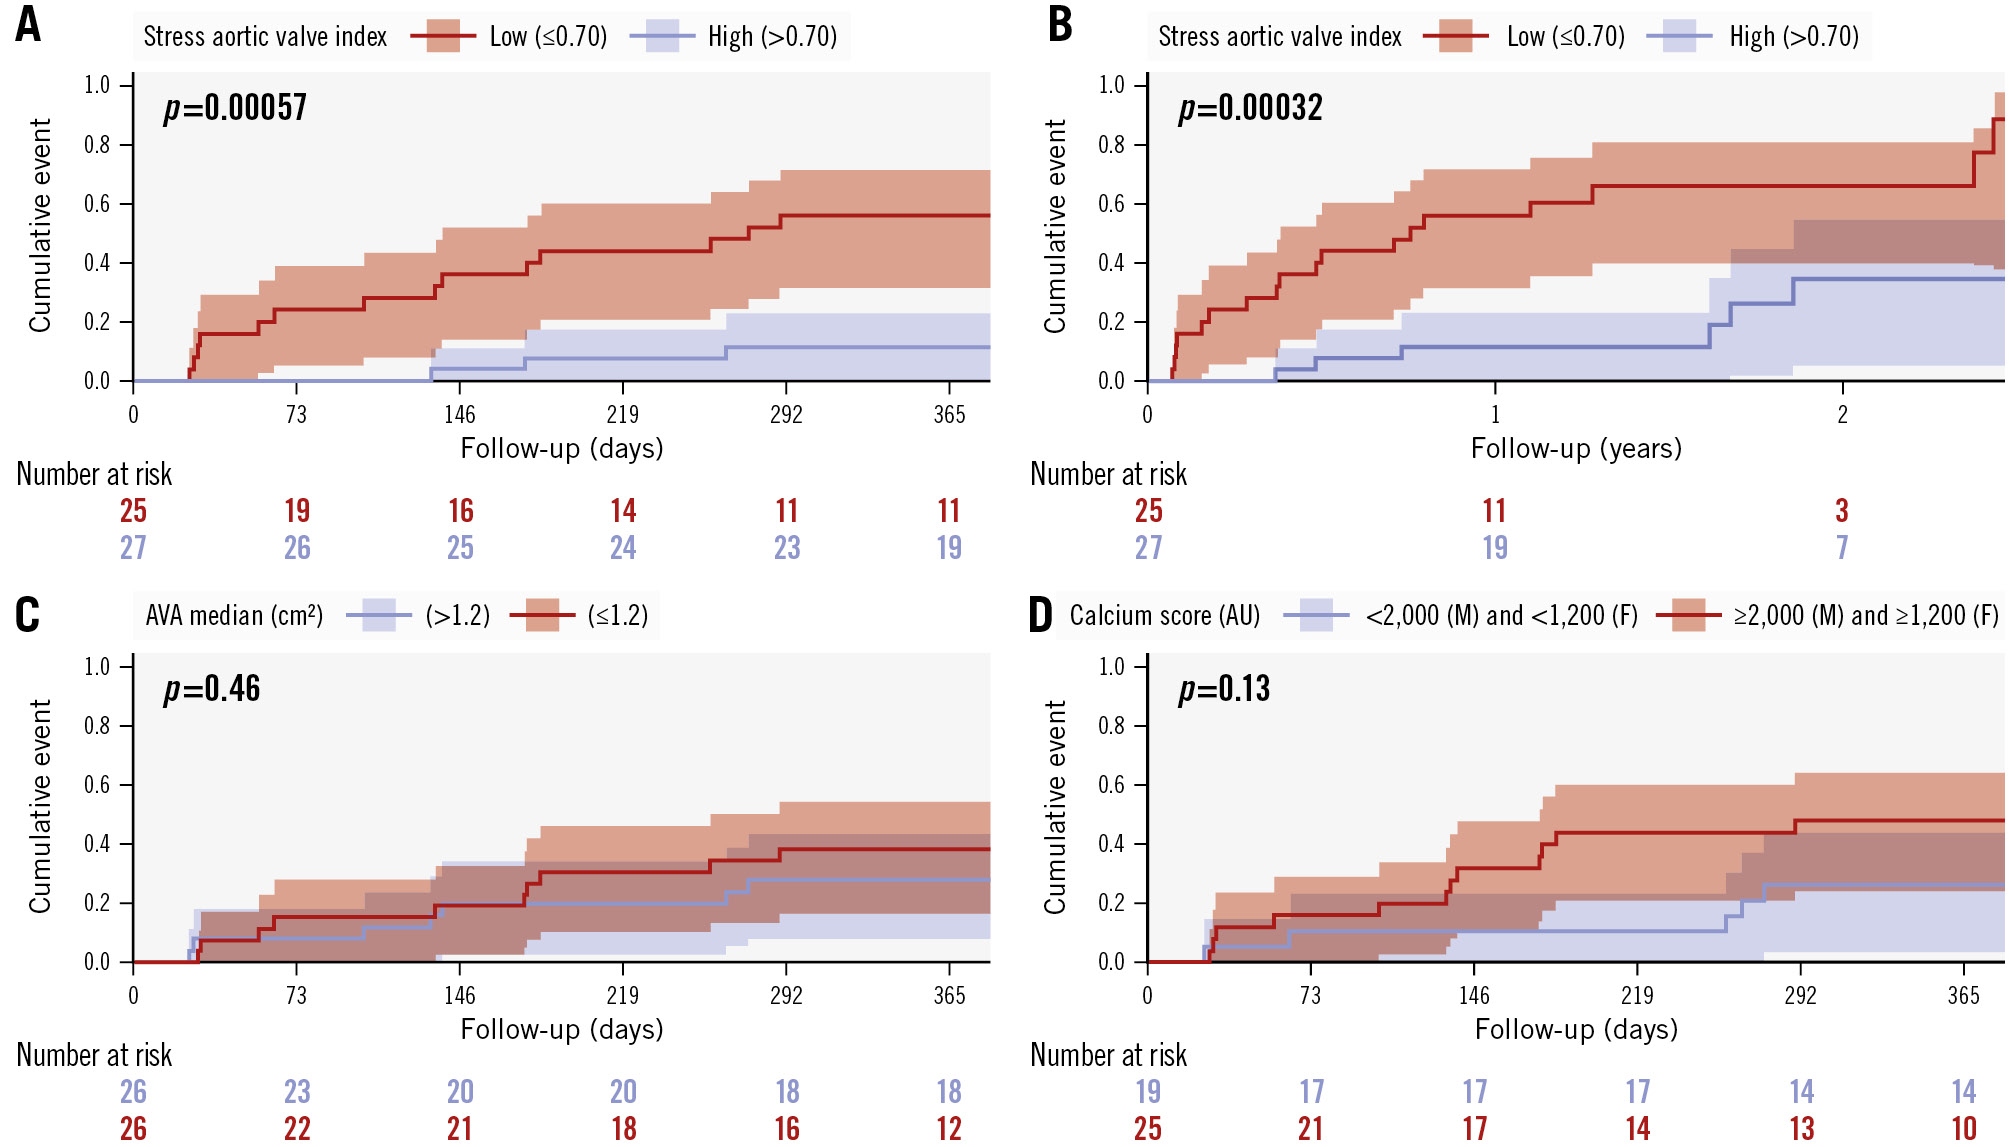
Figure 2. Kaplan-Meier curves. A) Occurrence of aortic valve replacement/intervention (AVR) within 1 year based on the stress aortic valve index (SAVI; cutoff of 0.70). B) Occurrence of AVR during extended follow-up based on the SAVI cutoff of 0.70. C) AVR within 1 year based on the median aortic valve area (AVA). D) AVR within 1 year based on the sex-based calcium score. AU: Agatston units; F: females; M: males
Discussion
Our prospective, observational cohort of patients with moderate AS presenting with unexplained symptoms provides several novel insights with potential implications for clinical management and future interventional trials. First, a substantial minority of patients (11 of 64 consented patients per Supplementary Figure 1) with this presentation harbour significant coronary artery disease, and thus, a dedicated evaluation of the epicardial vessels appears warranted before focusing on the valve alone.
Second, the haemodynamic response of the aortic valve to stress provides information largely independent of clinical features and routine metrics of valve anatomy and function at baseline. The heterogeneity among subjects supports our prior findings911 and suggests that routine “valvular stress testing” could separate otherwise similar patients into new categories appropriate for differential therapy, as discussed below.
Third, a substantial number of patients with moderate AS at baseline develop stress haemodynamics comparable with those currently classified as having severe AS. Figure 1 emphasises that – during stress – about half of our cohort would be indistinguishable from a prior cohort of severe AS patients undergoing clinical TAVI. The only distinction between these two groups is resting severity, not stress haemodynamics. Potentially, clinical outcomes arise more from the valve’s stress response and not from baseline conditions, when the body can largely compensate via adaptive systemic vasoconstriction or increased peripheral oxygen extraction.
Fourth, our proposed SAVI proved its ability to predict clinical outcomes. Because managing physicians were blinded to SAVI values − given its post hoc and centralised analysis using algorithms914 currently unavailable for clinical care − this study design allowed us to eliminate bias of the metric on subsequent treatment decisions. While limited in multivariable adjustment because of the modest sample size of our cohort, these findings support a potential role for the SAVI – independent of AVA and AV calcium burden – to guide treatment decisions regarding AVR given the notable separation in event curves seen in Figure 2. We consider the trade-offs between the SAVI and the mean valve gradient during stress in the limitations section below.
As a roadmap for future studies, consider the two patients in Figure 3 from our cohort. Both had similar clinical features, functional status, baseline echocardiography, and valvular calcium. Currently, neither patient would meet the criteria for AVR under any existing guideline. However, compare their responses to dobutamine. The female patient (on the left) developed a large gradient with a SAVI ≤0.7 during stress – a result as abnormal as that of many patients currently classified as having severe AS9. Potentially, she would benefit from initial TAVI to improve her symptoms and perhaps prognosis. Conversely, the male patient (on the right) demonstrated only a modest increase in the mean AV gradient – in this case, medical management appears appropriate since his symptoms cannot be explained by valve severity during stress conditions. Performing TAVI would expose the patient to procedural risk without clinical benefit. Understanding the mechanisms behind these diversities warrants further study, and tools like computational modelling incorporating fluid-structure interactions appear promising16.
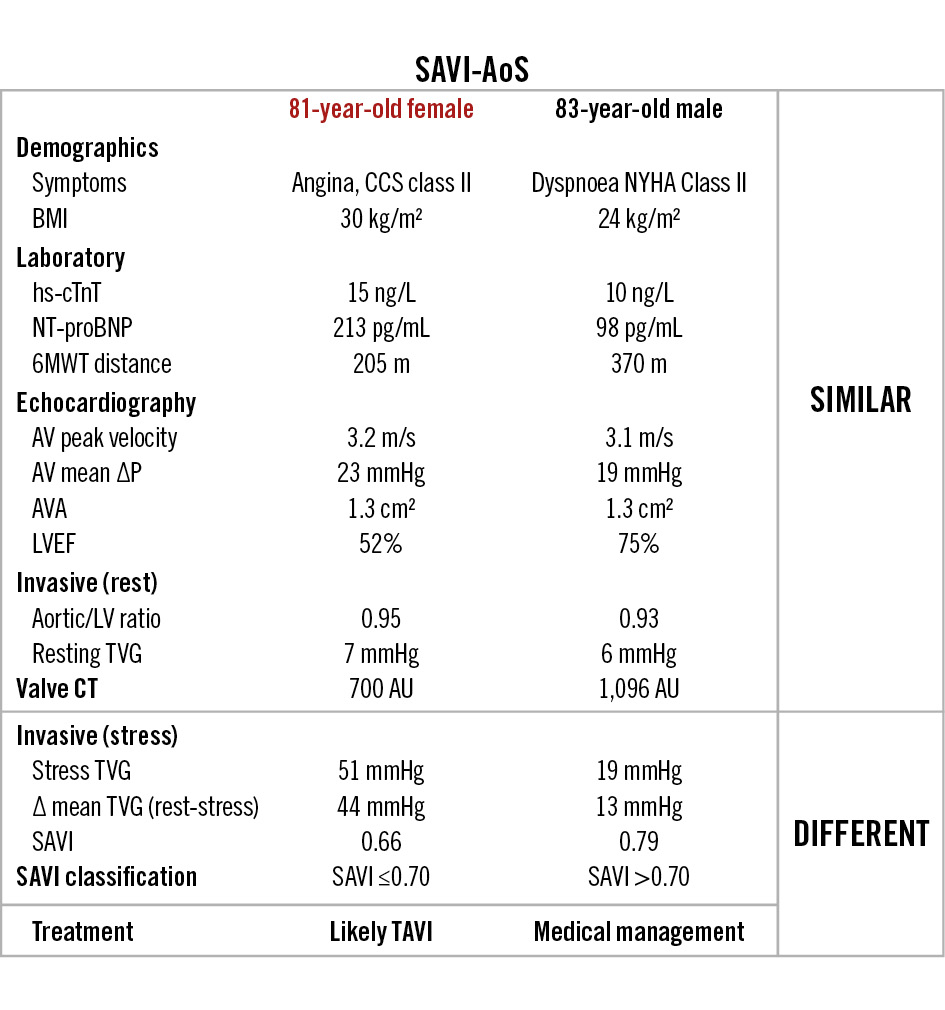
Figure 3. An example of two SAVI-AoS patients. Despite similar baseline characteristics (demographics, laboratory values, echocardiographic metrics, valvular calcium score, and invasive resting metrics), the stress assessment differed completely. While the patient on the left would likely benefit from transcatheter aortic valve implantation, the other patient (right) should simply be followed clinically. ΔP: aortic valve pressure gradient; 6MWT: six-minute walk test; AU: Agatston units; AV: aortic valve; AVA: aortic valve area; BMI: body mass index; CCS: Canadian Cardiovascular Society; CT: computed tomography; hs-cTnT: high-sensitivity cardiac troponin T; LV: left ventricular; LVEF: left ventricular ejection fraction; NT-proBNP: N-terminal pro-B-type natriuretic peptide; NYHA: New York Heart Association; SAVI: stress aortic valve index; TAVI: transcatheter aortic valve implantation; TVG: transvalvular gradient
Comparison to existing literature
Previously our group had used ROC analysis to establish a SAVI threshold by comparing paired measurements before versus after TAVI in 14 subjects9. That threshold for the SAVI of 0.71 almost exactly matches our current threshold of 0.70 derived using ROC analysis to predict AVR during clinical follow-up, as shown in Supplementary Figure 10 and Supplementary Figure 11. The concordance between these two results in different cohorts and using distinct methods supports our choice of 0.70 for the SAVI threshold in the current analyses.
The lack of a significant relationship between AV calcium and the SAVI is in line with a recent publication examining patients with low-gradient AS but an AVA <1 cm217. In that cohort, AV calcium scores demonstrated poor diagnostic performance against a reference standard of dobutamine assessment. That prior result together with our current findings suggests a limited role for AV calcium scoring in predicting the haemodynamic response of the AV to dobutamine stress. Conceptually, the exact location of the calcium (annulus vs leaflet tips) should carry a differential impact on leaflet mobility as transvalvular flow increases.
Two ongoing clinical trials are actively randomising symptomatic patients with moderate AS to TAVI versus medical therapy: PROGRESS (ClinicalTrials.gov: NCT04889872) and EXPAND TAVR II (ClinicalTrials.gov: NCT05149755). These trials include patients with moderate AS but also demand additional markers of risk, such as serum tests, AV calcium score, clinical features, and a variety of echocardiographic parameters. Neither trial demands routine stress testing like the SAVI. Supplementary Table 7 provides a comparison of our cohort with the inclusion criteria for each trial. Among subjects with an abnormal SAVI ≤0.7, just over half would be eligible for enrolment in PROGRESS and EXPAND TAVR II. Conversely, among subjects with a normal SAVI>0.7, around 45% would still be able to join these randomised trials. Thus, these trials simultaneously exclude patients with an abnormal SAVI ≤0.7 that might benefit from early TAVI and include patients with a normal SAVI>0.7 that are unlikely to derive benefit from a valve intervention. If the outcomes of these trials are indeterminant or neutral, then physiologically defined valve severity using the SAVI may potentially offer more personalised patient selection with more definitive TAVI benefit for moderate severity AS.
Limitations
We anticipated enrolling 100 subjects in this trial. Due to multiple factors, including the COVID-19 pandemic and substantial rates of concurrent, severe CAD, we included only 52 subjects. Additionally, not every subject underwent both types of stress echocardiography, and routine testing for cardiac amyloid was not performed. Therefore, our reduced power limited our ability to perform multivariable adjustment and may have produced false-negative results. However, to our knowledge, this cohort still contains the largest number of moderate AS patients ever recruited to undergo routine stress testing with clinical follow-up.
Because the SAVI and mean AV gradient during stress remain highly correlated, the choice between them relies on their clinical interpretation. As demonstrated by both an animal model of aortic banding18 and a study before/after TAVI in patients9, only the SAVI provides a “fractional flow” that quantifies the reduction in maximal flow due to the diseased aortic valve. Additionally, correlation with the relative reduction in maximal flow for the SAVI (correlation coefficient 0.831) slightly exceeds the value for the mean valve gradient during stress (coefficient –0.756)9. Consequently, the absolute valve gradient in mmHg has no physiological interpretation, unlike the SAVI that quantifies the relative reduction in flow, and therefore, the therapeutic potential from valve procedures. For example, the same 30 mmHg gradient during dobutamine might indicate a SAVI ≤0.70, making it suitable for intervention if the LV systolic ejection pressure was 90 mmHg, but might indicate a SAVI>0.70, making it reasonable for watchful waiting if the LV pressure was 120 mmHg instead. Further analysis in the supplementary data provides the Pearson correlation coefficient of the two parameters in Supplementary Table 4, their scatterplot in Supplementary Figure 14, and the ROC curves in Supplementary Figure 15 to predict AVR. The modest size of our cohort, plus the lack of right heart catheterisation before and after TAVI, limits further insights into distinctions in the current study. Notably, operators in the study were aware of the mean valve gradient during stress, unlike the SAVI, which remained blinded after central quantification.
Dobutamine stress offers practical advantages over exercise for patients undergoing cardiac catheterisation and aortic valve assessment, hence its recommendation in guidelines56. However, the two forms of stress are not identical, as seen in our comparisons of the SAVI measured in different ways. Dobutamine likely reaches levels of transvalvular flow not routinely achieved with exercise and, thus, provides a worst-case scenario for stress haemodynamics of the aortic valve.
Impact on daily practice
The stress aortic valve index strongly predicted the need for a clinical aortic valve intervention (hazard ratio 5.7; p-value=0.007) during follow-up − despite managing physicians being blinded to its value − unlike stratification by aortic valve area or sex-based valve calcium score, which did not. Evaluating the stress response of a moderately stenotic aortic valve might improve the selection of symptomatic patients for valve intervention by identifying a high-risk subgroup.
Conclusions
Routine stress assessment of moderate AS at rest unmasks a higher-risk subset who are not identified by traditional severity metrics. Patients with severe stress haemodynamics despite only moderate AS may benefit from aortic valve intervention, as suggested by this pilot study, which serves as the basis for a future randomised trial.
Funding
This research is funded by grants from ZonMW (the Netherlands; grant number 10070012010001), Biosensors Europe SA (Morges, Switzerland) and Weatherhead PET Center (UTHealth, Houston, TX, USA).
Conflict of interest statement
N.P. Johnson, D.T. Johnson, K.L. Gould, and P.A.L. Tonino have a pending patent filed by UTHealth on diagnostic methods for quantifying aortic stenosis and TAVI physiology, including the stress aortic valve index (SAVI). Additionally, N.P. Johnson, D.T. Johnson, and K.L. Gould have a pending patent filed by UTHealth on methods to correct pressure tracings from fluid-filled catheters (Fit5). As a result, UTHealth has research-related financial interests regarding these pending patents. N. Kakouros has served as a clinical proctor for Edwards Lifesciences. N.M. van Mieghem has received grant support/research contracts from Abbott, Boston Scientific, Medtronic, Edwards Lifesciences, Daiichi Sankyo, AstraZeneca, Teleflex, and PulseCath BV; and has received consulting/speaker fees from Abbott, Boston Scientific, Medtronic, Daiichi Sankyo, PulseCath BV, JenaValve, and Amgen. The other authors have no conflicts of interest to declare.
Supplementary data
To read the full content of this article, please download the PDF.