Cory:
Unlock Your AI Assistant Now!
Abstract
Background: High-risk coronary plaques (HRPs) are associated with adverse cardiovascular outcomes. However, the clinical practicality of HRP identification is challenged by their modest prevalence and low positive predictive value.
Aims: We aimed to evaluate the association between clinical risk factors and HRPs, as well as the clinical impact of HRPs across different clinical risk profiles.
Methods: This is a pooled analysis of individual patient data from the prospective observational COMBINE (OCT-FFR) and PECTUS-obs studies. A modified version of the Thrombolysis in Myocardial Infarction Risk Score for Secondary Prevention (TRS-2P) was used for risk stratification. The composite endpoint of major adverse cardiovascular events (MACE) was evaluated on a patient level, and target lesion failure (TLF), also a composite endpoint, was evaluated on a lesion level.
Results: Among 810 patients, 311, 265, and 234 were at low (TRS-2P 0-1), intermediate (TRS-2P 2), and high risk (TRS-2P ≥3), respectively. The modified TRS-2P had no discriminative value for the identification of patients with an HRP (area under the receiver operating characteristic curve 0.51, 95% confidence interval [CI]: 0.47-0.56). A consistent trend towards worse clinical outcome in the presence of an HRP was observed across different clinical risk profiles (pinteraction=0.539 for MACE and 0.337 for TLF). For TLF, the highest event rate per 100 lesion-years was observed in high-risk patients with HRPs (6.28, 95% CI: 3.52-10.36; 13.6% absolute risk at 2 years).
Conclusions: HRPs are associated with a negative clinical outcome, without apparent differences between clinical risk profiles. This highlights the independent value of optical coherence tomography for prognostication beyond clinical risk factors. The high event rates in high-risk patients with HRPs necessitate the search for additional therapeutic strategies to mitigate this risk.
Histopathological and in vivo imaging studies have significantly advanced our understanding of coronary lesions that are at increased risk of causing future cardiovascular events12. These high-risk plaques (HRPs) are typically characterised by a large lipid burden with a thin overlying fibrous cap, of which the thin-cap fibroatheroma is considered the prototype. In recent years, numerous studies have demonstrated the prognostic impact of in vivo-identified HRPs in deferred lesions on patient- and lesion-level clinical outcomes234. However, the clinical applicability of in vivo identification is challenged by various factors, especially when pursuing preventive focal treatment of HRPs5. First, the positive predictive value for future events remains limited, especially for lesion-level events2. For example, the COMBINE (OCT-FFR) and PECTUS-obs studies assessed the clinical impact of HRPs in non-flow-limiting lesions in patients with diabetes and myocardial infarction, respectively34. In an individual patient data pooled analysis from these studies, HRPs were significantly associated with patient- and lesion-level adverse outcomes in patients at risk for recurrent events. However, the positive predictive value ranged between 9.2% and 22.4% for patient-level events and between 2.1% to 13.3% for lesion-level events, depending on the number of HRP criteria included6. Second, HRPs are only found in up to one-third of patients234. Therefore, a multitude of patients need to be screened to identify those at increased risk of adverse cardiovascular outcomes. Upfront identification of patients who are likely to have HRPs could streamline the screening process, and screening patients in whom HRPs are likely to have a profound effect on clinical outcomes may provide more benefits, thereby reducing resource utilisation. We hypothesised that traditional clinical risk factors could help identify patients that are more likely to have HRPs. Second, we postulated that HRPs would have the most profound effect on clinical outcomes among patients at high clinical risk. Therefore, this study aimed to assess the association between clinical risk factors and the presence of HRPs, as well as the impact of HRPs on clinical outcomes across different clinical risk profiles.
Methods
Study design
This analysis is performed on an individual patient-level data pooled analysis of the prospective, natural history COMBINE (OCT-FFR) study (ClinicalTrials.gov: NCT02989740) and the PECTUS-obs (NCT03857971) study. Both studies aimed to assess the association between optical coherence tomography (OCT)-identified HRPs in fractional flow reserve (FFR)-negative deferred native lesions and clinical outcomes in patients with diabetes or after myocardial infarction, respectively. The design and primary results of both studies were published previously3478. In brief, OCT was performed on all native, FFR-negative (FFR>0.80), deferred, intermediate lesions, which we refer to as target lesions. Patients subsequently underwent structured clinical follow-up according to the respective study protocols. The inclusion and exclusion criteria of the respective studies are listed in Supplementary Appendix 1. The details on pooling the individual patient data and the primary combined analysis were published previously6. In total, 810 patients had at least one analysable OCT and were included in the pooled analysis, including 390 patients from COMBINE (OCT-FFR) and 420 from PECTUS-obs. Both studies were conducted in accordance with the 1964 Declaration of Helsinki and were approved by the institutional review boards and/or medical ethics committees of each participating centre. All patients provided written informed consent.
Clinical risk stratification
The Thrombolysis in Myocardial Infarction Risk Score for Secondary Prevention (TRS-2P) was used to classify patients by their risk of cardiovascular disease9. The original score assigns one point to each variable included: congestive heart failure, hypertension, age ≥75 years, diabetes mellitus, prior stroke, prior coronary artery bypass grafting, other vascular disease (peripheral), renal dysfunction (defined as an estimated glomerular filtration rate <60 mL/min/1.73 m2), and current smoking status. For the present analysis, the score was modified to account for missing baseline variables (i.e., data on “congestive heart failure” and “other vascular disease [peripheral]” were unavailable). Consequently, the modified score ranged from 0 to 7, with higher values indicating higher risk. The glomerular filtration rate was estimated using the 2021 Chronic Kidney Disease Epidemiology Collaboration (CKD-EPI) creatinine formula10. Missing values required for calculation of the modified TRS-2P were imputed using the most prevalent value or the mean across the population for categorical and continuous variables, respectively. Specifically, hypertension was considered absent in 2 patients, and 12 patients were considered non-smokers. Creatinine was imputed as 1.00 mg/dL in 67 patients. Data on all seven TRS-2P criteria were available for 733 patients. Patients were categorised according to the original cutoff values into low (0 or 1 indicator), intermediate (2 indicators), or high risk (≥3 indicators).
OCT image analysis
OCT image analysis was performed in accordance with the latest consensus document11. OCT analyses were performed by the same independent OCT core laboratory using CAAS Intravascular 2.0 (Pie Medical Imaging). Members of the core laboratory were blinded to clinical outcomes. To identify the target lesion on OCT, manual coregistration with the angiogram was performed based on anatomical landmarks (e.g., side branches). Pullbacks with insufficient image quality for qualitative and quantitative analyses of the target lesion were excluded at the discretion of the core laboratory. The predefined HRP criteria from PECTUS-obs were adopted in accordance with the primary combined analysis of COMBINE (OCT-FFR) and PECTUS-obs6. An HRP was defined by the presence of at least 2 of the 3 following criteria: (1) a lipid arc ≥90o, (2) a minimum fibrous cap thickness <65 μm, and (3) the presence of either plaque rupture or thrombus. Patients, operators, and treating physicians were blinded to the OCT image analysis results.
Clinical endpoints
Two composite endpoints were evaluated in the present analysis. Major adverse cardiovascular events (MACE) was defined as the composite of all-cause mortality, non-fatal myocardial infarction that was attributable to a specific coronary segment and that was not related to stent failure, or unplanned revascularisation not related to stent failure. Target lesion failure (TLF) was defined as the composite of cardiac death, target vessel myocardial infarction or target lesion revascularisation, for which target vessel myocardial infarction and target lesion revascularisation were only considered if clearly attributable to the target vessel or lesion, respectively. The definitions of the individual endpoints are summarised in Supplementary Appendix 2. All potential events were adjudicated by two blinded, independent clinical endpoint committees, using medical records and by comparing baseline and follow-up angiograms. Each committee consisted of at least two experienced interventional cardiologists.
Statistical analysis
Categorical variables are presented as absolute frequencies (percentages), while continuous variables are presented as mean±standard deviation or median (interquartile range [IQR]), as appropriate. The association between clinical risk factors and the presence of an HRP at the patient level was evaluated using binary logistic regression. All variables with a p-value<0.10 in univariable analyses were simultaneously included in the multivariable model. In cases of high collinearity (defined as r>0.80), the variable with the highest level of significance was included. Analyses were performed using the study of origin as a fixed parameter to account for differences in inclusion and exclusion criteria from COMBINE (OCT-FFR) and PECTUS-obs that may have influenced the TRS-2P score (e.g., diabetes mellitus). For comparative analyses of the three risk profile groups, the chi-squared test or Fisher’s exact test was used for the analyses of categorical data. Bonferroni correction was applied during subsequent evaluation of differences between two risk groups. Normally distributed continuous data were analysed using one-way analysis of variance (ANOVA) with Tukey’s post hoc test or one-way ANOVA with Welch’s statistic and Games-Howell post hoc tests. Non-normally distributed data were analysed using the Kruskal-Wallis test. The discriminatory value of the modified TRS-2P for the identification of HRPs was evaluated using the area under the receiver operating characteristic curve (AUC). For the analyses of the composite clinical endpoints, patients were censored at their last moment of follow-up. For MACE, the hazard ratio (HR) associated with the presence of at least one HRP was evaluated using Cox proportional hazards models. For TLF, robust standard errors were estimated to account for within-patient clustering, given patients could have had multiple lesions. Differences in the prognostic impact of HRPs across different clinical risk profiles were evaluated using interaction terms. The study of origin was included as a fixed parameter in both patient- and lesion-level analyses. Data were imputed only for variables included in the modified TRS-2P score. Sensitivity analyses were performed including only patients in whom information on all seven TRS-2P criteria was available without imputation. A 2-sided p-value<0.05 was considered statistically significant. Data were analysed using SPSS Statistics software, version 27.0 (IBM), and R version 4.4.1 (R Foundation for Statistical Computing).
Results
Study flow
Patient enrolment took place from March 2015 to December 2018 in COMBINE (OCT-FFR) and from December 2018 to September 2020 in PECTUS-obs (Figure 1). The study is reported in accordance with the STrengthening the Reporting of OBservational studies in Epidemiology (STROBE) guidelines (www.strobe-statement.org). 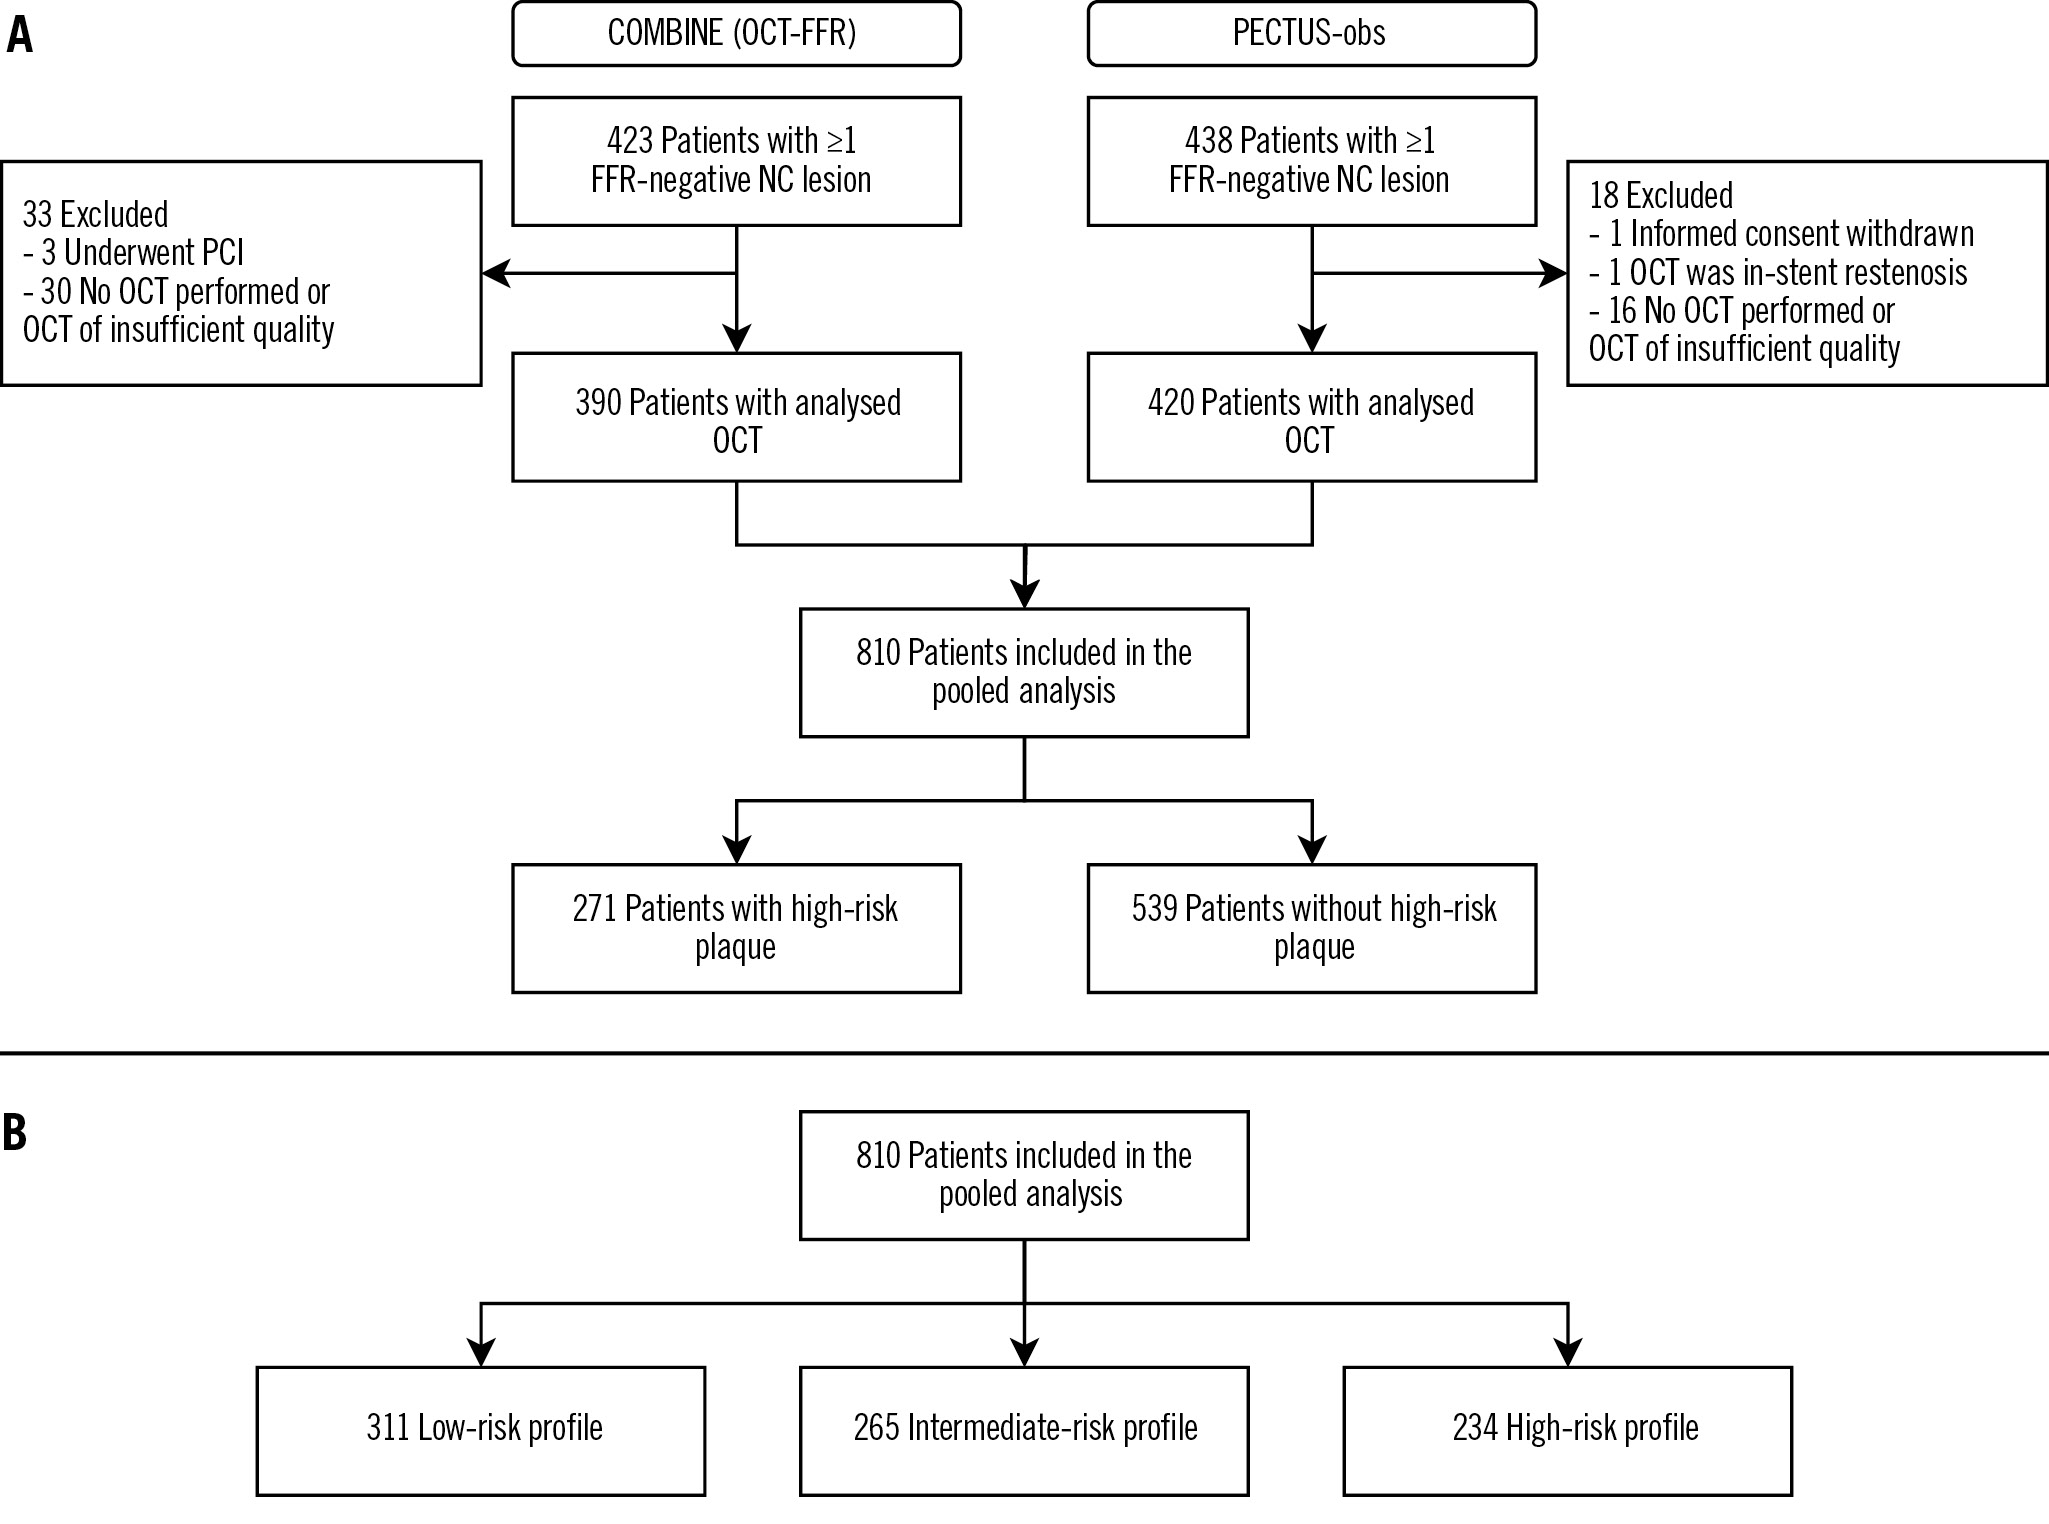
Figure 1. Study flowchart. Study flowchart for the presence of a high-risk plaque (A) and for the classification of patients into clinical risk profiles (B). FFR: fractional flow reserve; NC: non-culprit; OCT: optical coherence tomography; PCI: percutaneous coronary intervention
Association between baseline characteristics and high-risk plaques
At least one HRP was identified in 271 patients, while 539 patients had solely non-HRPs (Figure 1A). Univariable analyses exploring the relationship for each clinical characteristic separately identified 3 clinical characteristics (age ≥75, statin use at baseline, and baseline low-density lipoprotein cholesterol levels) and 5 procedural characteristics (percutaneous coronary intervention at index, number of target lesions, target lesion in the left anterior descending artery or right coronary artery, and target lesion FFR) as potential predictors for the presence of an HRP (Table 1). In multivariable analysis, percutaneous coronary intervention at the index procedure (p=0.003), number of target lesions (p=0.001), and a target lesion in the right coronary artery (p=0.005) were independently associated with the presence of at least one HRP. Statin therapy at baseline (p=0.036) and target lesion FFR (p=0.007) were also significantly associated with HRP in a sensitivity analysis following imputation of low-density lipoprotein cholesterol levels, which was performed to account for missing laboratory values (Supplementary Table 1). Results were overall consistent when analysing only those 733 patients in whom information on all seven TRS-2P criteria was available (Supplementary Table 2).
Table 1. Association between baseline variables and high-risk plaques.
| Variables | N=810 | High-risk plaque n=271 | No high-risk plaque n=539 | Univariablea | Multivariable | ||
|---|---|---|---|---|---|---|---|
| OR (95% CI) | p-value | OR (95% CI) | p-value | ||||
| Age, years | 65±11 | 66±10 | 0.59 (0.23-1.48)b | 0.258b | |||
| ≥75 years | 63 (23.2) | 98 (18.2) | 1.38 (0.96-1.98) | 0.078 | 1.41 (0.86-2.32) | 0.175 | |
| Male sex | 194 (71.6) | 391 (72.5) | 0.94 (0.67-1.31) | 0.712 | |||
| BMI, kg/m2 | n=780 | 28.9±4.9 | 28.6±4.8 | 1.02 (0.99-1.05) | 0.324 | ||
| Current smoker | 70 (25.8) | 128 (23.7) | 1.11 (0.79-1.56) | 0.541 | |||
| Diabetes | 146 (53.9) | 304 (56.4) | 0.81 (0.45-1.45) | 0.480 | |||
| Hypertension | 166 (61.3) | 347 (64.4) | 0.88 (0.65-1.20) | 0.420 | |||
| Hypercholesterolaemia | n=808 | 126 (46.8) | 259 (48.1) | 0.96 (0.71-1.30) | 0.806 | ||
| Family history of premature CVD | n=796 | 96 (36.4) | 172 (32.3) | 1.20 (0.88-1.64) | 0.248 | ||
| Previous MI | 65 (24.0) | 126 (23.4) | 1.05 (0.74-1.49) | 0.782 | |||
| Previous PCI | 69 (25.5) | 137 (25.4) | 1.02 (0.72-1.44) | 0.911 | |||
| Previous CABG | 6 (2.2) | 6 (1.1) | 2.10 (0.66-6.64) | 0.207 | |||
| Previous CVA | 15 (5.5) | 25 (4.6) | 1.23 (0.63-2.40) | 0.537 | |||
| MI at presentation | 162 (59.8) | 320 (59.4) | 0.89 (0.49-1.60) | 0.691 | |||
| STEMI | 83 (51.2) | 147 (45.9) | Reference | ||||
| NSTEMI | 79 (48.8) | 173 (54.1) | 0.82 (0.56-1.21) | 0.312 | |||
| Statin at presentation | 121 (44.6) | 291 (54.0) | 0.61 (0.43-0.87) | 0.006 | 0.81 (0.50-1.30) | 0.379 | |
| Laboratory assessment | |||||||
| eGFR, mL/min/1.73 m2 | 80.5±19.8 | 81.1±19.1 | 1.00 (0.99-1.01) | 0.603 | |||
| eGFR <60 mL/min/1.73 m2 | 46 (17.0) | 84 (15.6) | 1.12 (0.75-1.67) | 0.572 | |||
| C-reactive protein, mg/L | n=483 | 3.00 (1.10-6.00) | 2.90 (1.00-5.60) | 1.00 (0.99-1.01) | 0.667 | ||
| Total cholesterol, mmol/L | n=629 | 4.78±1.28 | 4.60±1.31 | 1.11 (0.98-1.27) | 0.105 | ||
| LDL cholesterol, mmol/L | n=502 | 3.02±1.21 | 2.71±1.19 | 1.27 (1.08-1.49) | 0.003 | 1.18 (0.99-1.40) | 0.070 |
| HDL cholesterol, mmol/L | n=506 | 1.10 (0.94-1.38) | 1.10 (0.92-1.35) | 1.20 (0.85-1.69) | 0.292 | ||
| Triglycerides, mmol/L | n=521 | 1.63 (1.14-2.20) | 1.67 (1.12-2.46) | 1.00 (0.88-1.13) | 0.991 | ||
| Glycated haemoglobin, % | n=183 | 7.46±1.05 | 7.56±1.36 | 0.94 (0.73-1.21) | 0.630 | ||
| PCI at indexc | 196 (72.3) | 346 (64.2) | 1.78 (1.18-2.68) | 0.006 | 2.57 (1.37-4.79) | 0.003 | |
| Number of target lesions | 1.28±0.51 | 1.13±0.37 | 2.15 (1.54-3.00) | <0.001 | 2.14 (1.35-3.38) | 0.001 | |
| Target lesion distribution | |||||||
| LM | 2 (0.7) | 10 (1.9) | 0.39 (0.09-1.81) | 0.231 | |||
| LAD | 114 (42.1) | 275 (51.0) | 0.69 (0.52-0.93) | 0.015 | 0.85 (0.54-1.35) | 0.491 | |
| LCx | 94 (34.7) | 194 (36.0) | 0.94 (0.69-1.28) | 0.688 | |||
| RCA | 112 (41.3) | 137 (25.4) | 2.07 (1.51-2.82) | <0.001 | 1.94 (1.22-3.08) | 0.005 | |
| Target lesion FFR | 0.88±0.05 | 0.89±0.05 | 0.97 (0.94-1.00)d | 0.069 | 0.97(0.93-1.01)d | 0.175 | |
| Data are given as mean±standard deviation, n (%) or median (IQR), unless otherwise indicated. aAdjusted for the original study of inclusion. bLogarithmic transformation was applied to ensure linearity. cThe index procedure refers to the invasive coronary angiography before inclusion in the study. In patients with myocardial infarction, this refers to the initial invasive coronary angiography, irrespective of whether patients were included during this procedure or during a staged procedure. dPer 0.01 increase. BMI: body mass index; CABG: coronary artery bypass grafting; CI: confidence interval; CVA: cerebrovascular accident; CVD: cardiovascular disease; eGFR: estimated glomerular filtration rate; FFR: fractional flow reserve; HDL: high-density lipoprotein; LAD: left anterior descending artery; LCx: left circumflex artery; LDL: low-density lipoprotein; LM: left main coronary artery; MI: myocardial infarction; NSTEMI: non-ST-segment elevation myocardial infarction; OR: odds ratio; PCI: percutaneous coronary intervention; RCA: right coronary artery; STEMI: ST-segment elevation myocardial infarction | |||||||
TRS-2P and high-risk plaques
According to the modified TRS-2P, 311 patients were classified as low risk, 265 as intermediate risk, and 234 as high risk (Figure 1B). Baseline characteristics according to clinical risk profile are presented in Table 2. Patients at low risk presented significantly more often with a myocardial infarction (p<0.001) and more frequently underwent percutaneous coronary intervention of non-target lesions at baseline (p<0.001). No differences were observed in the number or distribution of target lesions. Prescription rates of secondary prevention medication at discharge and during follow-up were higher among patients with a low clinical risk profile (Table 3). Among patients with a low-, intermediate-, and high-risk profile, the patient-level prevalence of at least one HRP was 32.8%, 32.1%, and 35.9%, respectively (p=0.633). The modified TRS-2P had no discriminative value for the identification of HRPs (AUC 0.51, 95% confidence interval [CI]: 0.47-0.56; p=0.584) (Central illustration). Among the 733 with information available for all seven TRS-2P criteria, the AUC was 0.51 (95% CI: 0.46-0.55; p=0.751).
Table 2. Baseline characteristics according to clinical risk profile.
| Variables | N=810 | Low risk n=311 | Intermediate risk n=265 | High risk n=234 | p-value |
|---|---|---|---|---|---|
| Age, years | 62±9 | 65±10 | 71±10 | <0.001a,b,c | |
| ≥75 years | 13 (4.2) | 37 (14.0) | 111 (47.4) | <0.001a,b,c | |
| Male sex | 54 (17.4) | 80 (30.2) | 91 (38.9) | <0.001a,b | |
| BMI, kg/m2 | n=780 | 27.4±4.2 | 29.5±5.2 | 29.5±4.7 | <0.001a,b |
| Current smoker | 52 (16.7) | 68 (25.7) | 78 (33.3) | <0.001a,b | |
| Diabetes | 46 (14.8) | 187 (70.6) | 217 (92.7) | <0.001a,b,c | |
| Hypertension | 90 (28.9) | 207 (78.1) | 216 (92.3) | <0.001a,b,c | |
| Hypercholesterolaemia | n=808 | 90 (28.9) | 143 (54.2) | 152 (65.2) | <0.001a,b,c |
| Family history of premature CVD | n=796 | 100 (32.3) | 94 (36.2) | 74 (32.7) | 0.582 |
| Previous MI | 40 (12.9) | 69 (26.0) | 82 (35.0) | <0.001a,b | |
| Previous PCI | 41 (13.2) | 78 (29.4) | 41 (13.2) | <0.001a,b | |
| Previous CABG | 0 (0) | 2 (0.8) | 10 (4.3) | <0.001b,c | |
| Previous CVA | 1 (0.3) | 4 (1.5) | 35 (15.0) | <0.001b,c | |
| MI at presentation | 277 (89.1) | 120 (45.3) | 85 (36.3) | <0.001a,b | |
| STEMI | 154 (55.6) | 53 (44.2) | 23 (27.1) | <0.001b,c | |
| NSTEMI | 123 (44.4) | 67 (55.8) | 62 (72.9) | ||
| Statin at presentation | 80 (25.7) | 157 (59.2) | 175 (74.8) | <0.001a,b,c | |
| Laboratory assessment | |||||
| eGFR, mL/min/1.73 m2 | 89.1±13.6 | 82.4±17.1 | 68.3±21.7 | <0.001a,b,c | |
| eGFR <60 mL/min/1.73 m² | 2 (0.6) | 25 (9.4) | 103 (44.0) | <0.001a,b,c | |
| C-reactive protein, mg/L | n=483 | 2.30 (1.00-4.50) | 3.00 (1.30-5.90) | 4.80 (1.43-8.00) | <0.001b,c |
| Total cholesterol, mmol/L | n=629 | 5.00±1.31 | 4.59±1.34 | 4.26±1.11 | <0.001a,b,c |
| LDL cholesterol, mmol/L | n=502 | 3.08±1.17 | 2.72±1.19 | 2.46±1.17 | <0.001a,b |
| HDL cholesterol, mmol/L | n=506 | 1.14 (1.00-1.40) | 1.10 (0.90-1.36) | 1.05 (0.90-1.30) | 0.008b |
| Triglycerides, mmol/L | n=521 | 1.52 (1.01-2.10) | 1.70 (1.22-2.56) | 1.90 (1.25-2.79) | 0.002a,b |
| Glycated haemoglobin, % | n=183 | 7.62±1.60 | 7.56±1.15 | 7.48±1.27 | 0.865 |
| PCI at indexd | 275 (88.4) | 157 (59.2) | 110 (47.0) | <0.001a,b,c | |
| Number of target lesions | 1.17±0.42 | 1.18±0.40 | 1.20±0.47 | 0.774 | |
| Target lesion distribution | |||||
| LM | 1 (0.3) | 5 (1.9) | 6 (2.6) | 0.080 | |
| LAD | 154 (49.5) | 130 (49.1) | 105 (44.9) | 0.516 | |
| LCx | 120 (38.6) | 92 (34.7) | 76 (32.5) | 0.318 | |
| RCA | 106 (34.1) | 72 (27.2) | 71 (30.3) | 0.198 | |
| Target lesion FFR | 0.89±0.05 | 0.88±0.05 | 0.89±0.05 | 0.007a | |
| Data are given as mean±standard deviation, n (%) or median (IQR), unless otherwise indicated. aSignificant difference between low risk and intermediate risk. bSignificant difference between low risk and high risk. cSignificant difference between intermediate risk and high risk. dThe index procedure refers to the invasive coronary angiography before inclusion in the study. In patients with myocardial infarction, this refers to the initial invasive coronary angiography, irrespective of whether patients were included during this procedure or during a staged procedure. BMI: body mass index; CABG: coronary artery bypass grafting; CVA: cerebrovascular accident; CVD: cardiovascular disease; eGFR: estimated glomerular filtration rate; FFR: fractional flow reserve; HDL: high-density lipoprotein; LAD: left anterior descending artery; LCx: left circumflex artery; LDL: low-density lipoprotein; LM: left main coronary artery; MI: myocardial infarction; NSTEMI: non-ST-segment elevation myocardial infarction; PCI: percutaneous coronary intervention; RCA: right coronary artery; STEMI: ST-segment elevation myocardial infarction | |||||
Table 3. Medical therapy during follow-up.
| Variables | Low risk n=311 | Intermediate risk n=265 | High risk n=234 | p-value |
|---|---|---|---|---|
| Medication at discharge (n=810) | ||||
| Statin | 301 (96.8) | 233 (87.9) | 201 (85.9) | <0.001a,b |
| Acetylsalicylic acid | 297 (95.5) | 238 (89.8) | 212 (90.6) | 0.022a |
| P2Y12 inhibitor | 286 (92.0) | 183 (69.1) | 142 (60.7) | <0.001a,b |
| Dual antiplatelet therapy | 280 (90.0) | 173 (65.3) | 138 (59.0) | <0.001a,b |
| Anticoagulation | 26 (8.4) | 34 (12.8) | 45 (19.2) | <0.001b |
| Beta blocker | 265 (85.2) | 213 (80.4) | 187 (79.9) | 0.188 |
| ACE inhibitor | 241 (77.5) | 163 (61.5) | 134 (57.3) | <0.001a,b |
| Last-known medication after discharge (n=777) | ||||
| Statin | 254 (83.8) | 199 (78.0) | 164 (74.9) | 0.036b |
| Acetylsalicylic acid | 267 (88.1) | 190 (74.5) | 139 (63.5) | <0.001a,b,c |
| P2Y12 inhibitor | 33 (10.9) | 28 (11.0) | 36 (16.4) | 0.113 |
| Dual antiplatelet therapy | 25 (8.3) | 16 (6.3) | 18 (8.2) | 0.625 |
| Anticoagulation | 25 (8.3) | 49 (19.2) | 46 (21.0) | <0.001a,b |
| Beta blocker | 174 (57.4) | 173 (67.8) | 149 (68.0) | 0.012a,b |
| ACE inhibitor | 210 (69.3) | 140 (54.9) | 112 (51.1) | <0.001a,b |
| Data are given as n (%). aSignificant difference between low risk and intermediate risk. bSignificant difference between low risk and high risk. cSignificant difference between intermediate risk and high risk. ACE: angiotensin-converting enzyme | ||||
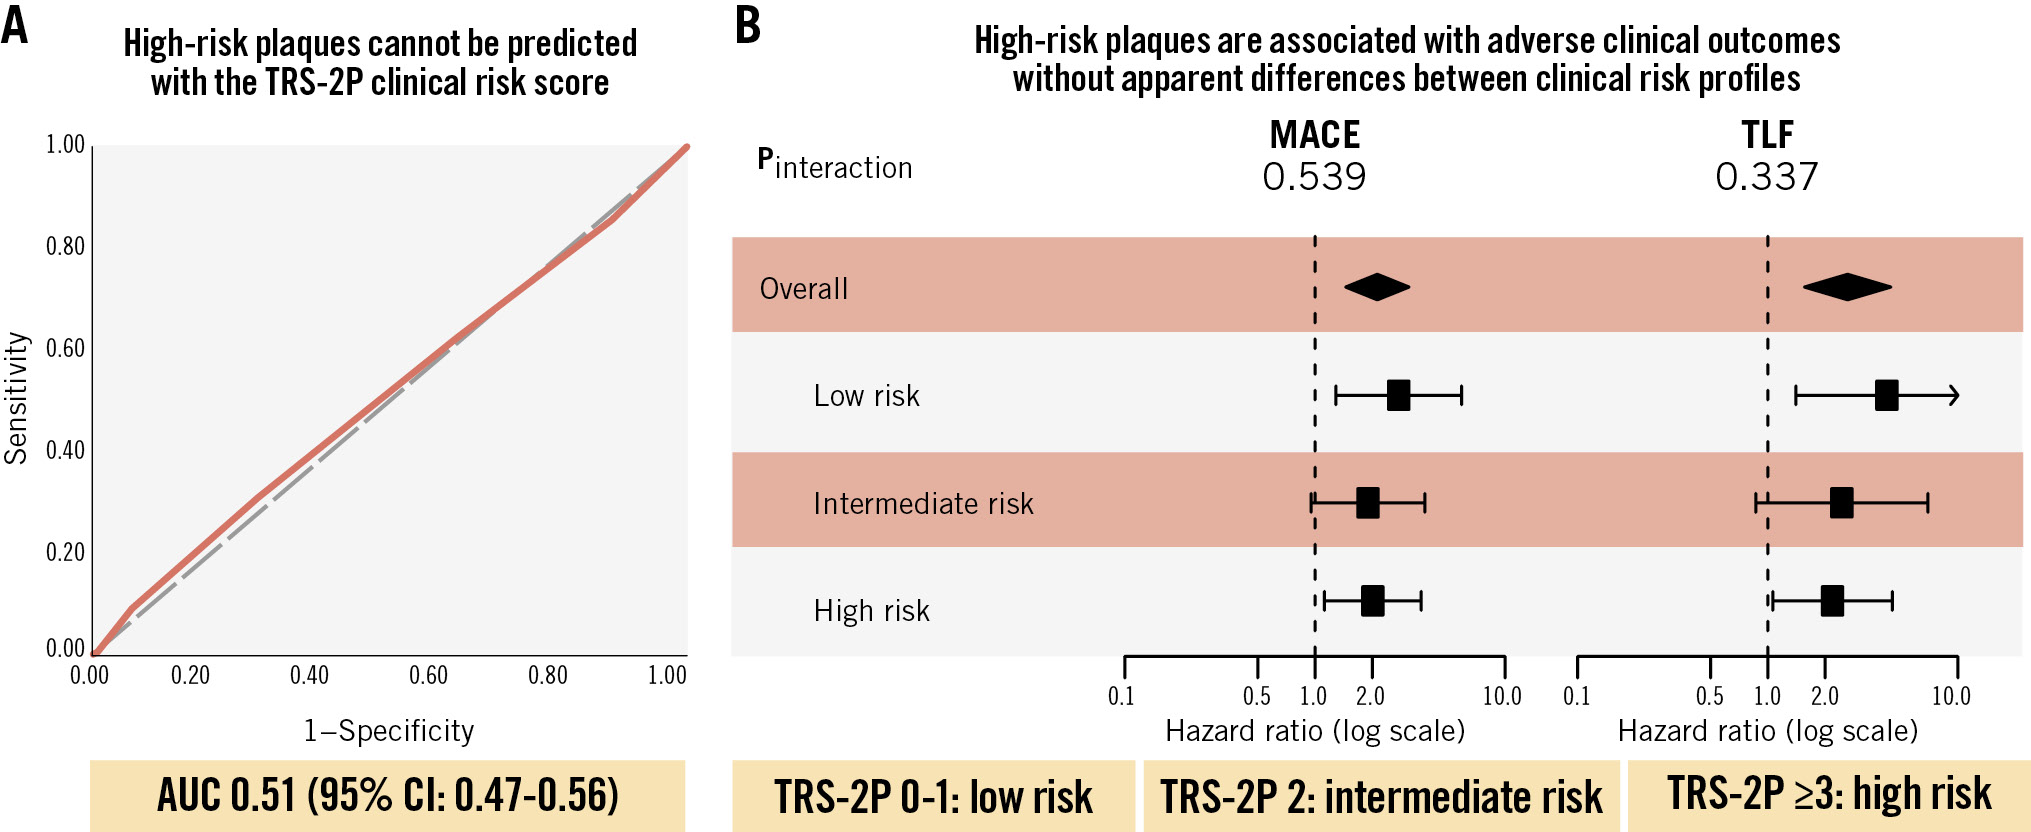
Central illustration. The association between clinical risk factors and the presence and prognostic implications of high-risk plaques. A) AUC curve of the discriminatory value of the number of TRS-2P criteria for the prediction of at least one high-risk plaque. B) Forest plot of the risk associated with the presence of at least one high-risk plaque according to clinical risk profile. AUC: area under the receiver operating characteristic curve; CI: confidence interval; MACE: major adverse cardiovascular events; TLF: target lesion failure; TRS-2P: Thrombolysis in Myocardial Infarction Risk Score for Secondary Prevention
High-risk plaques and clinical outcomes across different risk profiles
The median time of follow-up was 761 (IQR 731-1,175) days. Per 100 person-years, patient-level MACE rates were 4.19 (95% CI: 2.76-6.09), 4.69 (95% CI: 3.23-6.59), and 6.98 (95% CI: 5.09-9.34) in patients with a low-, intermediate-, and high-risk clinical profile, respectively (plow vs intermediate=0.486 and plow vs high=0.033). At the lesion level, TLF rates per 100 lesion-years were 1.85 (95% CI: 1.01-3.10), 1.77 (95% CI: 0.99-2.91), and 3.95 (95% CI: 2.69-5.61), respectively (plow vs intermediate=0.981 and plow vs high=0.059). Event rates at 2-year follow-up are reported in Figure 2, given that follow-up was complete for almost all patients at this timepoint. Over the complete available follow-up, HRPs were associated with increased risks of MACE (HR 2.13, 95% CI: 1.45-3.12) and TLF (HR 2.63, 95% CI: 1.56-4.44). No interaction was observed for the association between HRPs and adverse clinical outcomes across the clinical risk profiles (pinteraction=0.539 for MACE; pinteraction=0.337 for TLF) (Central illustration, Figure 3). The event rates at 2-year follow-up in the subgroups according to the presence of HRPs are reported in Figure 2. Various sensitivity analyses showed consistent results, including the following: evaluation of the proportion of patients in whom information on all seven TRS-2P criteria was available (Supplementary Figure 1), analyses correcting for differences in medical therapy at discharge (Supplementary Figure 2), analyses for the composite of target vessel myocardial infarction and target lesion revascularisation − performed to account for the fact that none of the cardiac deaths were clearly attributable to a target lesion-related event (Supplementary Figure 3) − and analyses using different risk scores (Supplementary Figure 4, Supplementary Figure 5).
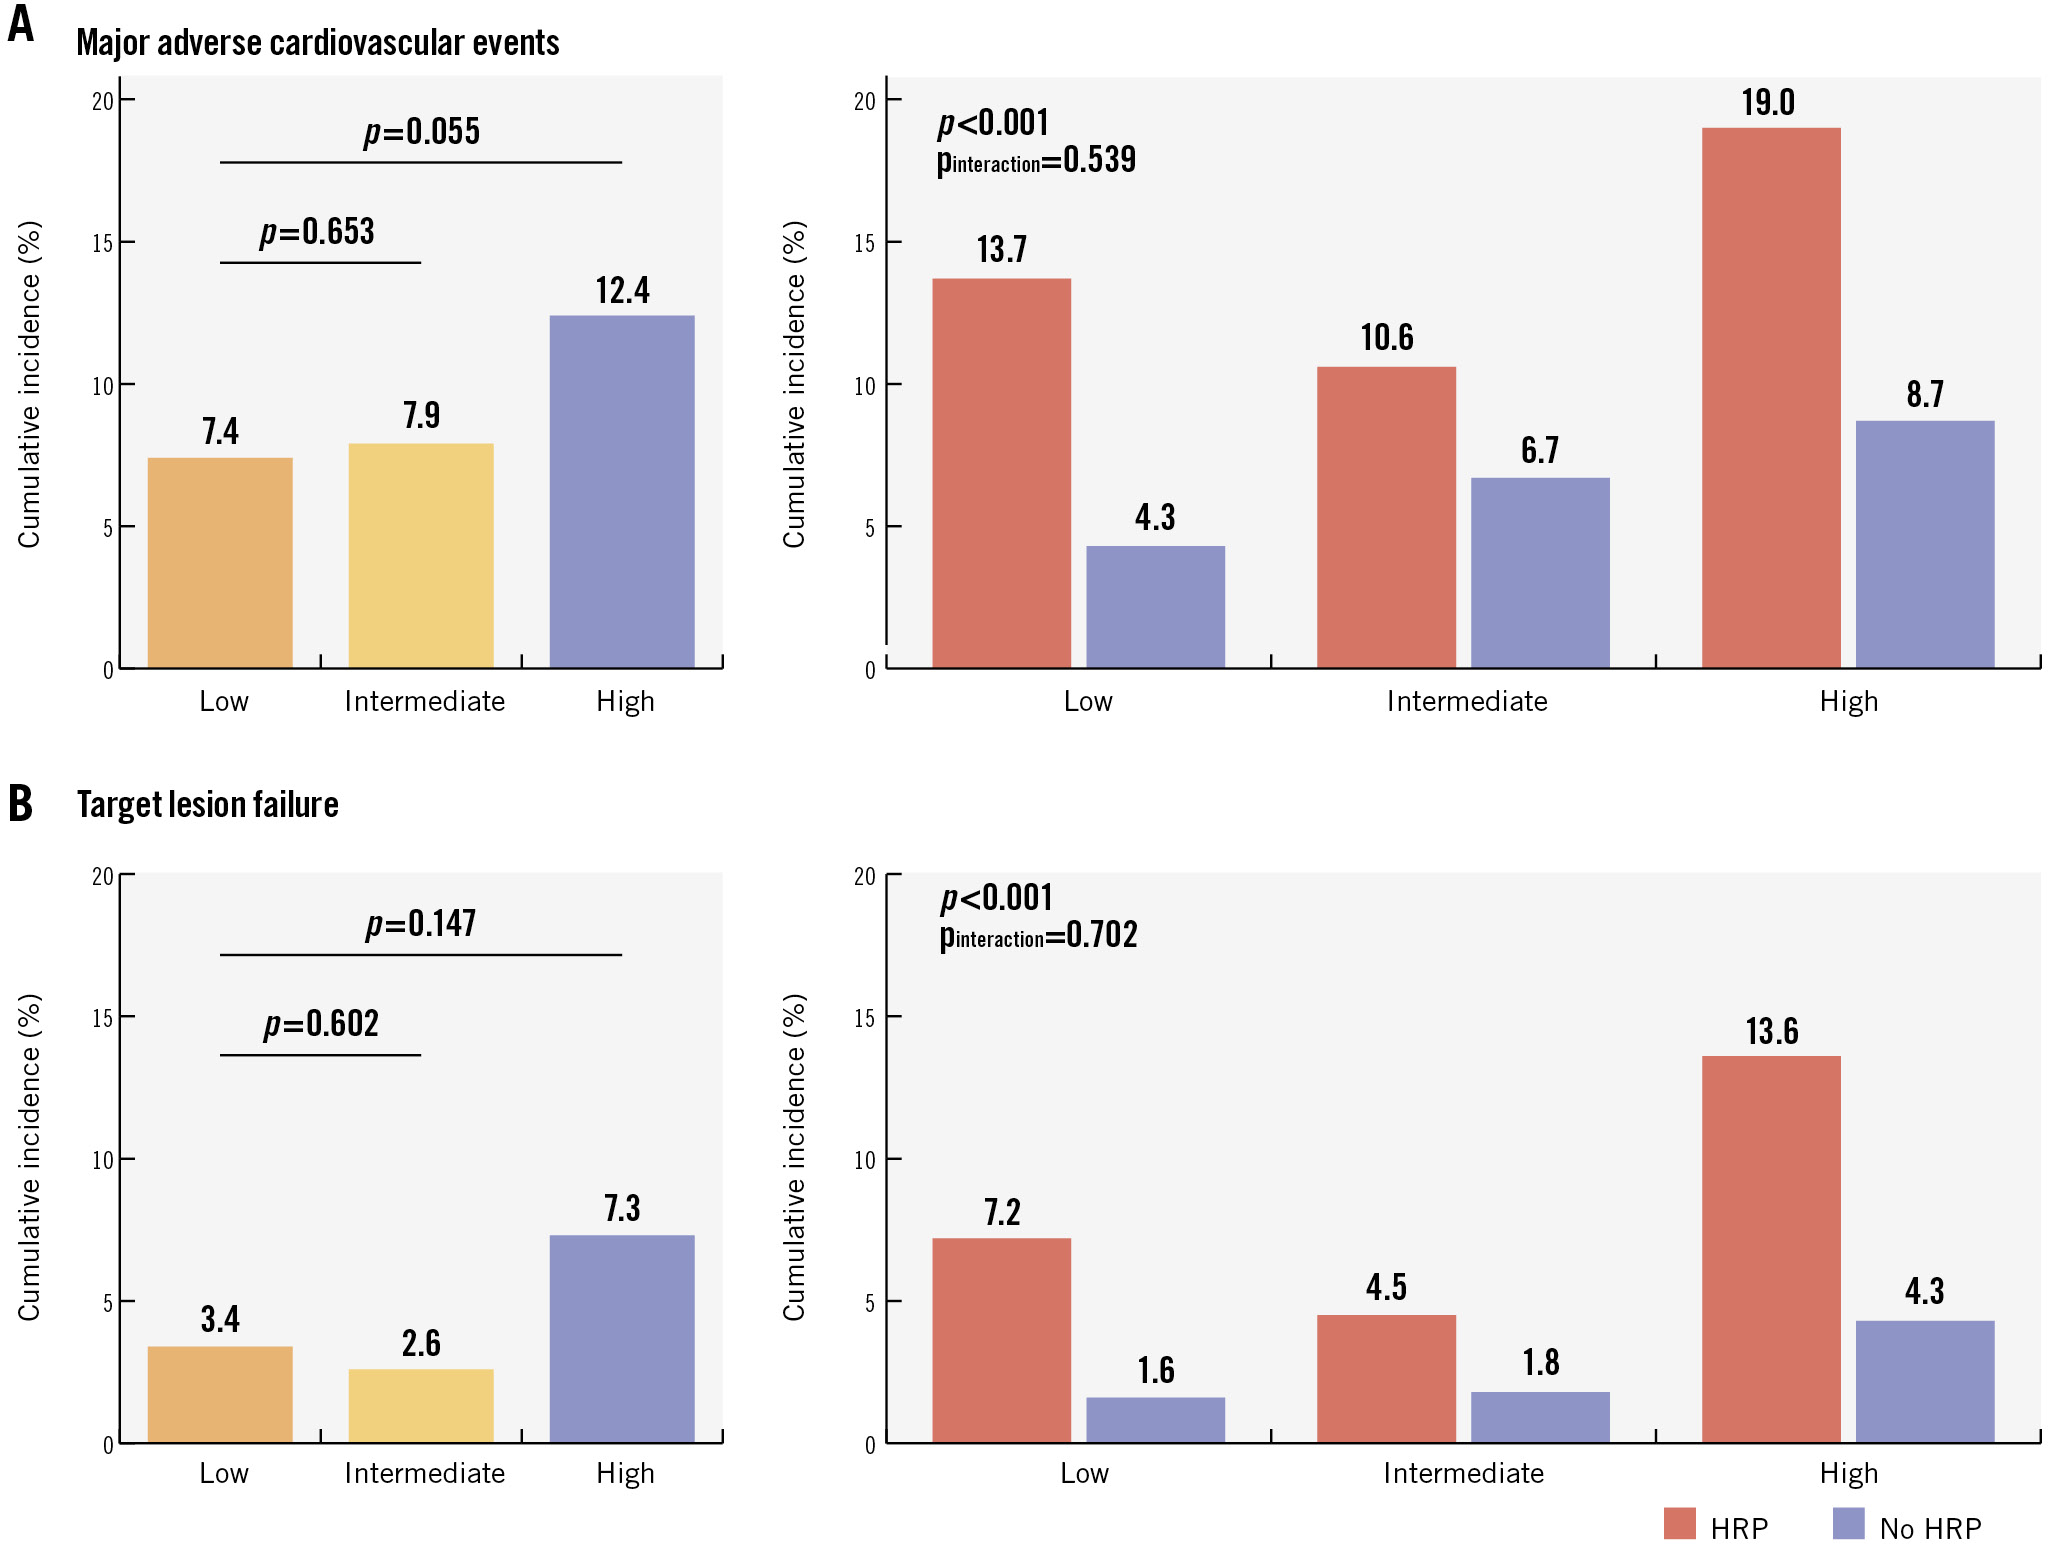
Figure 2. Cumulative incidences of the composite endpoints at two-year follow-up across different risk subgroups. Cumulative incidences of the composite endpoints of patient-level major adverse cardiovascular events (A) and lesion-level target lesion failure (B) at two-year follow-up. HRP: high-risk plaque.
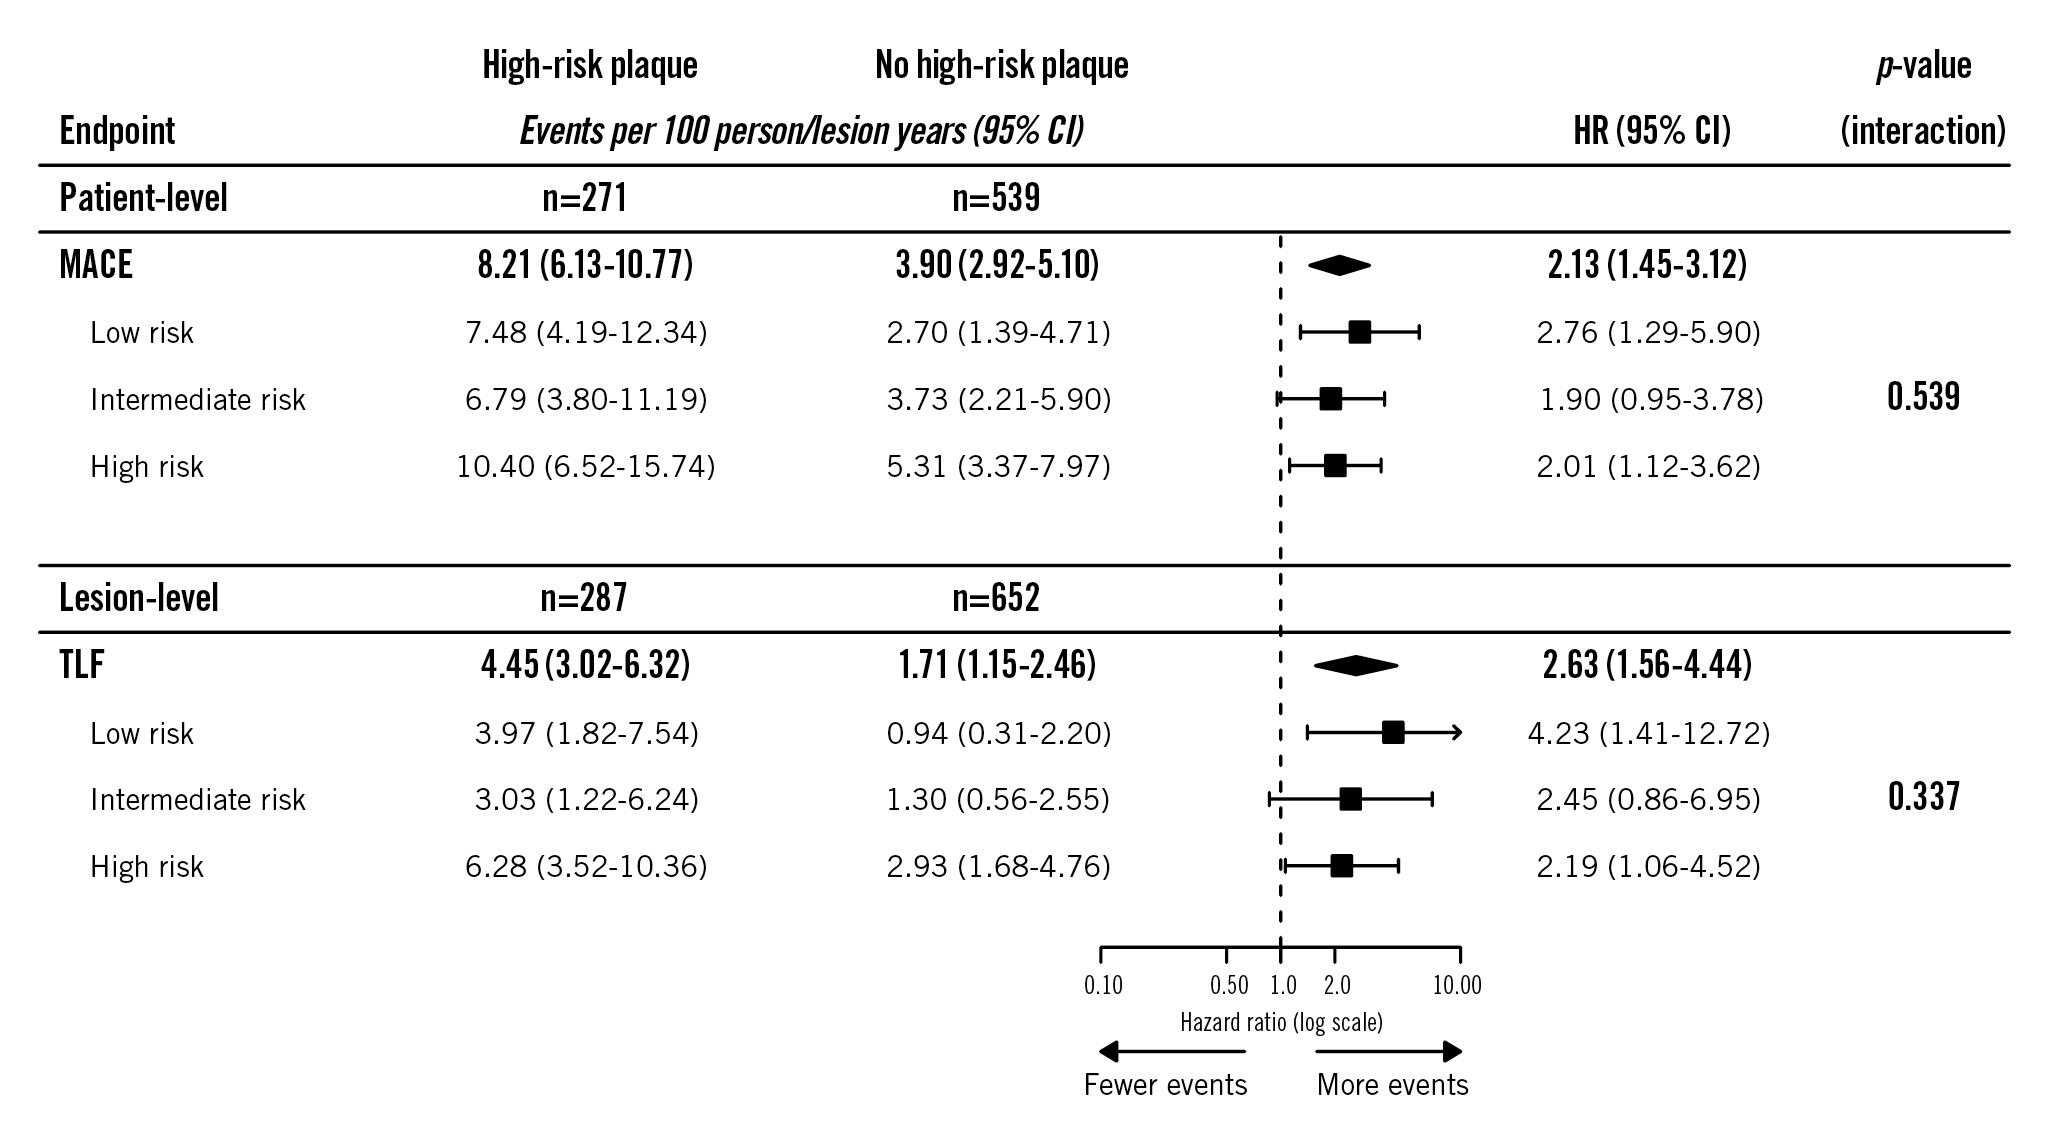
Figure 3. Clinical impact of high-risk plaques across clinical risk profiles. Associations between high-risk plaques and the composite clinical endpoints across clinical risk profiles. CI: confidence interval; HR: hazard ratio; MACE: major adverse cardiovascular events; TLF: target lesion failure
Discussion
The present analysis sought to evaluate the association between clinical risk factors and high-risk coronary plaques in non-flow-limiting deferred lesions among patients at risk for recurrent events, as well as the prognostic impact of HRPs across clinical risk profiles. The main findings were that traditional clinical risk factors had minimal, if any, association with the presence of HRPs. Particularly, the TRS-2P had no discriminative value for the identification of patients harbouring HRPs. Furthermore, the adverse prognostic implication of HRPs on both patient- and lesion-level cardiovascular outcomes appears to be consistent across patients with different clinical risk profiles, highlighting the independent value of OCT for prognostication beyond clinical risk factors. Nevertheless, by combining clinical risk factors and HRP identification using OCT, we were able to identify patients at the greatest risk for adverse patient-level and lesion-level events, which resulted in the highest positive predictive value. The high lesion-level event rate in high-risk patients with an HRP emphasises the need for additional therapeutic strategies to mitigate this risk.
A priori prediction of high-risk plaques
Numerous studies with various imaging modalities have demonstrated a significant association between HRP phenotypes and adverse outcomes234. These findings have led to multiple randomised trials aimed at evaluating the efficacy and safety of preventive treatment of HRPs. The PREVENT trial recently provided the first evidence that preventive treatment of HRPs may indeed improve patient outcomes5. However, the absolute clinical benefit was modest and was largely driven by unplanned revascularisation and rehospitalisation for unstable or progressive angina. Furthermore, the PREVENT trial highlighted the impracticality of large-scale screening for HRPs, as over half of the screened patients had no HRPs. This observation underscores the need for alternative strategies to a priori identify patients that are likely to harbour HRPs, for instance by assessing their clinical risk profile. In the present study, none of the traditional clinical risk factors were independently associated with the presence of at least one non-flow-limiting, HRP. Similarly, in a retrospective OCT study, diabetes and metabolic syndrome were not significantly associated with plaque vulnerability12. Consistent with our findings, poor discriminative value of clinical risk factors for the identification of HRPs was also observed in a secondary analysis from the prospective observational PROSPECT study, in which three-vessel intravascular ultrasound was used for the identification of HRPs. Although the Framingham risk score was significantly associated with the presence of at least one HRP in that study, the AUC of only 0.55 indicated very limited discriminative power13. Likewise, the TRS-2P had no discriminative value (AUC 0.51) in that regard in the present analysis. These results emphasise the complexity in the development and progression of coronary atherosclerosis that extends beyond traditional risk factors14 and illustrate that risk factors are insufficient to improve patient selection for targeted screening. Other potential strategies that could be explored to increase the likelihood of finding an HRP include a stepwise approach with non-invasive imaging as a gatekeeper15, evaluation of circulating inflammatory markers or lipid spectrum analyses, or the incorporation of haemodynamic measures16. In regard to the former, coronary computed tomography angiography is increasingly adopted as a first-line diagnostic in patients with suspected coronary artery disease. Although recent evidence demonstrates a significant relationship between computed tomography-identified and OCT-identified HRPs, the correlation was modest. Whether newer-generation photon-counting detector computed tomography has superior discriminative value is unknown. Nevertheless, a number of procedural variables related to more extensive (multivessel) coronary artery disease were associated with the presence of an HRP, including percutaneous coronary intervention during the index procedure and a larger number of FFR-negative target lesions. Additionally, HRPs were more likely in the presence of a target lesion in the right coronary artery. This observation is potentially related to the fact that HRPs are found throughout the right coronary artery, while they have a more clustered distribution in the proximal segments of the left anterior descending and left circumflex arteries17.
Clinical impact of high-risk plaques across risk profiles
In the present analysis, the prognostic impact of HRPs was independent of the baseline clinical risk profile. These results indicate that intensive medical therapy for plaque stabilisation and prevention of patient-level events may be beneficial across the clinical risk spectrum. A consistent hazard among lower-risk patients is in line with earlier evidence demonstrating that plaque progression and new development of HRP phenotypes is not limited to high-risk patients18. In fact, the presence of HRPs is associated with increased plaque progression and statin non-response, independently of clinical risk factors19. Nevertheless, while patients with a low-risk clinical profile and without an HRP were at the lowest risk for TLF (0.94 events per 100 lesion-years), patients with a high-risk clinical profile and an HRP were at the highest risk (6.28 events per 100 lesion-years). These findings translate into higher positive predictive values among high-risk patients and, thus, a lower number of patients required to be screened and preventively treated focally to prevent one event. Assuming an 88% relative risk reduction following pre-emptive treatment of HRPs5, the number needed to treat to prevent one TLF event per 100 lesion-years would be 18.1 in high-risk patients, compared to 28.7 in lower-risk patients. Regarding the 2-year follow-up data, the number needed to stent in patients with a high-risk clinical profile in combination with an HRP would only be 8.4. Given the relatively low number needed to treat, restricting preventive focal treatment to these very high-risk patients could be considered. However, the benefit of pre-emptive treatment remains to be established from ongoing, dedicated clinical trials. The ultimate clinical value of such a strategy will be dependent on the absolute magnitude of the effect achieved, which may, in turn, be dependent on the characteristics of the studied population, and the balance between risk and benefit. If the clinical risk score without OCT were used to indicate pre-emptive treatment, the number needed to treat among high-risk patients would be 50.4 per 100 lesion-years, assuming neither benefit nor harm of pre-emptive treatment among patients without an HRP. As such, this study highlights the independent value of intracoronary OCT for prognostication in the studied population of patients with myocardial infarction and/or diabetes.
Limitations
This study should be interpreted in view of its limitations. The analyses described were not prespecified in either of the included studies, and the results therefore remain exploratory. Therefore, no definitive or causal conclusions can be drawn from this study. Second, the TRS-2P was originally designed as a clinical risk score for secondary prevention after myocardial infarction. However, 40% of patients in the present population had not presented with myocardial infarction. Nevertheless, the TRS-2P had comparable prognostic implications in patients with chronic coronary syndrome and unstable angina in a long-term validation study20. Furthermore, we used a modified version of the TRS-2P to account for missing variables and imputed values for three indicators. However, considering that the TRS-2P has a graded association with adverse clinical outcomes, we hypothesise that leaving out those two indicators has not profoundly impacted our results. Nevertheless, bias related to these adaptations and data imputation cannot be completely ruled out, and the findings therefore remain hypothesis-generating. The absence of other variables precluded the evaluation of other risk scores, including those specifically designed for patients with chronic coronary syndrome. Third, the duration of follow-up was shorter than the 10-year follow-up period for which the TRS-2P was validated and differed between studies. Finally, the results only apply to patients with diabetes or myocardial infarction. The absolute risk difference in a lower-risk population may be negligible. Additionally, these inclusion criteria may have influenced the analyses. In particular, all patients from COMBINE (OCT-FFR) already had one indicator (i.e., diabetes), and they were therefore less likely to be classified as low risk. However, this is in line with the general population, as patients with diabetes frequently exhibit multiple other risk factors. For instance, in a real-world evaluation of the TRS-2P, less than 5% of diabetic patients had no other indicator20. Importantly, correction for this potential confounding factor was applied by incorporating the study of origin as a fixed parameter in the analyses.
Conclusions
The modified TRS-2P has no discriminative value for the identification of patients with HRPs in non-flow-limiting deferred lesions. Furthermore, HRPs in such lesions are associated with adverse patient- and lesion-level clinical outcomes, without apparent differences between clinical risk profiles. This highlights the independent value of OCT for prognostication beyond traditional risk factors in patients at risk for recurrent events. Nevertheless, combining clinical risk scores with HRP detection allows identification of patients at greatest risk for adverse outcomes.
Impact on daily practice
The presence of high-risk plaques cannot be predicted using clinical risk factors, and intracoronary optical coherence tomography has independent value for prognostication beyond traditional clinical risk factors. Nevertheless, patients at the highest risk for recurrent events can be identified by combining clinical risk scores and high-risk plaque imaging.
Funding
COMBINE (OCT-FFR) was financially supported by Abbott. PECTUS-obs was financially supported by Abbott and Health~Holland (grant number LSHM19102). Funding parties were not involved in the design and conduct of the study; collection, management, analysis, and interpretation of the data; preparation, review and approval of the manuscript; or the decision to submit the manuscript for publication.
Conflict of interest statement
R.S. Hermanides reports speaker honoraria from Amgen, Novartis, Edwards Lifesciences, and Angiocare. M. van Leeuwen reports research grants from Abbott, TOP Medical B.V., Terumo, and AstraZeneca; consulting fees from Terumo, Daiichi Sankyo, and Abbott; and speaker honoraria from CVOI. A. Belkacemi reports speaker honoraria from Daiichi Sankyo; travel fees from Novo Nordisk and Daiichi Sankyo; stock from Pfizer. E. Kedhi reports institutional research grants from Abbott and Medtronic. N. van Royen reports institutional research grants from Abbott, Health~Holland, Koninklijke Philips NV, Biotronik, and Medtronic; and speaker honoraria from MicroPort, Bayer AG, and RainMed Medical. The other authors have no conflicts of interest to declare.Impact on daily practiceThe presence of high-risk plaques cannot be predicted using clinical risk factors, and intracoronary optical coherence tomography has independent value for prognostication beyond traditional clinical risk factors. Nevertheless, patients at the highest risk for recurrent events can be identified by combining clinical risk scores and high-risk plaque imaging.
Supplementary data
To read the full content of this article, please download the PDF.