Cory:
Unlock Your AI Assistant Now!
Abstract
Background: Device-related thrombus (DRT) remains a concern after left atrial appendage closure (LAAC), particularly when the device is deeply implanted. However, the mechanistic links between implantation depth, flow dynamics, and DRT risk are not well understood.
Aims: We therefore aimed to evaluate the impact of LAAC device implantation depth on local flow characteristics and its association with DRT using patient-specific computational fluid dynamics (CFD).
Methods: The study included 285 patients undergoing LAAC with either Amplatzer Amulet or WATCHMAN devices at 10 centres. Patient-specific CFD simulations were performed using postprocedural computed tomography and echocardiography-derived boundary conditions to assess blood flow dynamics. The primary endpoint was the comparison of CFD-derived flow indices – device surface velocity index (DSVI), endothelial cell activation potential (ECAP), and the presence of eddies/stagnated flow – between proximal and distal device implantation groups. Secondary analyses explored the relationship between these flow features and DRT.
Results: Proximal implants (57.2%) showed more favourable flow patterns: higher DSVI (0.11 m/s vs 0.09 m/s; p=0.002), lower ECAP (0.75 vs 0.90; p=0.003), and fewer recirculating zones (40.5% vs 74.6%; p<0.001). DRT incidence increased with greater implantation depth, paralleled by worsening flow indices. A composite CFD-based DRT risk score, incorporating ECAP, implantation depth, and flow complexity, demonstrated good discrimination (area under the receiver operating characteristic curve [AUC] 0.81), outperforming anatomical depth alone (AUC 0.71).
Conclusions: Deeper LAAC device implantation is associated with adverse flow profiles and a higher risk of DRT. CFD-based flow characterisation may enhance risk stratification beyond anatomical criteria alone. Further studies incorporating clinical variables are warranted to validate these methods.
Left atrial appendage closure (LAAC) has advanced significantly over the past two decades, following the first successful implantation. This progress has been driven by the development of novel devices, improved procedural safety, and accumulating evidence, leading to broader clinical adoption.12 Despite these advancements, device-related thrombus (DRT) remains a major concern due to its association with a higher risk of thromboembolic events.3 Several risk factors for DRT have been identified, the majority of which are non-modifiable.45 Among the few modifiable factors, deep device implantation has consistently emerged as one of the most significant predictors of DRT across multiple studies.678 The hypothesis behind this finding, although not yet formally validated, is that distal device implants leave a relevant part of the left atrial (LA) appendage exposed to blood stasis around the device surface, which may promote thrombus formation.9 In our previous study, we observed a plausible association between implant depth and the occurrence of DRT.8 However, current imaging modalities lack the resolution and scope to fully characterise localised blood flow dynamics and stasis risk.
Recent advances in computational fluid dynamics (CFD) modelling have enabled patient-specific blood flow simulations to assess DRT risk following LAAC.101112 These simulations have provided valuable insights into the relationship between LA anatomy, haemodynamics, and thrombus development. Nonetheless, prior studies have been limited by small sample sizes, restricting the generalisability of their findings.121314 Moreover, the impact of distal implantation on haemodynamics has not been specifically addressed in a large cohort accounting for patient-specific conditions and a real LAAC implant. As a result, a critical knowledge gap persists regarding the interplay between device implantation depth, blood flow dynamics, and DRT formation. The objective of this study was to evaluate the impact of device implantation depth on blood flow dynamics after LAAC using CFD-based simulations and to explore its potential role in stratifying DRT risk.
Methods
Study design
The Impact of device implantation depth on blood flow dynamics after left atrial appendage closure (IDEAL-LAAC) study included 285 patients who underwent LAAC at a total of 10 sites in Europe and North America between January 2019 and October 2023. Inclusion criteria were as follows: (1) use of WATCHMAN (Boston Scientific) or Amplatzer Amulet (Abbott) devices; (2) availability of cardiac computed tomography (CT) during follow-up; and (3) pulsed-wave Doppler assessment of the mitral valve carried out within 6 months of CT acquisition (either before or after LAAC). This 6-month window applied if the patient remained clinically stable (e.g., no decompensated heart failure). Patients with severe (≥5 mm) peridevice leaks (PDLs) were excluded. The main patient cohort was derived from data in our previous study.8 To reach a final cohort of over 250 cases, with an approximate 1:10 ratio between DRT and no DRT, additional centres were invited to participate, each contributing a minimum of 30 cases (Supplementary Figure 1). This ratio was selected to ensure an adequate number of DRT cases for meaningful statistical analysis, given the relatively low incidence of DRT. The study was conducted in accordance with the local ethics committees of each participating centre, and all patients provided signed informed consent for the procedure. The research adhered to the principles of the Declaration of Helsinki (2013 revised version).
The indication, device selection, procedural approach, and imaging follow-up were performed according to the standards of each participating centre. Details regarding the LAAC procedure and special features of the occlusion devices have been published elsewhere.15 Baseline characteristics, procedural features, and outcomes at follow-up were prospectively collected in an LAAC-specific database at each participating centre.
Three-dimensional model construction and flow simulation
A patient-specific computational modelling pipeline was adapted for the studied cohort to stratify the influence of device implantation depth on haemodynamic outcomes following LAAC (Figure 1).14 Anonymised postprocedural CT scans were used to segment the left atrium and the occluder device, with manual refinements to accurately delineate the region between the LA anatomy and the device surface. Three-dimensional (3D) reconstructions were subsequently generated (Figure 1B). In cases where DRT was present, the thrombus was segmented as part of the LA. Geometries were preprocessed and corrected to ensure CFD suitability. Only the left atrium was used for simulations, while the occluder device was included for visualisation. Flow simulations were performed using Ansys Fluent 21 R2 (ANSYS, Inc.). Boundary conditions followed established strategies,1617 using a generic pulmonary vein pressure waveform as the inlet and patient-specific Doppler-derived velocities at the mitral valve outlet, recorded from standard apical 4-chamber echocardiographic views, with LA wall motion also included. Blood was treated as a compressible, non-Newtonian fluid using the Carreau model.18 Each simulation spanned 5 cardiac cycles and was tailored to individual heart rates with an average runtime of 11 hours per case.
Patient-specific blood flow simulations allowed the local analyses of the following in silico indices (Figure 2, Supplementary Figure 2): (a) the velocity magnitude averaged over the whole cardiac cycle within the area over the device surface, called the device surface velocity index (DSVI) in the present study; (b) regions with complex flow patterns and low wall shear stress, characterised using the endothelial cell activation potential (ECAP) index;19 and (c) the presence of swirling flows (e.g., eddies) or stagnated flow next to the device surface. All these indices have been previously associated with the risk of thrombus formation.11 A composite risk score for DRT was calculated using a weighted combination of these indices. Post-processing analysis was performed with ParaView 5.9.1 (kitware; https://www.paraview.org/). For a more detailed, step-by-step description of the computational pipeline and the derivation of these haemodynamic parameters, readers are referred to Supplementary Appendix 1.161819202122
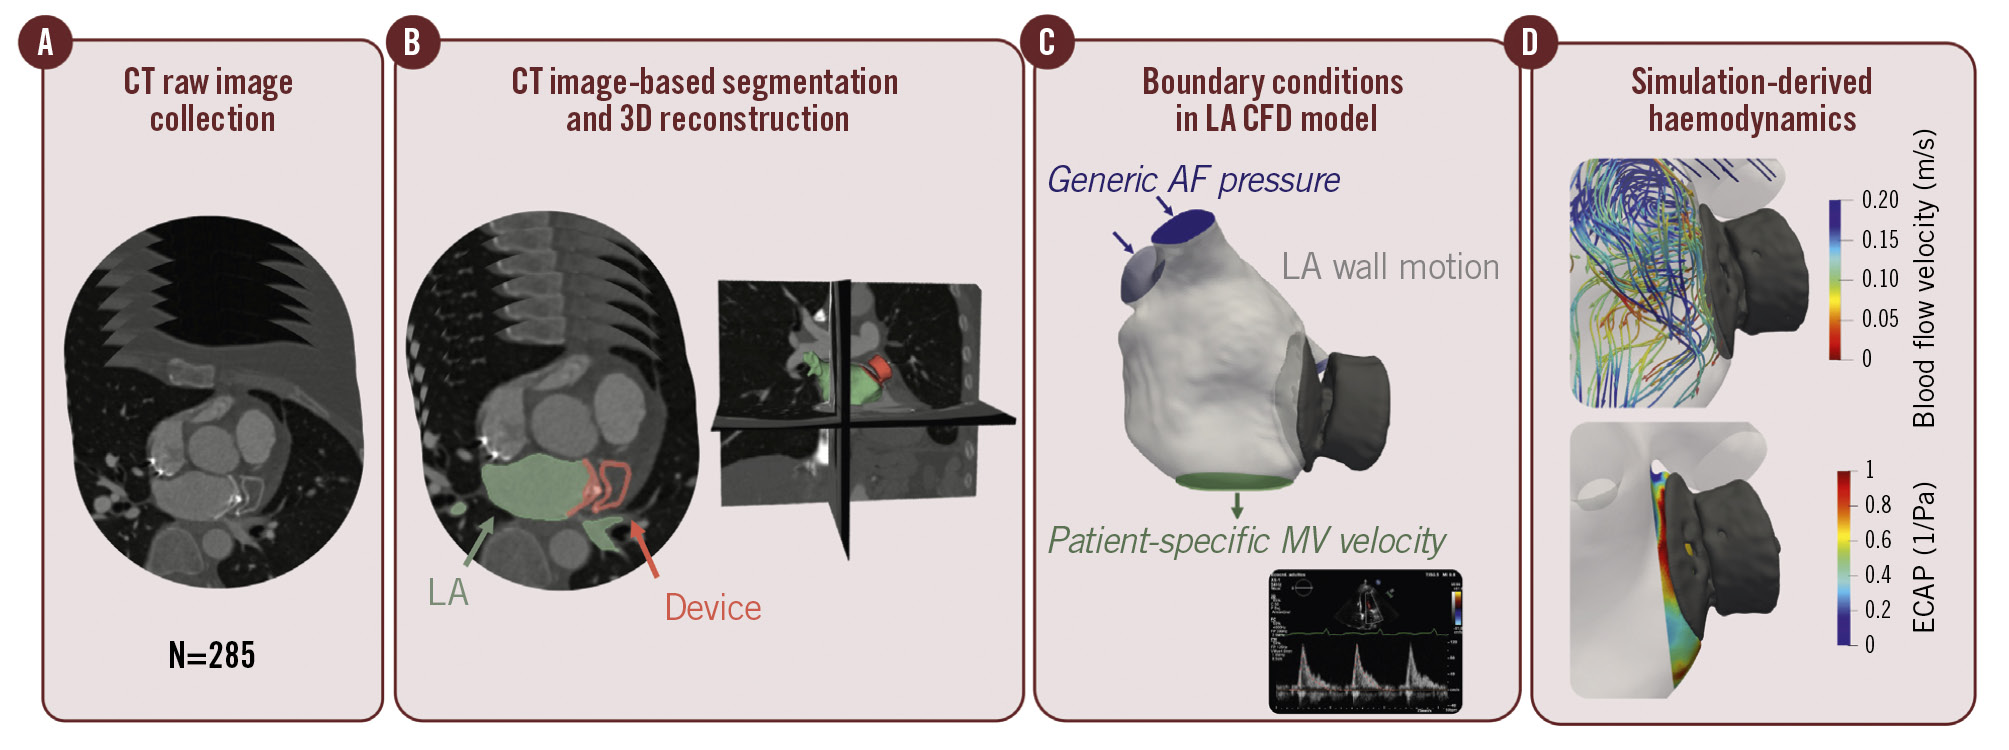
Figure 1. Workflow of computational fluid dynamics simulations. Overview of the patient-specific computational fluid dynamics (CFD) pipeline to stratify the risk of device-related thrombus (DRT). A) Description of the computed tomography (CT) post-left atrial appendage closure cohort, including pacifier- and plug-type device configurations. B) Binary mask segmentations for both the device and left atrium (LA) for each of the included patients, followed by three-dimensional (3D) model reconstruction. C) Outline of the modelling strategy applied in personalised CFD simulations. D) Evaluation of DRT risk scores derived from in silico haemodynamic indices. AF: atrial fibrillation; ECAP: endothelial cell activation potential; MV: mitral valve
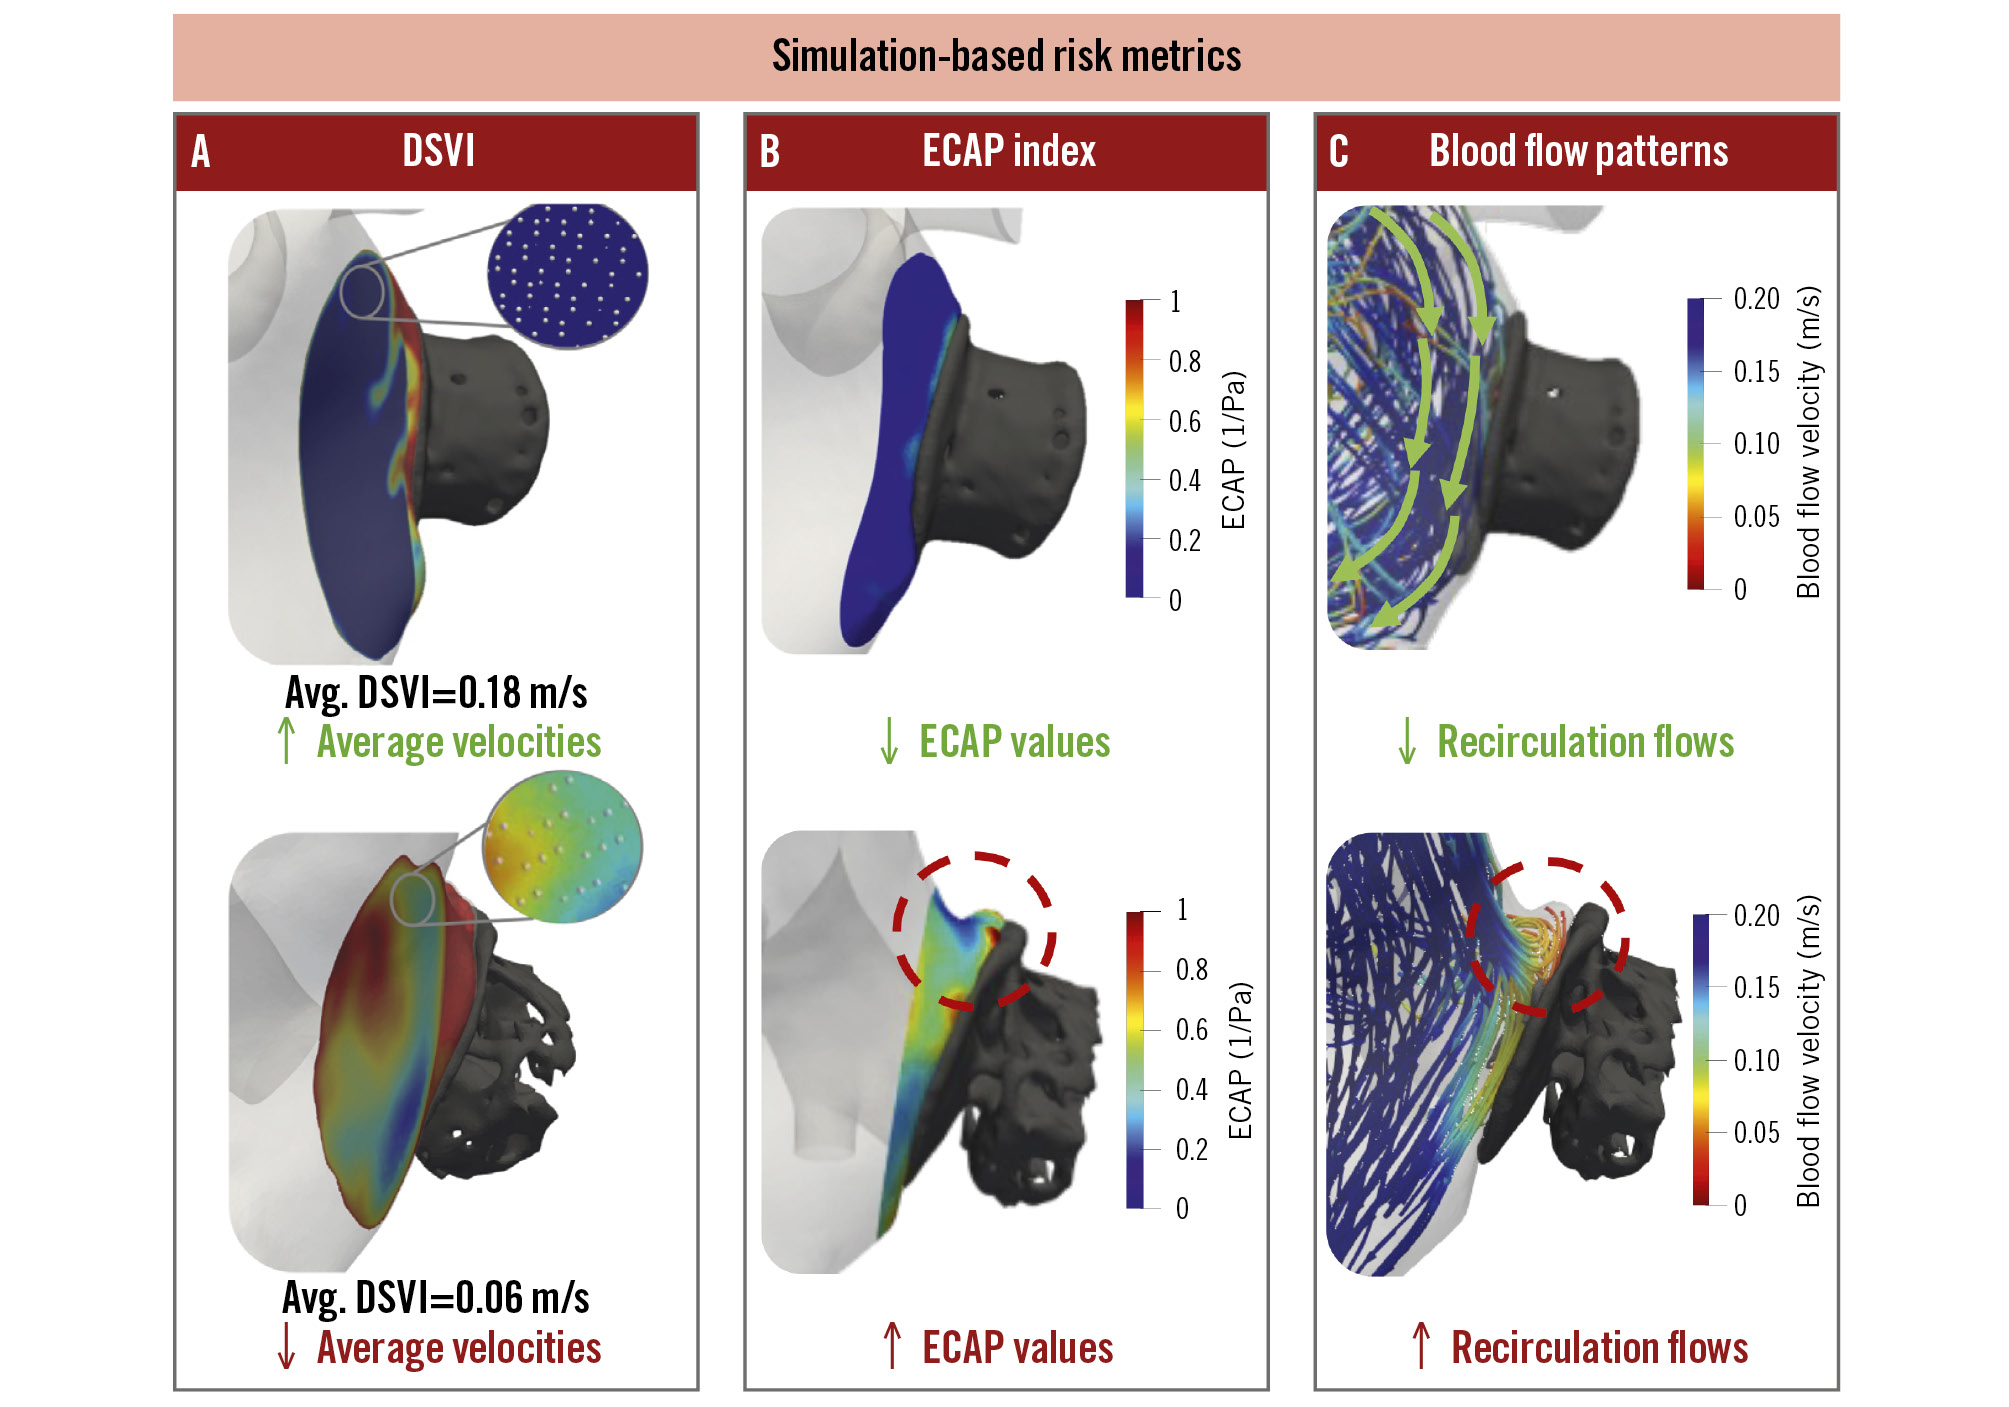
Figure 2. Computational fluid dynamics evaluation. Description of in silico haemodynamic metrics used to evaluate the impact of device configuration on blood flow dynamics and risk of stasis, including local average device surface velocity index (DSVI; A) at discrete points (white points), endothelial cell activation potential (ECAP; B), and presence of recirculation flows (C). Top: favourable conditions with a lower risk of device-related thrombus (average DSVI >0.1 m/s, low ECAP values), shown in blue, with laminar, organised flow. Bottom: unfavourable conditions leading to a higher risk of device-related thrombus (average DSVI <0.1 m/s, high ECAP values), defining disturbed flow and recirculations (red circle).
Study endpoints
For this study, patients were categorised into two groups – proximal or distal implantation – based on the depth of the implant relative to the pulmonary ridge (PR). The definition of proximal implantation varied by device type (lobe/disc vs single lobe), based on a previous publication,8 as follows (Supplementary Figure 3): in the lobe/disc device group, proximal implantation was defined as the disc being positioned at the level of the PR or less than 1 mm from it. In the single-lobe device group, proximal implantation was defined as a device position with <10 mm between the PR edge and the proximal surface of the device. Distal implantation, for both device groups, was defined as any implantation not meeting the criteria for proximal positioning. Device implantation depth was assessed exclusively using cardiac CT. Measurements were obtained in multiplanar reconstructions orthogonal to the device axis. When different CT planes yielded varying depth measurements for the same patient, the maximum implantation depth was systematically selected, as it best represented the greatest degree of device intrusion into the left atrial appendage.
Device-related thrombosis was defined as high-grade hypoattenuated thickening, which includes grade 2 (sessile mass >3 mm without left atrial wall continuity or with an irregular surface) and grade 3 (pedunculated mass).2324 DRT assessment was performed exclusively on contrast-enhanced, electrocardiogram-gated cardiac CT. Scans were acquired according to site-specific follow-up protocols, typically between 1 and 3 months post-implantation. Procedural adverse events and peridevice leaks were reported according to the Munich consensus document.25
The primary endpoint of the study was to assess differences in blood flow dynamics between proximal and distal implantation groups. Secondary endpoints included (1) the evaluation of blood flow dynamic differences across graded implantation depths (<10 mm [disc/lobe only], 10-20 mm, or >20 mm), and (2) the assessment of blood flow dynamics in relation to the presence or absence of DRT.
Statistical analysis
Categorical variables are presented as frequencies (percentages), with the differences assessed by the chi-square test (or Fisher’s exact test when appropriate). Continuous variables are presented as a mean±standard deviation or median (interquartile range [IQR]). The Kolmogorov-Smirnov test was applied to determine the variable distribution. Continuous variables were compared using the Student’s t-test or the Mann-Whitney U test, as appropriate.
Univariate logistic regression was similarly performed for implantation depth and CFD characteristics that differed between the DRT and control groups. Those with a predetermined p<0.20 in the univariate logistic regression were included in a subsequent multivariable logistic regression analysis and are presented as odds ratios (ORs) and 95% confidence intervals (CIs). These ratios were then converted to integer values, enabling the creation of a preliminary CFD DRT risk score.
A receiver operating characteristic curve analysis was performed using the CFD DRT risk score as a categorical variable to evaluate its additive impact beyond device implantation depth. Two-sided p-values with an alpha ≤0.05 level of significance were used for all tests. Analyses were performed using Stata software, version 14.0 (StataCorp).
Results
A total of 285 patients undergoing LAAC were included in the final analysis. The mean age was 75.9±8.5 years, with 34.4% being females, and the median CHA2DS2-VASc score was 4.0 (IQR 3.0-5.0). The baseline clinical and procedural characteristics of the study population, stratified according to the implantation depth, are summarised in Table 1.
Table 1. Baseline characteristics of the study population, overall and according to the implanted LAAC device depth.
| Total N=285 | Proximal implantation N=163 | Distal implantation N=122 | p-value | |
|---|---|---|---|---|
| Age, years | 75.9±8.5 | 75.8±8.0 | 76.1±9.1 | 0.791 |
| Female sex | 98 (34.4) | 57 (35.0) | 41 (33.6) | 0.810 |
| Hypertension | 224 (78.6) | 129 (79.1) | 95 (77.9) | 0.801 |
| Diabetes mellitus | 59 (20.7) | 32 (19.6) | 27 (22.1) | 0.615 |
| Coronary artery disease | 81 (28.4) | 39 (23.9) | 42 (34.4) | 0.052 |
| Previous heart failure | 58 (20.4) | 31 (19.0) | 27 (22.1) | 0.522 |
| Permanent atrial fibrillation | 139 (48.8) | 70 (42.9) | 69 (56.6) | 0.023 |
| History of stroke | 95 (33.3) | 55 (33.7) | 40 (32.8) | 0.874 |
| Prior bleeding | 216 (75.8) | 124 (76.1) | 92 (75.4) | 0.905 |
| CHA2DS2-VASc score | 4.0 (3.0-5.0) | 4.0 (3.0-5.0) | 4.0 (3.0-5.0) | 0.606 |
| HAS-BLED score | 3.0 (3.0-4.0) | 3.0 (3.0-4.0) | 3.0 (3.0-4.0) | 0.407 |
| LVEF, % | 60.0 (53.0-60.0) | 60.0 (53.0-60.0) | 60.0 (53.0-60.0) | 0.258 |
| Device type | 0.540 | |||
| Disc/lobe | 167 (58.6) | 93 (57.1) | 74 (60.7) | |
| Single lobe | 118 (41.4) | 70 (42.9) | 48 (39.3) | |
| Device size, mm | 25.0 (24.0-28.0) | 25.0 (24.0-28.0) | 25.0 (22.0-28.0) | 0.023 |
| Procedure-related complications | 8 (2.8) | 6 (3.7) | 2 (1.6) | 0.304 |
| Antithrombotic treatment at discharge | 0.764 | |||
| None | 61 (21.4) | 38 (23.3) | 23 (18.9) | |
| SAPT | 103 (36.1) | 59 (36.2) | 44 (36.1) | |
| DAPT | 88 (30.9) | 47 (28.8) | 41 (33.6) | |
| OAC | 33 (11.6) | 19 (11.7) | 14 (11.5) | |
| Categorical variables are presented as n (%) and continuous variables as mean±standard deviation or median (interquartile range). DAPT: dual antiplatelet therapy; LAAC: left atrial appendage closure; LVEF: left ventricular ejection fraction; OAC: oral anticoagulation; SAPT: single antiplatelet therapy | ||||
Baseline and procedural characteristics according to device implantation depth
Proximal device implants were present in 163 patients (57.2%) and distal implants in 122 patients (42.8%). Baseline characteristics were comparable between the two groups. The mean age was similar in each group (75.8±8.0 years in the proximal implantation group vs 76.1±9.1 years in the distal implantation group; p=0.791), and both groups had a predominance of male patients (65.0% vs 66.4%; p=0.810). Cardiovascular risk factors and non-cardiovascular comorbidities, including chronic kidney disease, were evenly distributed (allp>0.05), with the exception of a lower prevalence of permanent atrial fibrillation (AF) in the proximal implantation group (42.9% vs 56.6%; p=0.023). No significant differences were observed between the groups in terms of ischaemic risk (CHA2DS2-VASc score; p=0.60) or bleeding risk (HAS-BLED score; p=0.40).
Disc/lobe devices (Amplatzer Amulet) were the most frequently used in both groups. However, the device size was numerically smaller in the distal implantation group (p=0.023). The incidence of procedural complications was low and comparable among groups (all p≥0.05). Postprocedural antithrombotic therapy predominantly consisted of single or dual antiplatelet therapy, with no significant differences between groups (p=0.76).
Flow dynamics according to device implantation depth
Significant differences in blood flow dynamics were observed between the proximal and distal device implantation groups (Table 2, Figure 3). The median blood flow velocity (i.e., DSVI) was higher in the proximal group compared with the distal group (0.11 m/s [IQR 0.08-0.15] vs 0.09 m/s [IQR 0.06-0.12]; p=0.002). Similarly, the ECAP was significantly lower in the proximal group (0.75 [IQR 0.50-1.20]) than in the distal group (0.90 [IQR 0.67-1.50]; p=0.003). Blood flow complexity, defined as the presence of eddies and/or stagnated flow zones, was substantially less frequent in the proximal group (40.5%) compared with the distal group (74.6%; p<0.001).
When patients were further stratified by specific implantation depth (<10 mm, 10-20 mm, or >20 mm), a progressive worsening of simulation-based haemodynamic indices was observed with deeper implantation, indicating an association between deeper implantation and less favourable flow patterns (Supplementary Table 1, Supplementary Figure 4). No differences were observed when the results were stratified according to the presence of PDL (Supplementary Table 2).
Table 2. Simulation-based haemodynamic indices of the study population, in relation to the implanted LAAC device depth, and the presence of DRT.
| Simulation-based haemodynamic indices in relation to the implanted device depth | ||||
|---|---|---|---|---|
| Total N=285 | Proximal N=163 | Distal N=122 | p-value | |
| DSVI, m/s | 0.10 (0.07-0.14) | 0.11 (0.08-0.15) | 0.09 (0.06-0.12) | 0.002 |
| Endothelial cell activation potential | 0.80 (0.60-1.30) | 0.75 (0.50-1.20) | 0.90 (0.67-1.50) | 0.003 |
| Eddies and/or stagnated flow | 157 (55.1) | 66 (40.5) | 91 (74.6) | <0.001 |
| Simulation-based haemodynamic indices in relation to the presence of device-related thrombus | ||||
| Total N=285 | DRT N=29 | No DRT N=256 | p-value | |
| DSVI, m/s | 0.10 (0.07-0.14) | 0.08 (0.05-0.13) | 0.10 (0.07-0.14) | 0.064 |
| Endothelial cell activation potential | 0.80 (0.60-1.30) | 1.10 (0.70-1.60) | 0.80 (0.55-1.30) | 0.020 |
| Eddies and/or stagnated flow | 157 (55.1) | 28 (96.6) | 129 (50.4) | <0.001 |
| Categorical variables are presented as n (%) and continuous variables as median (interquartile range). Left atrial volume was similar between groups (DRT: 160±42 mL vs no DRT: 157±55 mL). DRT: device-related thrombus; DSVI: device surface velocity index; LAAC: left atrial appendage closure | ||||
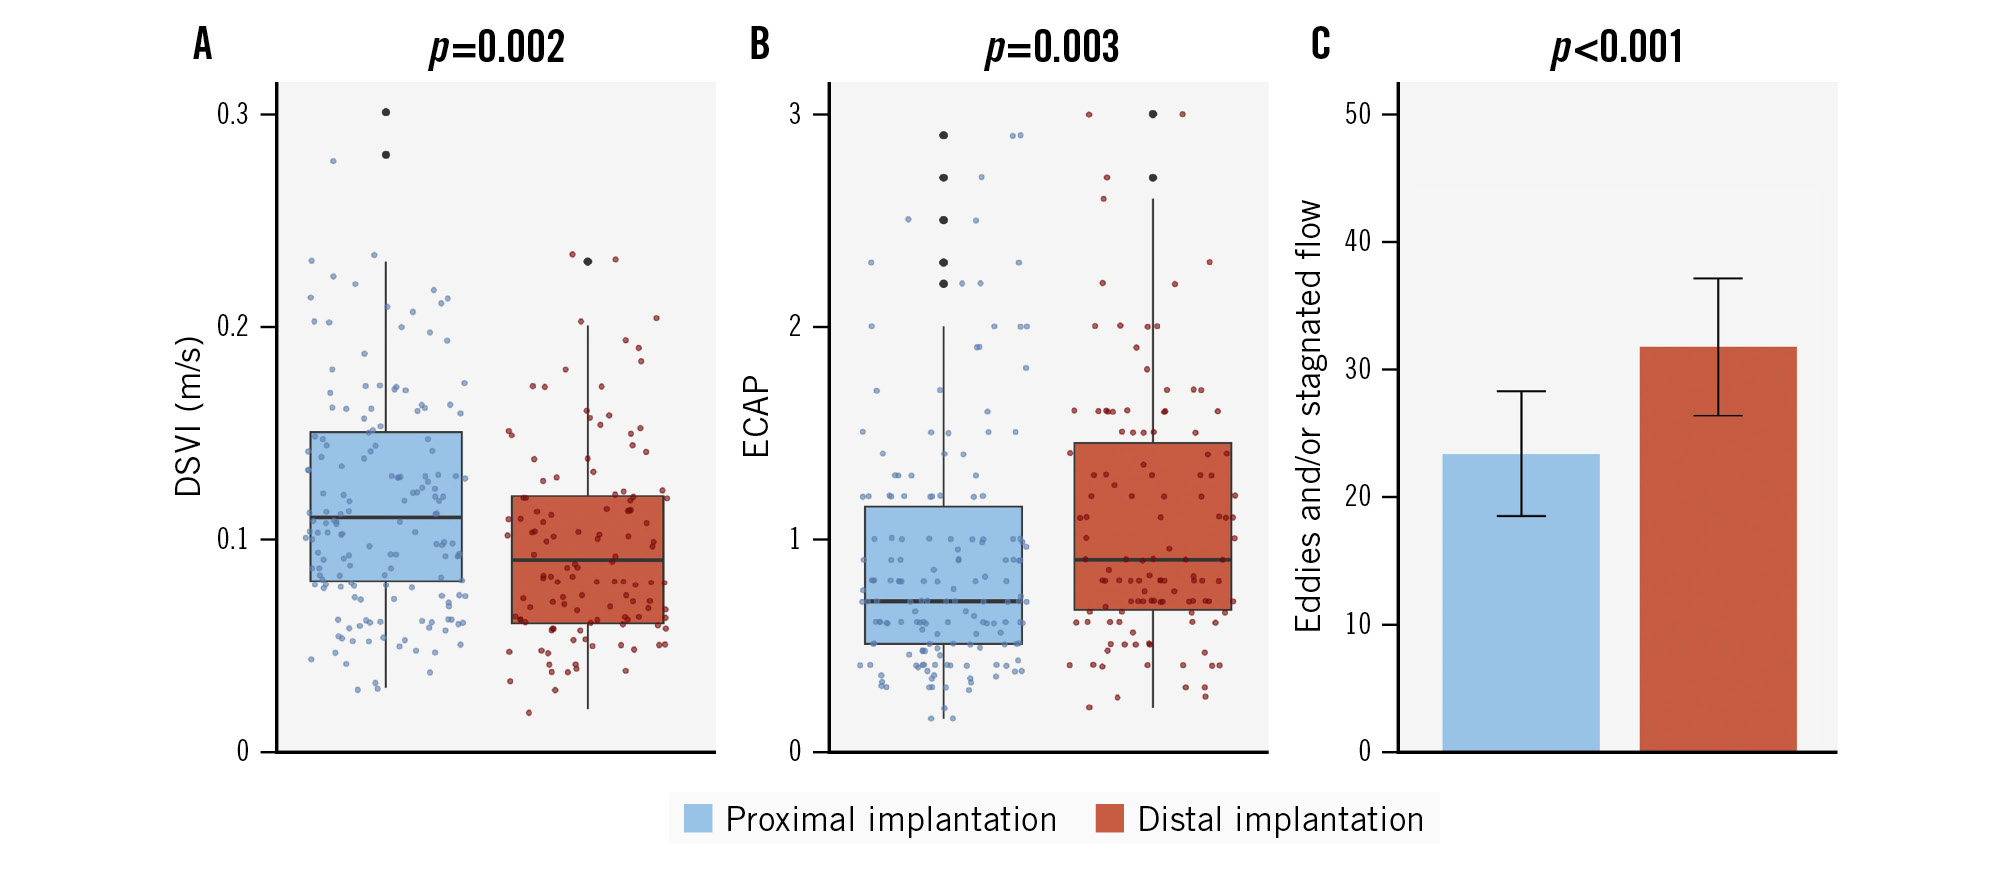
Figure 3. Simulation-based haemodynamic indices according to LAAC device implantation depth (proximal vs distal implantation). Comparison of flow characteristics between proximal (blue) and distal (red) LAAC device implantation. A) Device surface velocity index (DSVI). B) Endothelial cell activation potential (ECAP). C) Eddies and/or stagnated flow. LAAC: left atrial appendage closure
Flow dynamics according to DRT status
Among the included patients, 29 (10.2%) were diagnosed with DRT (Table 2, Figure 4). Compared with patients without DRT, those with DRT exhibited a trend towards lower blood flow velocity (0.08 m/s [IQR 0.05-0.13] vs 0.10 m/s [IQR 0.07-0.14]), although this difference did not reach statistical significance (p=0.064). However, ECAP values were significantly higher in the DRT group, with a median of 1.10 (IQR 0.70-1.60) versus 0.80 (IQR 0.55-1.30) in those without DRT (p=0.020). Finally, almost all patients with DRT exhibited eddies and/or stagnated flow on simulation (96.6%), compared with just over half of patients (50.4%) without DRT (p<0.001).
When stratifying patients by implantation depth, a gradient in DRT incidence was observed. DRT occurred in 4.3% of patients with proximal implants, and its prevalence increased progressively with deeper implants: 7.9% in those with <10 mm depth, 19.4% in the 10-20 mm group, and 41.7% in patients with an implantation depth >20 mm (p<0.001).
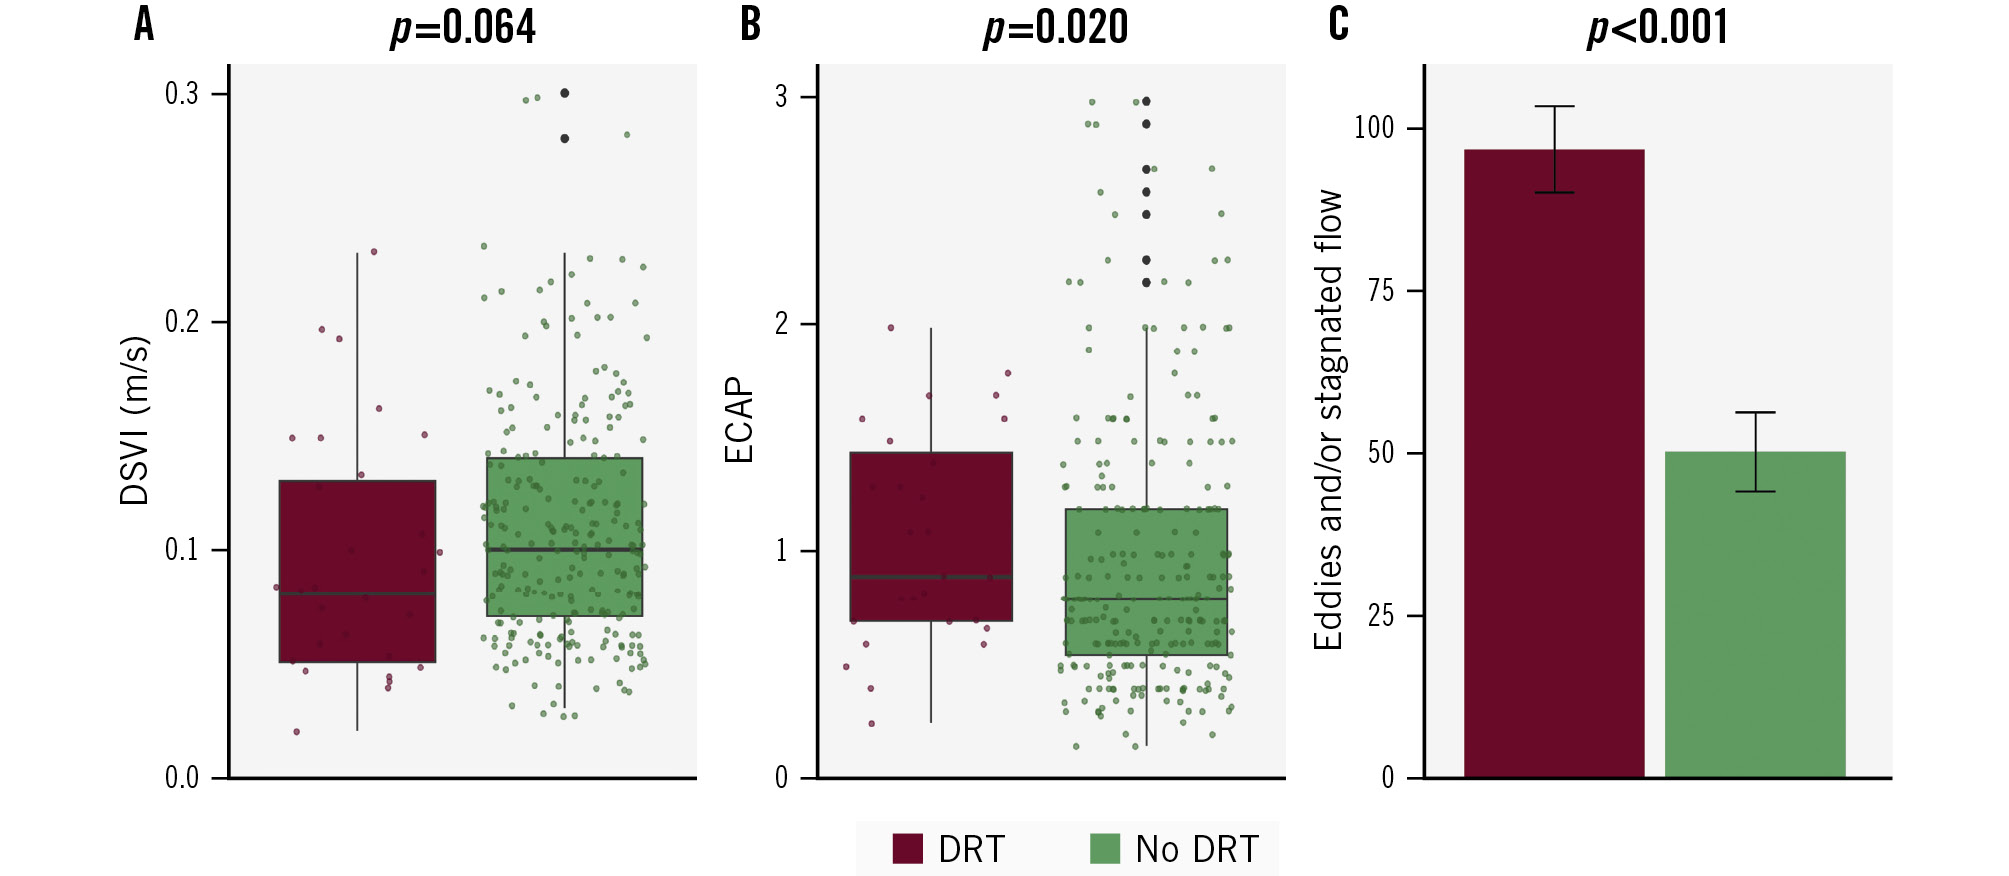
Figure 4. Simulation-based haemodynamic indices according to device-related thrombus occurrence. Comparison of flow characteristics between DRT (dark red) and no DRT (green). A) Velocity over the LAAC device. B) Endothelial cell activation potential (ECAP). C) Eddies and/or stagnated flow. DRT: device-related thrombus; DSVI: device surface velocity index; LAAC: left atrial appendage closure
Preliminary DRT stratification according to flow characteristics
In the univariate analysis including both device implantation depth and flow characteristics, only device implantation depth, ECAP, and the presence of eddies and/or stagnated flow were significantly associated with DRT (Supplementary Table 3). In contrast, median blood flow velocity was not significantly associated with DRT occurrence. To explore a risk score to rule out DRT based on implantation depth and flow characteristics, these factors were converted into integer values (Supplementary Table 4) and incorporated into a composite DRT risk score: 1 point for an ECAP ≥0.5, 2 points for an implantation depth of 10-20 mm, 3 points for an implantation depth >20 mm, and 4 points for the presence of eddies and/or stagnated flow. Individual scores were calculated for each patient (Supplementary Table 5), and patients were stratified into 3 risk categories: low risk (0-3 points), moderate risk (4-5 points), or high risk (≥6 points). The distribution of DRT across these risk categories revealed that 100% of low-risk patients (all 127) did not experience DRT, 12.36% of moderate-risk patients (11 out of 89) developed DRT, and 26.09% of high-risk patients (18 out of 69) had DRT (Table 3). These differences were statistically significant (p<0.001). The DRT risk score based on device implantation depth and flow characteristics demonstrated excellent discrimination, with an area under the receiver operating characteristic curve (AUC) of 0.81 (95% CI: 0.75-0.86) (Supplementary Figure 5). This score improved prediction compared to the use of device implantation depth alone (AUC 0.71 [95% CI: 0.62-0.81]). In the multivariable analysis, only the high-risk CFD score was independently associated with DRT (OR 6.20, 95% CI: 2.57-14.97; p<0.001), while no other clinical or procedural variables demonstrated significant associations (Supplementary Table 6).
Table 3. Device-related score based on computational fluid dynamics simulations.
| No DRT (n=256) | DRT (n=29) | p-value | |
|---|---|---|---|
| DRT score | <0.001 | ||
| Low risk | 127 (100) | 0 (0) | |
| Moderate risk | 78 (87.6) | 11 (12.4) | |
| High risk | 51 (73.9) | 18 (26.1) | |
| Categorical variables are presented as n (%). DRT: device-related thrombus | |||
Discussion
To the best of our knowledge, this is the largest multicentre study to evaluate blood flow dynamics through CFD simulations in patients undergoing LAAC (Central illustration). The key findings can be summarised as follows: (i) a distal device implantation was associated with significantly abnormal flow dynamics, with deeper implants linked to lower velocities and greater turbulence; (ii) the presence of disturbed flow patterns was strongly associated with the occurrence of DRT, supporting a probable mechanistic link between local haemodynamics and thrombus formation; and (iii) a DRT risk score incorporating implantation depth and flow characteristics may facilitate DRT risk stratification.
LAAC is gaining interest as an alternative to long-term anticoagulation for stroke prevention in patients with AF who have contraindications or high bleeding risk.26 Although relatively uncommon, DRT occurs in approximately 4-6% of LAAC cases and carries significant clinical implications due to its association with thromboembolic events and the need for more intensive antithrombotic therapy, which, in turn, increases the risk of bleeding complications.27 Several non-modifiable factors – such as age, female sex, permanent AF, coagulopathy, and renal disease – have been proposed as independent predictors of DRT,4 but their clinical utility for prevention is limited. To date, only post-LAAC antithrombotic therapy and device implantation depth have been identified as potentially modifiable contributors to DRT risk. As many LAAC candidates cannot tolerate prolonged antithrombotic therapy,28 procedural factors such as implantation depth have emerged as key determinants of long-term thrombotic risk.29
Although the association between device implantation depth and DRT has been consistently demonstrated in prior reports,678 studies assessing the mechanisms that underlie this relationship are still scarce. Thrombus formation is classically explained by Virchow’s triad, which includes 3 key factors: abnormal blood flow, endothelial injury, and hypercoagulability.30 When these elements converge, they create a prothrombotic environment that facilitates thrombus development. While the concept was developed a long time ago, its principles remain highly relevant and may help explain the link between device implantation depth and DRT, particularly through local flow disturbances that could trigger this pathological cascade. In this context, CFD simulations offer a unique opportunity to characterise flow patterns in detail and to identify unfavourable haemodynamic conditions that may predispose to thrombus formation, thereby contributing to a deeper understanding of the pathophysiological basis of DRT and the role of device implantation depth.
In our study, we observed a correlation between device implantation depth and blood flow dynamics. Specifically, distal device implantations tended to be associated with lower velocities and a higher prevalence of turbulent flow, as evaluated through ECAP and the presence of eddies and/or stagnated flow. This association appeared more pronounced when implants were positioned deeper than 10 mm. The rationale behind this finding may be explained by the fact that deeper implants could create a larger uncovered area, also considered a larger neo-appendage post-LAAC, as suggested by Rashid et al.9 This uncovered area is likely to become larger as the implant is positioned more distally, as demonstrated in our previous study,78 potentially creating the ideal environment for the formation of stasis zones, as indicated by our CFD simulation findings.
Importantly, this pattern also tended to remain consistent when comparing blood flow dynamics between patients with and without DRT, with affected individuals generally showing reduced velocities and increased flow turbulence. Among the three parameters assessed, the presence of eddies and/or stagnated flow appeared to be particularly frequent, being observed in nearly 100% of DRT cases. Our findings are consistent with the study by Vogl et al,12 which included 38 patients undergoing LAAC, 19 of whom developed DRT. CFD simulations were performed to quantify flow dynamics using time-averaged wall shear stress, the oscillatory shear index, and ECAP. Patients with DRT had significantly lower time-averaged wall shear stress (1.76±1.24 Pa vs 2.90±2.70 Pa), a higher oscillatory shear index (0.19±0.11 vs 0.17±0.11), and higher ECAP (0.23±0.58 Paâ»Â¹ vs 0.17±0.30 Paâ»Â¹) compared with controls (p<0.001 for all). Importantly, the link between DRT occurrence and adverse flow seemed more pronounced when stratifying patients by implantation depth, with deeper implants associated with both higher DRT rates and more pronounced turbulent flow. Importantly, we explored whether these associations could be explained by more advanced atrial remodelling, as suggested by the hypothesis that turbulent flow and deep implantation may simply reflect underlying atrial cardiomyopathy. In our study, left atrial volume did not differ significantly between patients with or without DRT, and the CFD simulations – driven by patient-specific mitral inflow velocities – implicitly captured functional atrial impairment when present. Moreover, the localised region of stagnation identified by CFD appears to arise from the uncovered proximal recess created by deeper implantation, a geometric feature that is distinct from global atrial flow patterns. Although these findings suggest a potential mechanistic link between local geometry and thrombogenic flow patterns, they should be interpreted with caution given the modest sample size.
Finally, we explored the development of a preliminary risk score combining implantation depth and CFD-derived flow parameters, which stratified patients into 3 risk categories with progressively higher DRT incidence. While these initial results are promising, they remain exploratory and should be interpreted cautiously because of the small number of events. Importantly, this score was primarily conceived as a screening tool to identify patients at low risk of DRT, with the potential future aim of supporting de-escalation of antithrombotic therapy or reducing the need for follow-up imaging. Therefore, validation in larger studies will be needed before any potential clinical application can be determined.
If confirmed in larger cohorts, these findings may have implications for clinical practice, particularly in preprocedural planning. The use of CFD simulations could help anticipate the likelihood of deeper implantation and assist operators in planning strategies to achieve a more proximal and favourable position when anatomically feasible. In addition, CFD evaluation might also help identify patients in whom antithrombotic therapy could be potentially de-escalated. However, these potential applications remain exploratory and require further validation before they can be incorporated into routine practice.
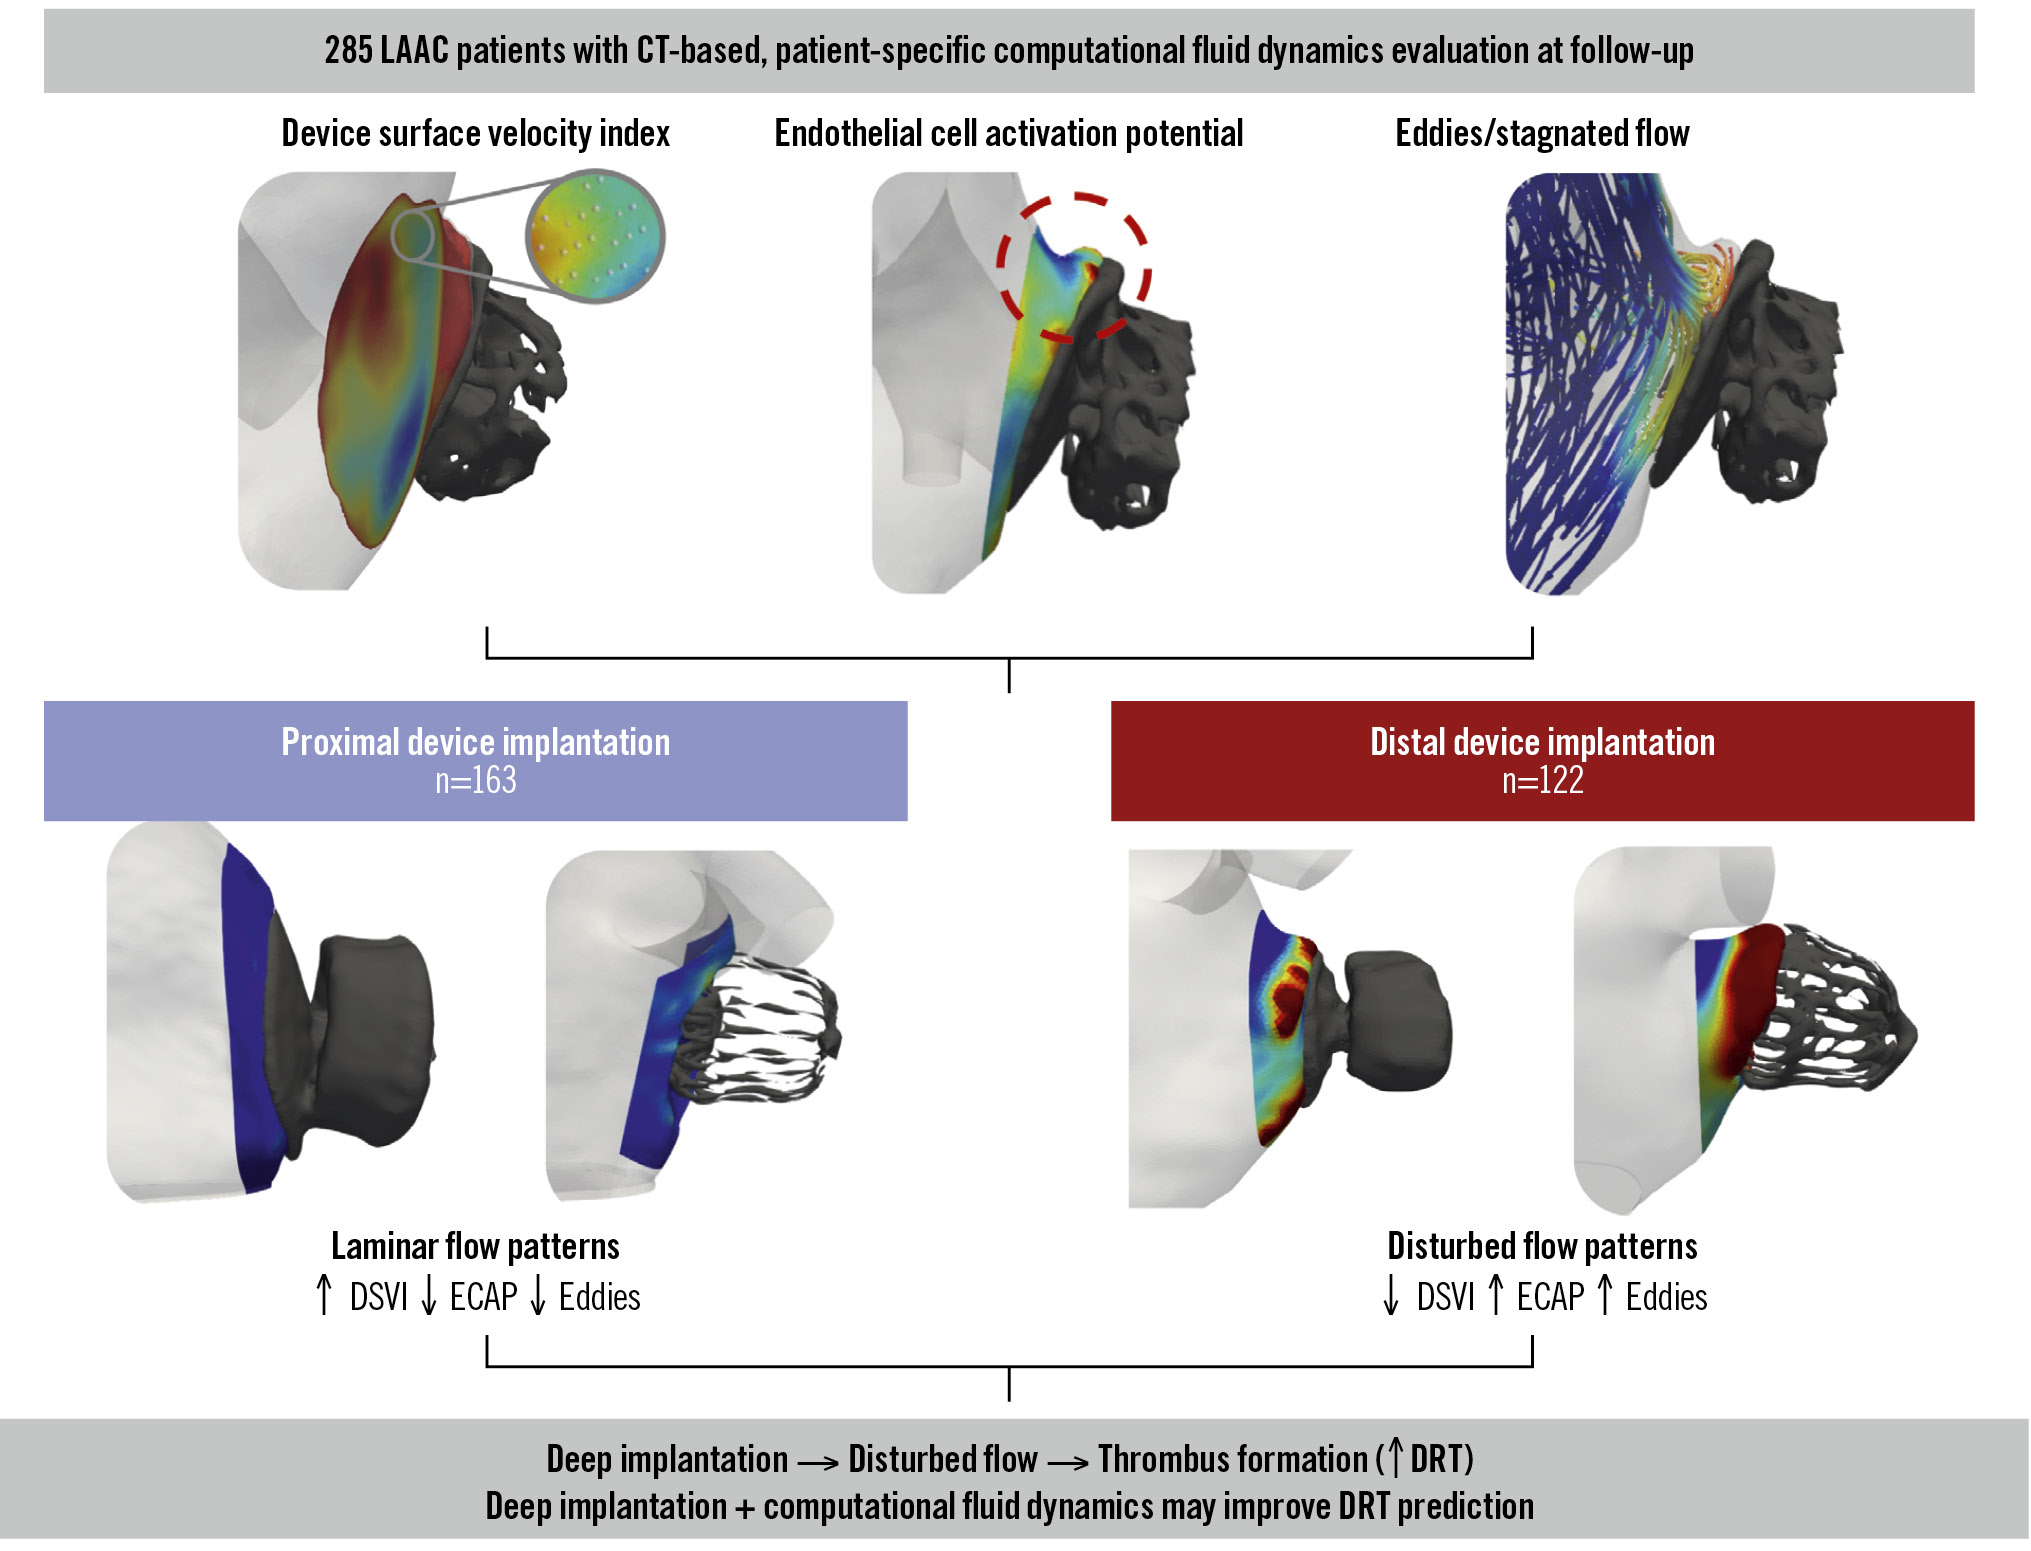
Central illustration. Impact of device implantation depth on blood flow dynamics after left atrial appendage closure: the IDEAL-LAAC study. Patient-specific computational fluid dynamics simulations based on follow-up cardiac computed tomography (CT) were used to assess the device surface velocity index (DSVI), endothelial cell activation potential (ECAP), and flow stagnation/eddies. Compared with proximal device implantation (n=163), distal implantation (n=122) was associated with disturbed flow patterns, including a lower DSVI, higher ECAP, and increased eddy formation. These adverse haemodynamic conditions were linked to a higher risk of device-related thrombus (DRT). LAAC: left atrial appendage closure
Limitations
Despite the significant findings of this study, several important limitations should be considered. First, the size of the DRT cohort was relatively small (n=29), which may limit the generalisability of the results. Second, the study relied on CFD simulations, which, although precise, depend on mathematical models that may not fully capture the complexity of actual human physiology. While simplifications are inherent to any modelling approach, incorporating real post-LAAC device configurations, patient-specific anatomical data, and physiologically representative atrial fibrillation boundary conditions in our simulations allowed meaningful estimations of the DRT risk associated with different device placements after LAAC. These findings highlight the potential for in silico modelling and digital twins to support personalised treatment planning in the future by enabling outcome prediction and device configuration optimisation. Third, concerning data analysis, while the ECAP and DSVI are deterministic, the analysis of swirling flow patterns involves a qualitative interpretative component. Although this was mitigated by using experienced readers, we acknowledge that a formal intra- and interreader reproducibility analysis was not performed. Nevertheless, readers were blinded to the presence or absence of DRT. Fourth, interobserver reproducibility for CT-based implantation depth measurements was not formally assessed. Measurements were performed locally by site investigators, and in cases of uncertainty, two expert readers reached a consensus classification. In addition, although the computational analysts were fully blinded to the presence of DRT, the lack of a formal reproducibility analysis may still introduce potential measurement variability. Furthermore, patients with peridevice leak ≥5 mm were excluded, which may limit the applicability of our findings to cases that are anatomically more complex. Finally, although the preliminary risk score results for predicting DRT are encouraging, the score has not undergone external validation, and its performance in independent and larger cohorts of consecutive patients remains unknown; thus, its clinical applicability should be considered exploratory.
Conclusions
The use of CFD simulations in patients undergoing LAAC demonstrated a clear relationship between distal implantation depth and abnormal flow patterns, which are associated with an increased risk of DRT. These findings emphasise the significant link between disturbed blood flow dynamics and thrombus formation. A preliminary DRT risk score based on CFD simulation characteristics shows promising potential, although further validation in larger cohorts is necessary.
Impact on daily practice
Device-related thrombus (DRT) remains a significant complication after left atrial appendage closure (LAAC), with deeper device implantation suggested as a possible risk factor. However, the mechanistic link between implantation depth, flow dynamics, and DRT risk has not previously been fully elucidated. This study demonstrates that deeper LAAC device implantation is associated with adverse local flow profiles – characterised by lower device surface velocity, higher endothelial activation, and increased flow stagnation – and a higher incidence of DRT, consistent across different device types. Future research should validate these findings in larger cohorts and explore strategies to optimise implantation depth, potentially incorporating flow dynamics, to reduce DRT risk and improve patient outcomes after LAAC.
Conflict of interest statement
A. Aminian is a proctor and consultant for Abbott and Boston Scientific. P. Garot received speaker/advisory fees from Abbott, Biosensors, Boston Scientific, Edwards Lifesciences, GE HealthCare, and Terumo; he serves as medical director and is a shareholder at the CERC (Cardiovascular European Research Center) in Massy, France. O. De Backer received institutional research grants and consulting fees from Abbott and Boston Scientific. J.E. Nielsen-Kudsk has received institutional grants from Abbott, Boston Scientific, and Conformal Medical. M. Barreiro-Perez received speaker/advisory fees from Abbott, Boston Scientific, and LifeTech Scientific. X. Iriart is a proctor and consultant for Abbott and Boston Scientific. R. Estevez-Loureiro is a consultant and proctor for Abbott, Edwards Lifesciences, Boston Scientific, Valgen, Jenscare, and Venus Medtech. L. Sanchis is a proctor for Abbott. J. Rodés-Cabau has an institutional research grant from Boston Scientific. X. Freixa is a proctor for Abbott. The other authors have no conflicts of interest to declare relevant to the contents of this paper.
Supplementary data
To read the full content of this article, please download the PDF.