Abstract
BACKGROUND: Left atrial appendage occlusion (LAAO) is performed increasingly, but long-term follow-up imaging data are lacking.
AIMS: The aim of this study was to evaluate the safety and durability of the Amplatzer Amulet device >4 years after LAAO.
METHODS: This was a prospective observational cohort study including 52 patients implanted with the Amplatzer Amulet device at Aarhus University Hospital, Denmark. A >4-year follow-up cardiac computed tomography (CT) scan after LAAO was performed and compared with the results from the 2-month and 12-month scans. The primary outcome was left atrial appendage (LAA) sealing based on distal LAA contrast patency and peridevice leakage (PDL), stratified into complete occlusion (grade 0 [G0]) and grade 1-3 leakage (G1-3), respectively. Secondary outcomes were low- and high-grade hypoattenuated thickening (HAT), device-related thrombosis (DRT) and device durability.
RESULTS: The median (interquartile range [IQR]) follow-up time from LAAO to the latest CT scan was 5.8 years (4.5; 6.3). At 2-month (n=52), 12-month (n=27) and >4-year CT follow-ups (n=52), rates of both complete occlusion (33%, 37%, 35%) and G2 leaks (52%, 52%, 48%) remained stable. Rates of G1 leaks varied (14%, 4%, 6%) and G3 leaks rose (2%, 7%, 12%) from earliest to latest follow-up. The median left atrial (LA) volume increased from 127 mL (96; 176) to 144 mL (108; 182) and 147 mL (107; 193). No DRT was found. The structural device integrity was preserved.
CONCLUSIONS: This study indicates a stable LAA sealing status throughout the follow-up period, emphasising the importance of the procedural result in avoiding PDL. Few patients displayed PDL progression, which might partly be related to LA remodelling with increasing volume. The long-term device durability appears excellent. Larger studies are warranted to confirm these findings.
In patients with atrial fibrillation (AF) who are unsuitable for long-term anticoagulation, percutaneous left atrial appendage occlusion (LAAO) is an established alternative for prevention of thromboembolic complications. The randomised PROTECT AF, PREVAIL and PRAGUE-17 trials demonstrated the efficacy of LAAO in preventing stroke and reducing the risk of bleeding123. However, data on long-term safety and late follow-up imaging beyond 12 months after LAAO are sparse45. Consequently, knowledge regarding long-term structural device durability, peridevice leakage (PDL), and device tissue overgrowth is very limited. Studies have indicated that the presence of PDL during the first year after implantation is dynamic in nature, with larger leaks less likely to regress, but questions about the natural development of PDL beyond 12 months remain unÂanswered67. Remodelling of the left atrium (LA) over time has been inÂÂsiÂnuated to possibly impact PDL. This could be explained by either the increased size of a pre-existing PDL or the occurrence of novel PDL due to dilatation and reshaping of the LA. Nevertheless, the main hypothesis is that PDL and incomplete device endothelialisation gradually decrease over time89.
Transoesophageal echocardiography (TOE) is the most widely used method for imaging following LAAO. Yet, cardiac computed tomography (CCT) has been suggested as a superior, non-invasive alternative to TOE for detecting both PDL and device-related thrombosis (DRT)7910. Utilising CCT, we sought to investigate the long-term safety and durability of the Amplatzer Amulet (Abbott) device by evaluating PDL, signs of device endothelialisation, and device integrity more than 4 years after LAAO.
Methods
STUDY DESIGN
In this single-centre, observational prospective cohort study, we included LAAO patients who had undergone successful implantation with the Amplatzer Amulet device between 2014 and 2019, allowing for a minimum follow-up period of 4 years. Patients with known renal insufficiency, i.e., an estimated glomerular filtration rate <30 mL/min, or known allergy to iodine contrast were excluded. The standard-of-care antithrombotic strategy at discharge consisted of single antiplatelet therapy (SAPT) for 6 months following the procedure. Patients with a history of previous percutaneous coronary intervention, acute myocardial infarction or ischaemic stroke continued with lifelong SAPT. This strategy could be escalated to either direct oral anticoagulants or dual antiplatelet therapy (DAPT), or expanded with vitamin K antagonist if deemed necessary by the attending cardiologist. Based on a total cohort of 415 LAAO patients, 185 (44.8%) were eligible for participation (Figure 1). The study enrolled 52 patients with available post-LAAO CT imaging data from 2-month and >4-year follow-ups (data available after 12 months, n=27). The 2-month follow-up CT scan is part of the routine follow-up after LAAO at Aarhus University Hospital, while the 12-month and >4-year follow-ups were for scientific purposes. The follow-up timeline is shown in the Central illustration.
A physical and electronic letter of invitation was sent out to all 185 eligible patients. On the day of CCT, a blood sample was drawn, and patients with an estimated glomerular filtration rate <30 mL/min were excluded. The study was approved by the regional ethics committee (1-10-72-115-22), and all patients provided informed consent prior to study participation.
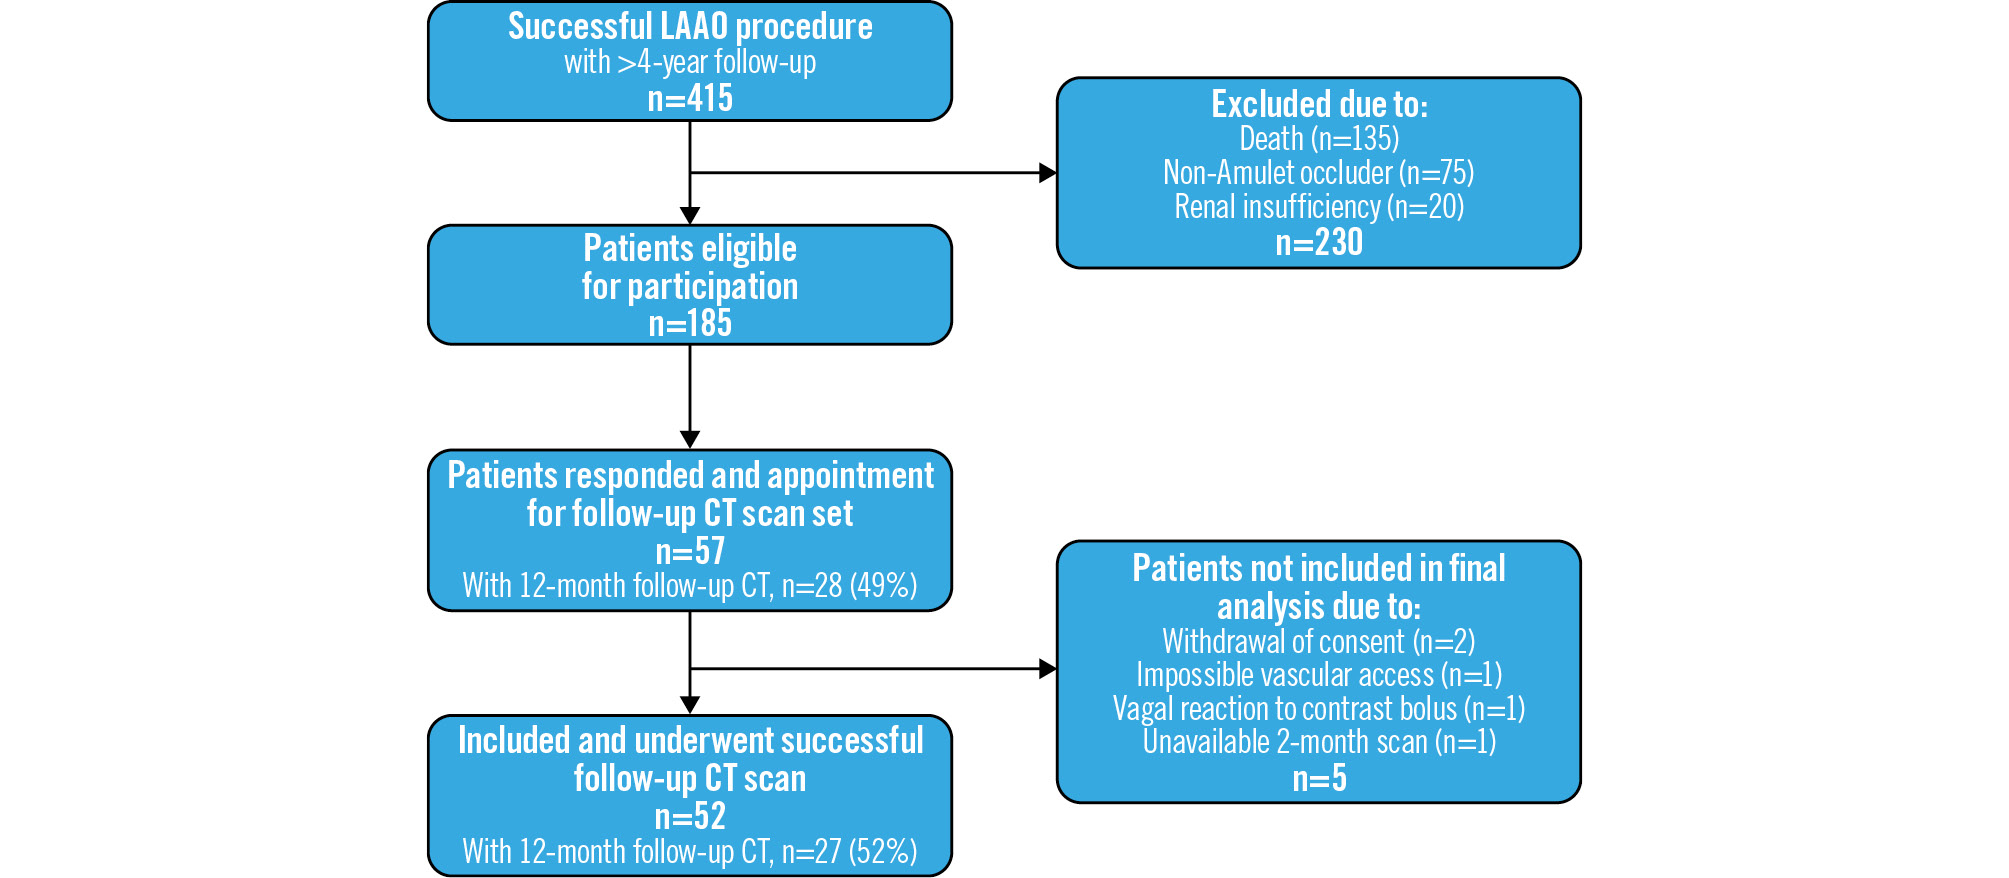
Figure 1. Flowchart of included patients. CT: computed tomography; LAAO: left atrial appendage occlusion
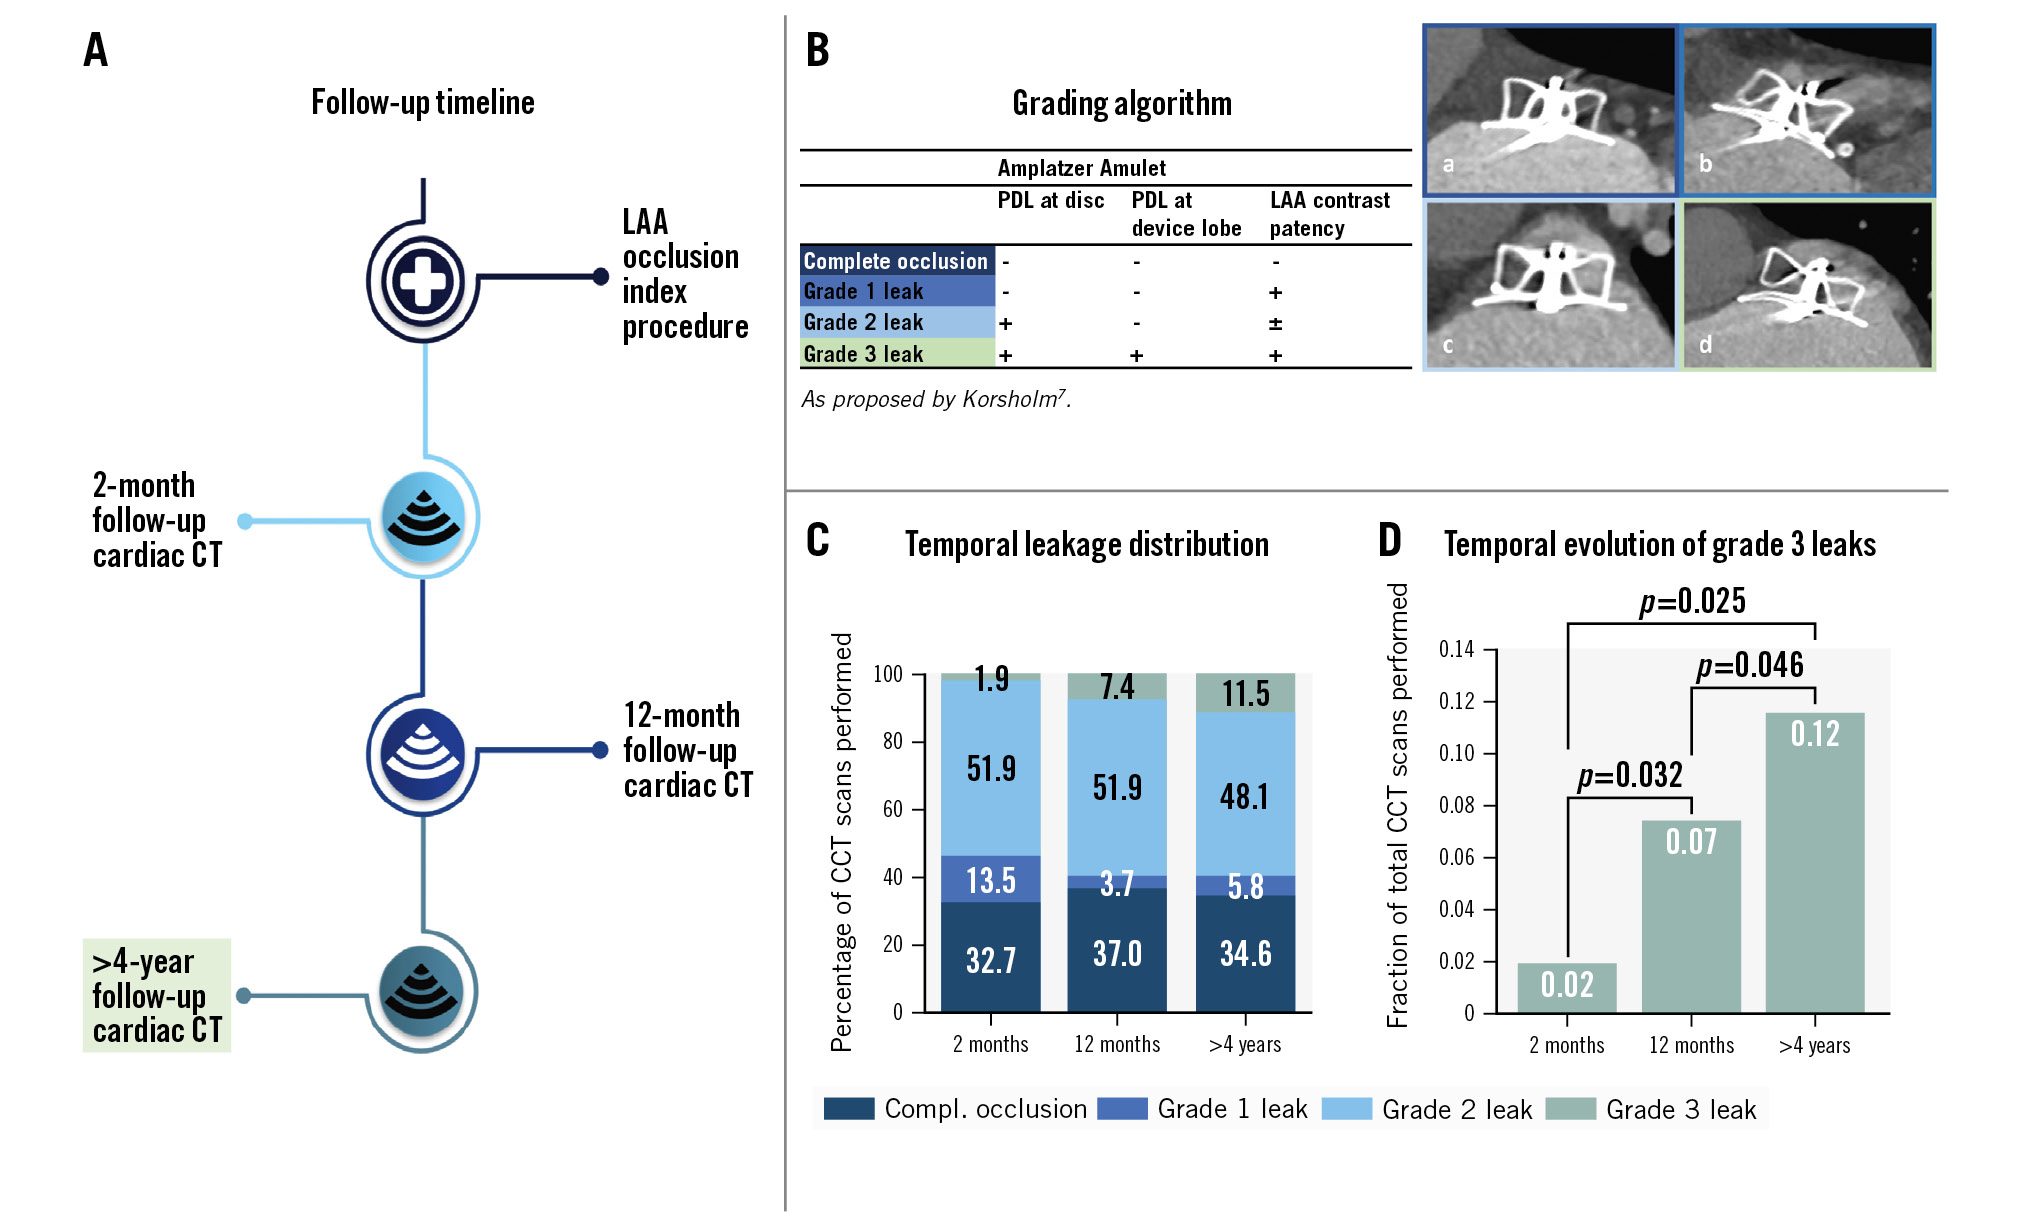
Central illustration. Patient cardiac CT scan timeline, key methods and main results. A) Follow-up timeline for cardiac CT; B) the grading algorithm used to evaluate leaks: (a) complete occlusion, (b) grade 1 leak, (c) grade 2 leak, (d) grade 3 leak; C) graph showing the temporal distribution of sealing status at 2 months (n=52), 12 months (n=27), and late follow-up (n=52); D) graph showing the temporal evolution of grade 3 leaks. CCT: cardiac computed tomography; CT: computed tomography; compl.: complete; LAA: left atrial appendage; PDL: peridevice leak
CARDIAC COMPUTED TOMOGRAPHY ACQUISITION
The acquisition protocol has previously been described in detail and was performed in accordance with current expert consensus7911. In short, CCT images were acquired using the SOMATOM Force scanner (Siemens Healthineers). A single prospective electrocardiogram (ECG)-gated high-pitch (FLASH) scan was performed, targeting a diastolic phase in the event of a heart rate <70 beats/min and a systolic phase in patients with a heart rate ≥70 beats/min, with tube voltages between 90 and 130 kV. Images were enhanced by a single iodine contrast injection (350 mg iodine/mL) followed by a 50 mL saline chaser, administered via an antecubital vein. The scanning protocol was similar throughout the study period. CCT images had a slice thickness of 0.75 mm, and a Bv40 kernel was used.
CARDIAC COMPUTED TOMOGRAPHY ANALYSIS
Images were analysed using the syngo.via imaging software (Siemens Healthineers). In a multiplanar reconstructed view, the axes were aligned with the disc and perpendicularly centred through the screw hub. All CCT scans were analysed by the same investigator. Inter-reader variability for CT analysis after LAAO has previously been demonstrated to be of sufficient to excellent quality1213. LA volume was estimated using the automatic segmentation of the Mimics Enlight 2.1 software (Materialise).
PERIDEVICE LEAK
PDL was classified according to previously described definitions (Central illustration)7. In short, PDL was categorised in ascending order as either complete occlusion (grade 0; G0), distal left atrial appendage (LAA) contrast without a visible PDL (grade 1; G1), isolated disc-level PDL (grade 2; G2), or concomitant disc- and lobe-level PDL (grade 3; G3). Any contrast gap adjacent to the device was interpreted as PDL, and the area and position were reported in anatomical and clock-face position intervals from an en face perspective. The device lobe was analysed at proximal, mid, and distal levels. A continuous trail of contrast through all 3 sections was interpreted as device lobe PDL. PDL dimensions and area were measured in a cross-sectional en face view of the device. Each PDL’s short axis was reported by measuring the distance from the device edge to the most peripheral point of the PDL in a line perpendicular to the device. Moreover, each PDL’s long axis was measured between the horizontal extremities of the PDL in relation to the device crest. The PDL area was reported by outlining the entire defect in the cross-sectional view. Any possible G3 PDL was analysed and discussed among 3 expert physicians, before reaching a consensus.
Contrast patency in the LAA was evaluated based on the Hounsfield units (HU) measured distal to the implanted device and in the LA. An LAA to LA ratio>0.25 or LAA HU >100 distal to the device was defined as contrast patency.
Lastly, the radial position of leaks at disc level were reported in clock-face position intervals from an en face perspective.
HYPOATTENUATED THICKENING
Hypoattenuated thickening (HAT) and DRT on the atrial device surface were evaluated and classified in accordance with a previously proposed algorithm9. In summary, depending on the morphology and extent of the HAT covering the atrial device surface, it was classified as low- or high-grade HAT. Any HAT was reported by visually identifying low-intensity contrast regions on the atrial side of the disc in a cross-sectional view. After identification of HAT, the plane of view was adjusted, allowing the axis to run in parallel with the surface hypoattenuation. The extent of HAT on the long and short axes, as well as the height and area of the HAT, were measured and reported. In accordance with the suggested algorithm, high-grade HAT was characterised by a height ≥3 mm and/or pedunculated morphology. High-grade HAT was interpreted as DRT, while low-grade HAT was considered device endothelialisation.
DEVICE DURABILITY
Device durability was evaluated by visual inspection of the structural composition of the device. Irregularities, such as collapse and device fracture, were interpreted as loss of structural device integrity. Additionally, device compression was calculated using the minimum lobe diameter divided by the implanted device size. Large temporal deviations could indicate possible damage or degradation of the device and would warrant further investigation.
CLINICAL OUTCOMES
By means of a unique personal identification number assigned to all Danish citizens, public healthcare information is linked to an electronic patient file. Examining the files of included patients, all postprocedural events of ischaemic stroke, transient ischaemic attack and systemic embolism were identified and reported.
STATISTICAL ANALYSIS AND POWER
Sample size estimation was based on previously reported rates of PDL at 2- and 12-month follow-ups8. In that study, the prevalence of contrast patency of the LAA was 66% at 2 months and 47% at 12 months. A visible PDL was present in 67% and 61% of patients at 2 and 12 months. A total of 46 patients were needed to achieve 80% power with a 2-sided significance level of 0.05 and to detect a delta of −11% with an assumed correlation between paired observation of 0.9.
Distributions were determined using Q-Q plots and histograms. Continuous data were presented with mean and standard deviation (SD) or median and interquartile ranges (IQR) as appropriate. Categorical data were presented as absolute frequencies or numbers and percentages. Unpaired data were compared using a t-test or χ2 test, while non-Âparametric paired data were analysed by McNemar’s test, and for non-Âparametric unpaired data, the Wilcoxon rank-sum test was used. A 2-tailed p-value<0.05 was considered significant. All analyses were carried out using Stata SE, version 17 (StataCorp).
Results
PATIENT CHARACTERISTICS
Of the 185 patients eligible for participation, a total of 52 (28.1%) patients were included in the final analyses (Figure 1). Of the included patients, 52/52 (100%) had a 2-month follow-ÂÂup scan, and 27/52 (51.9%) had a 12-month scan available. The mean±SD age at the time of the LAAO procedure was 70.7±7.0 years, and the mean±SD follow-up time from LAAO to last imaging follow-up was 5.7±1.2 years (Table 1). Patients had a median (IQR) heart rate when scanned of 69 (55; 84), 59 (55; 78) and 69 (57; 80) beats per minute at 2-month, 12-month, and >4-year follow-ups, respectively. The median (IQR) relative change in LA volume between the 2-month and 12-month follow-up was 3.0% (−4.7; 9.0), and 12.4% (4.6; 23.8) between the 2-month and >4-year follow-up (Supplementary Figure 1). At discharge, 43/52 (82.7%) patients were treated with SAPT, while 9/52 (17.3%) received DAPT. At >4-year follow-up, the distribution of antiÂthrombotic treatment was as follows: 25/52 (48.1%) on SAPT, 22/52 (42.3%) on no antithrombotic treatment, 3/52 (5.8%) on apixaban, 1/52 (1.9%) on rivaroxaban and 1/52 (1.9%) on combined warfarin and acetylsalicylic acid.
Table 1. Baseline characteristics, follow-up and clinical outcomes.
| Baseline information | n=52 |
|---|---|
| Age at LAAO, years | 70.7±7.0 |
| Female | 16 (31) |
| BMI, kg/m2 | 26.7±5.0 |
| CHA2DS2-VASc | 3.5±1.5 |
| HAS-BLED | 3.1±1.1 |
| eGFR, mL/min | 74.2±13.4 |
| Type of AF | |
| Paroxysmal | 22 (42) |
| Persistent | 5 (10) |
| Permanent | 25 (48) |
| Primary indication for LAAO | |
| Intracranial haemorrhage | 13 (25) |
| Gastrointestinal bleed | 5 (10) |
| Urogenital bleed | 3 (6) |
| Spontaneous bleed | 8 (15) |
| Cerebral amyloid angiopathy | 3 (6) |
| Stroke on oral anticoagulants | 4 (7) |
| High bleeding risk | 11 (21) |
| Other | 5 (10) |
| Size of implanted device, mm | 25 [22; 28] |
| Orifice shape of LAA | |
| Oval | 42 (81) |
| Triangular | 0 (0) |
| Foot-like | 7 (13) |
| Water drop | 0 (0) |
| Round | 3 (6) |
| LAA morphology | |
| Chicken-wing | 24 (46) |
| Cactus | 14 (27) |
| Windsock | 12 (23) |
| Cauliflower | 2 (4) |
| Implantation technique | |
| Traditional | 29 (56) |
| Sandwich | 5 (10) |
| Semi-sandwich | 18 (35) |
| Thromboembolic events | |
| Ischaemic stroke | 3 (6) |
| TIA | 3 (6) |
| Systemic emboli | 0 (0) |
| Time from LAAO to stroke, years | 0.69 (0.23-3.64) |
| Time from LAAO to TIA, years | 1.22 (0.02-3.60) |
| Follow-up time, years | 5.7±1.2 |
| Values are presented as mean±SD, n (%), median [IQR] or mean (range). AF: atrial fibrillation; BMI: body mass index; eGFR: estimated glomerular filtration rate; IQR: interquartile range; LAA: left atrial appendage; LAAO: left atrial appendage occlusion; SD: standard deviation; TIA: transient ischaemic attack | |
PERIDEVICE LEAKAGE
Complete occlusion (G0) was stable over time, with rates of 32.7%, 37.0% and 34.6% at 2-month, 12-month and late follow-ups, respectively. The same applied to grade 2 PDL (G2), with rates of 51.9% (2 months), 51.9% (12 months) and 48.1% (latest) (Central illustration). The frequency of grade 3 PDL (G3) increased from 1.9% (n=1) at 2-month follow-ÂÂup to 7.4% (n=2) and 11.5% (n=6) at 12-month and late follow-ups, respectively. The fractional increase in G3 PDL from 2-month to late follow-up was statistically significant (p=0.025) (Central illustration).
The PDL area varied over time from a median (IQR) PDL area at disc level of 63 mm2 (21; 142) at 2 months to 76 mm2 (37; 162) at 12 months and 49 mm2 (26; 183) at the time of the latest CT follow-up. The G3 leaks had a median (IQR) mid-lobe PDL area of 182 mm2 , 157 mm2 (145; 169) and 154 mm2 (131; 184) from earliest to latest follow-up (Table 2, Table 3).
The disc PDL was located in the inferoposterior position in 26/31 (83.9%) cases, typically corresponding to a 2 to 3 o’clock position on the clock face (Figure 2). In patients with G3 PDL, 5/6 (83.3%) disc PDL were located in the inferoÂposterior position and were considered secondary to a misaligned device in 5/6 (83.3%) cases. Meanwhile, 4/6 (66.7%) patients with G3 PDL had chicken-wing anatomy in which either a semi-sandwich (3/6) or sandwich closure (1/6) technique was used (Figure 3).
Table 2. Temporal evolution of peridevice leak, hypoattenuated thickening, device and LAA characteristics.
| 2 months (n=52) | 12 months (n=27) | Late, >4 years (n=52) | |
|---|---|---|---|
| PDL classification | |||
| Complete occlusion | 17 (33) | 10 (37) | 18 (35) |
| Grade 1 leak | 7 (13) | 1 (4) | 3 (6) |
| Grade 2 leak | 27 (52) | 14 (52) | 25 (48) |
| Grade 3 leak | 1 (12) | 2 (7) | 6 (12) |
| Position of PDL at disc (multiple possible) | |||
| Inferior | 18 (35) | 11 (41) | 19 (37) |
| Superior | 7 (13) | 4 (15) | 2 (4) |
| Posterior | 21 (40) | 12 (44) | 26 (50) |
| Anterior | 8 (15) | 5 (19) | 5 (10) |
| Disc PDL area, mm2 | 63 [21; 142] | 76 [37; 162] | 49 [26; 183] |
| Mid-lobe PDL area, mm2 | 182 (NA) | 157 [145; 169] | 154 [131; 184] |
| LA volume, mL | 127 [96; 176] | 144 [108; 182] | 147 [107; 193] |
| Relative LA volume change from 2 months, % | - | 3.0 [−4.7; 9.0] | 12.4 [4.6; 23.7] |
| Relative device compression, % | 4 [0; 7] | 5 [0; 11] | 4 [0; 8] |
| Axis alignment | |||
| Perpendicular to the neck | 28 (54) | 15 (56) | 23 (44) |
| Off-axis | 24 (46) | 12 (44) | 29 (56) |
| Device shape at lobe level | |||
| Oval | 9 (17) | 4 (15) | 7 (13) |
| Round | 43 (83) | 23 (85) | 45 (87) |
| Hypoattenuated thickening | |||
| Degree of HAT | |||
| No HAT | 46 (88) | 17 (63) | 31 (60) |
| Low-grade HAT | 6 (12) | 10 (37) | 21 (40) |
| High-grade HAT | 0 (0) | 0 (0) | 0 (0) |
| HAT development | |||
| Newly formed since last available CCT | 6/6 (100) | 9/10 (90) | 14/21 (67) |
| Continuous since last available CCT | - | 1/6 (17) | 7/13 (54) |
| Resolved since last available CCT | - | 2/6 (33) | 6/13 (46) |
| HAT area, mm2 | 109 [95; 121] | 127 [90; 205] | 52 [39; 82] |
| TOE measurements | |||
| TOE performed | 49/52 (94) | 0/52 (0) | 0/52 (0) |
| Follow-up time, days | 50 [48; 56] | - | - |
| Peridevice leak | |||
| Leak ≤3 mm | 12/49 (25) | - | - |
| Leak >3 mm | 4/49 (8) | - | - |
| Device-related thrombosis | 0/49 (0) | - | - |
| Amplatzer Amulet stability signs | |||
| Lobe oriented perpendicular to neck | 42/49 (86) | - | - |
| Concavity of disc | 47/49 (96) | - | - |
| Separation of disc and lobe | 44/49 (90) | - | - |
| Midpoint of lobe distal to Cx | 48/49 (98) | - | - |
| Values are presented as n (%), n/N (%) or median [IQR]. CCT: cardiac computed tomography; Cx: circumflex artery; HAT: hypoattenuated thickening; IQR: interquartile range; LA: left atrial; LAA: left atrial appendage; NA: not available; PDL: peridevice leak; SD: standard deviation; TOE: transoesophageal echocardiography | |||
Table 3. Grade 0-1 (no PDL) versus grade 2-3 (PDL) at late follow-up.
| Variable | No PDL, G0-G1 (n=21) | PDL, G2-G3 (n=31) | p-value |
|---|---|---|---|
| Age at LAAO, years | 70.4±8.4 | 71.0±6.0 | 0.77 |
| Female | 7 (33) | 9 (29) | 0.74 |
| BMI, kg/m2 | 27.0±4.5 | 25.9±3.9 | 0.36 |
| Type of AF | 0.14 | ||
| Paroxysmal | 9 (43) | 13 (42) | |
| Persistent | 4 (19) | 1 (3) | |
| Permanent | 8 (38) | 17 (55) | |
| LAA morphology | 0.71 | ||
| Chicken-wing | 10 (47.6) | 14 (45.2) | |
| Cactus | 4 (19.0) | 10 (32.2) | |
| Windsock | 6 (28.6) | 6 (19.4) | |
| Cauliflower | 1 (4.8) | 1 (3.2) | |
| Orifice shape | 0.53 | ||
| Oval | 17 (81) | 25 (81) | |
| Triangular | 0 (0) | 0 (0) | |
| Foot-like | 2 (10) | 5 (16) | |
| Water drop | 0 (0) | 0 (0) | |
| Round | 2 (10) | 1 (3) | |
| Maximum orifice diameter, mm | 28.5±7.1 | 32.4±4.8 | 0.011 |
| Landing zone area, mm2 | 283±96 | 391±152 | 0.005 |
| Size of implanted device, mm | 25 [20; 25] | 25 [22; 28] | 0.076 |
| Implantation technique | 0.99 | ||
| Traditional implantation | 12 (57) | 17 (55) | |
| Sandwich technique | 2 (10) | 3 (10) | |
| Semi-sandwich technique | 7 (33) | 11 (35) | |
| Device lobe position at the LZ | 0.001 | ||
| Perpendicular | 15 (71) | 8 (26) | |
| Off-axis | 6 (29) | 23 (74) | |
| Device compression, % | 5 [4; 10] | 3 [0; 6] | 0.019 |
| Left atrial volume, mL | 134 [95; 186] | 151 [118; 199] | 0.28 |
| Thromboembolic events | 0.053 | ||
| Ischaemic stroke | 2 (10) | 1 (3) | |
| TIA | 3 (14) | 0 (0) | |
| Systemic emboli | 0 (0) | 0 (0) | |
| Values are presented as mean±SD, n (%) or median [IQR]. AF: atrial fibrillation; BMI: body mass index; G: grade; IQR: interquartile range; LAA: left atrial appendage; LAAO: left atrial appendage occlusion; LZ: landing zone; PDL: peridevice leak; SD: standard deviation; TIA: transient ischaemic attack | |||
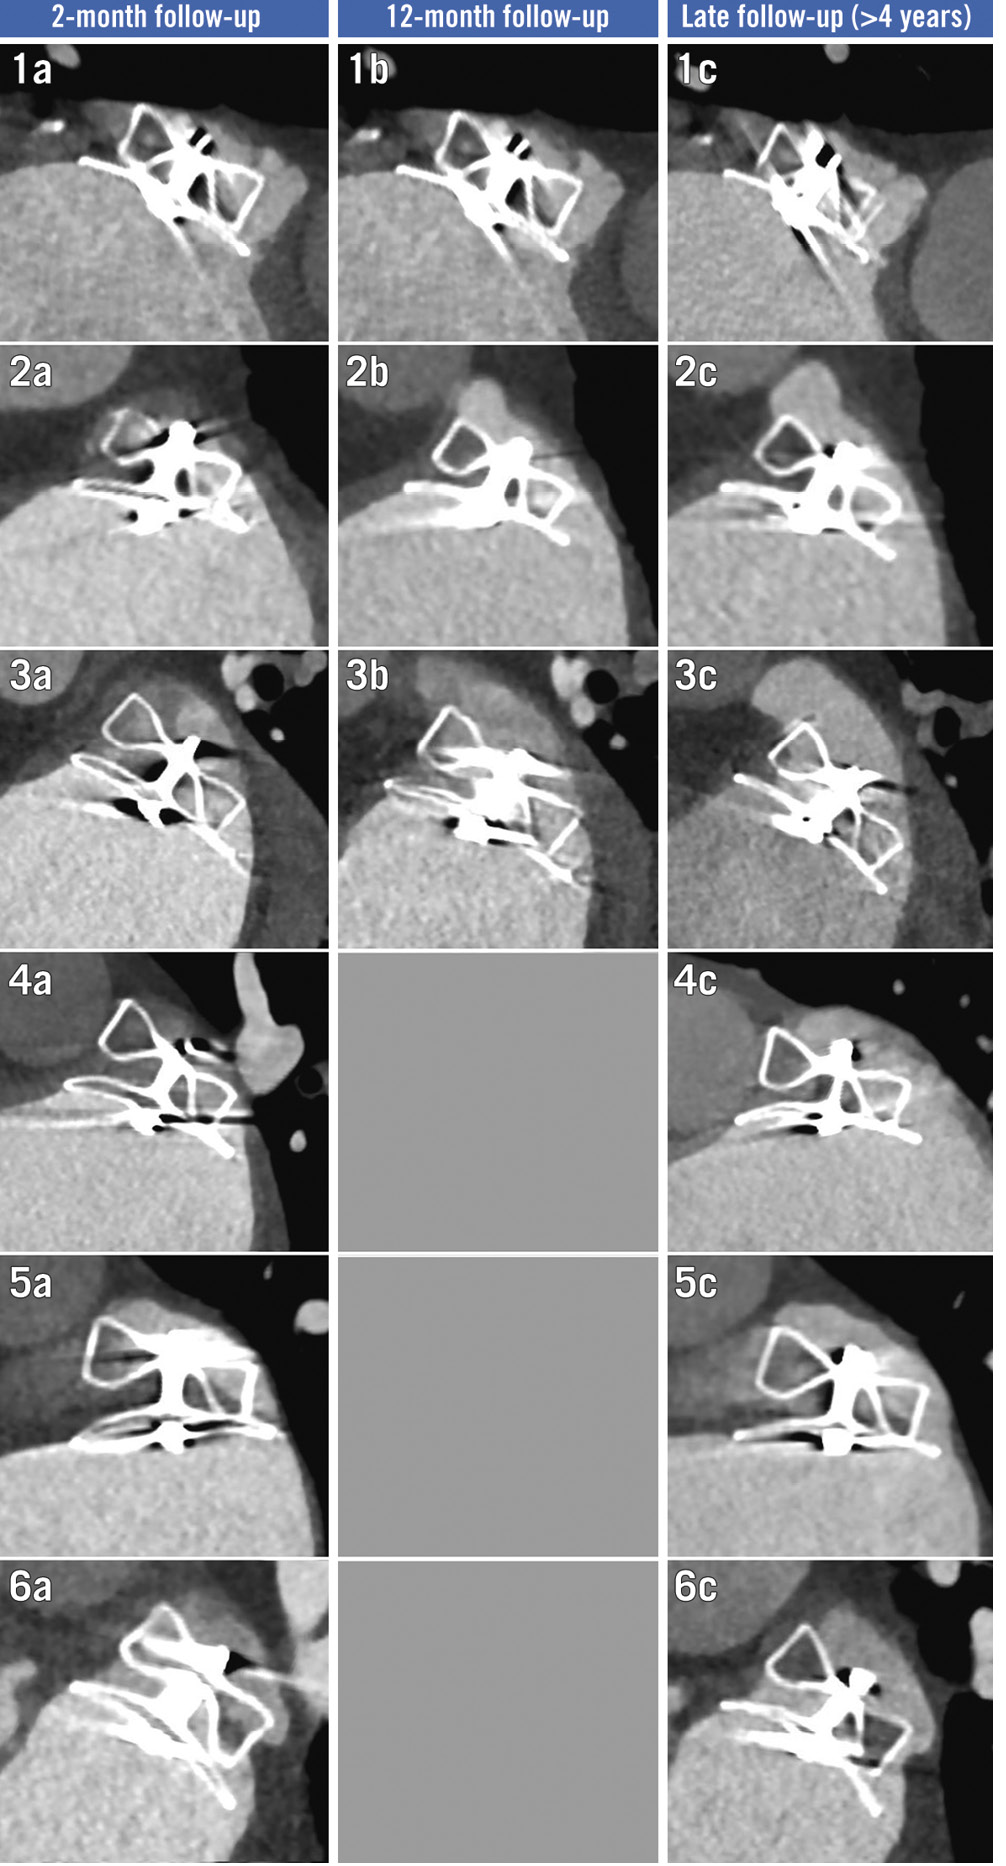
Figure 3. Temporal evolution of six grade 3 leaks identified at late follow-up. Temporal evolution of cardiac CT scans for all cases (n=6) of grade 3 leaks identified at late follow-up. CT: computed tomography
HYPOATTENUATED THICKENING
The number of patients with observed low-grade HAT increased from 6/52 (11.5%) to 21/52 (40.4%) (p=0.0011) between 2-month and >4-year follow-up, respectively. However, percentages remained largely unchanged between 12-month (37.0%) and >4-year follow-up (40.4%). Of the 6 patients displaying low-grade HAT at 2-month follow-up, 4/6 (66.7%) had resolution at the next available CCT scan. HAT was newly formed in 9/10 (90%) cases at 12-month follow-up and 14/21 (66.7%) at >4-year follow-up (Table 2, Supplementary Figure 2).
No cases of DRT were observed.
DEVICE DURABILITY
Visual inspection revealed no structural damage to any of the analysed devices or surrounding tissue. The median (IQR) size of implanted devices was 25 mm (22; 28). The relative compression of the device lobe remained unchanged with a median (IQR) compression of the implanted device size of 4.0% (0.0; 7.1), 4.5% (0.0; 10.7) and 4.0% (0.0; 8.0) at 2-month, 12-month and latest follow-up, respectively (Table 2).
CLINICAL OUTCOMES
Following the index procedure, 3/52 (5.8%) patients suffered an ischaemic stroke and 3/52 (5.8%) experienced a transient ischaemic attack (TIA), while no cases of systemic embolism were reported. The time from LAAO to event was 0.69 (0.23-3.64) years for patients suffering ischaemic stroke and 1.22 (0.02-3.60) years for the TIA patients (Table 1). At the time of ischaemic stroke or TIA, 1/6 (16.7%) had a G1 leak and 1/6 (16.7%) had a G2 leak, while the remaining patients had complete occlusion. For stroke patients, no HAT was visible on the last available CCT before ischaemic stroke events. However, 2/3 (66.7%) TIA patients had visible low-grade HAT on the last available CCT prior to TIA.
Discussion
This study is the first to examine the long-term safety and durability of the Amulet device with CCT follow-up of a minimum of 4 years after implantation. The main findings are a stable LAA sealing status, a temporal increase in HAT with no observed change in the frequency of DRT, and excellent long-term device durability.
PERIDEVICE LEAKAGE
Follow-up imaging studies have not found a definite trend regarding PDL development, describing both progression and regression over time468. Larger PDL appear less likely to regress over time, but the follow-up time in most of those studies was restricted to around 12 months. Apart from a single follow-up study, which utilised TOE imaging after a median of 3.1 years from implantation, no long-term imaging studies exist on LAAO to our knowledge4. In our study, the prevalence of PDL did not appear to decline over time. An overall stable PDL distribution was observed, apart from a few patients who displayed a progression in their PDL status (Figure 4). Likewise, the median PDL area at the mid-lobe and disc level were relatively stable over time, though the results’ relevance may be weakened by the low participant count (Table 2).
Large PDL early after LAAO will rarely seal up over time6. Bridging a large gap between the device and the LAA wall is likely not possible for endothelial cells. This speculation is supported by the Sankey plot, showing only a single G2 leak being downgraded to a G0/G1 leak (Figure 4). Consequently, a large, early PDL will most likely also be present at later times, potentially leaving strategies such as repeated imaging analysis redundant. Early action may be required for optimal treatment; however, the ideal management of PDL remains unknown and needs to be examined adequately in future studies. Also, procedural and early follow-up results are of great long-term importance. Hence, to prevent PDL, enhancing an operator’s abilities to avoid PDL during implantation is paramount. Accordingly, preprocedural CT, device improvements and steerable sheaths increase implantation success significantly1415.
Theoretically, LA remodelling with an increase of LA volume over time could exacerbate pre-existing PDL, due to an incommensurate device-LAA wall connection16. In this study, the median LA volume increase from 2-month to latest follow-up was 12%. With the LA volume ranging from 62 mL to 372 mL at 2-month follow-up, and thus the expected changes in volume corresponding in size, the relative change may be the more pertinent approach to determine the development in the cohort. Additionally, changes in LA volume related to systolic and diastolic phases should be kept in mind; however, the inherent effects of AF may partly mitigate this concern.
When compared to TOE, previous studies have demonstrated that CCT has superior sensitivity regarding PDL detection and is also less operator dependent1718. In this study, the CCT scans were acquired using a FLASH protocol capturing one momentary image in the cardiac cycle. This acquisition strategy may have influenced the interpretation and classification of PDL, due to potential device movement possibly going unnoticed. Furthermore, variations in CT acquisition timepoints during the ECG-defined R-R interval may theoretically affect the PDL size or the ability to detect (micro)channels around the disc or lobe. With an intrapatient median delta R-R of 13% of the cardiac cycle, we anticipate that differences in acquisition timepoints were not a major determinant of study results.
A definite consensus on PDL mechanisms is missing. Alkhouli et al proposed a variety of options, while substantiating the clinical relevance regarding thromboembolic complications19. Here, both transfabric leakage and PDL have been suggested as possibilities. In the present study, a consistent inferoposterior appearance of disc PDL (G2, G3) was observed, which could be explained by systematic PDL emergence. While this study is not able to verify the reasons for the primarily inferoposterior PDL position, variables such as axis misalignment, LAA anatomy and implantation technique may play important roles in PDL development. Of note, other studies found a similar spatial PDL distribution720.
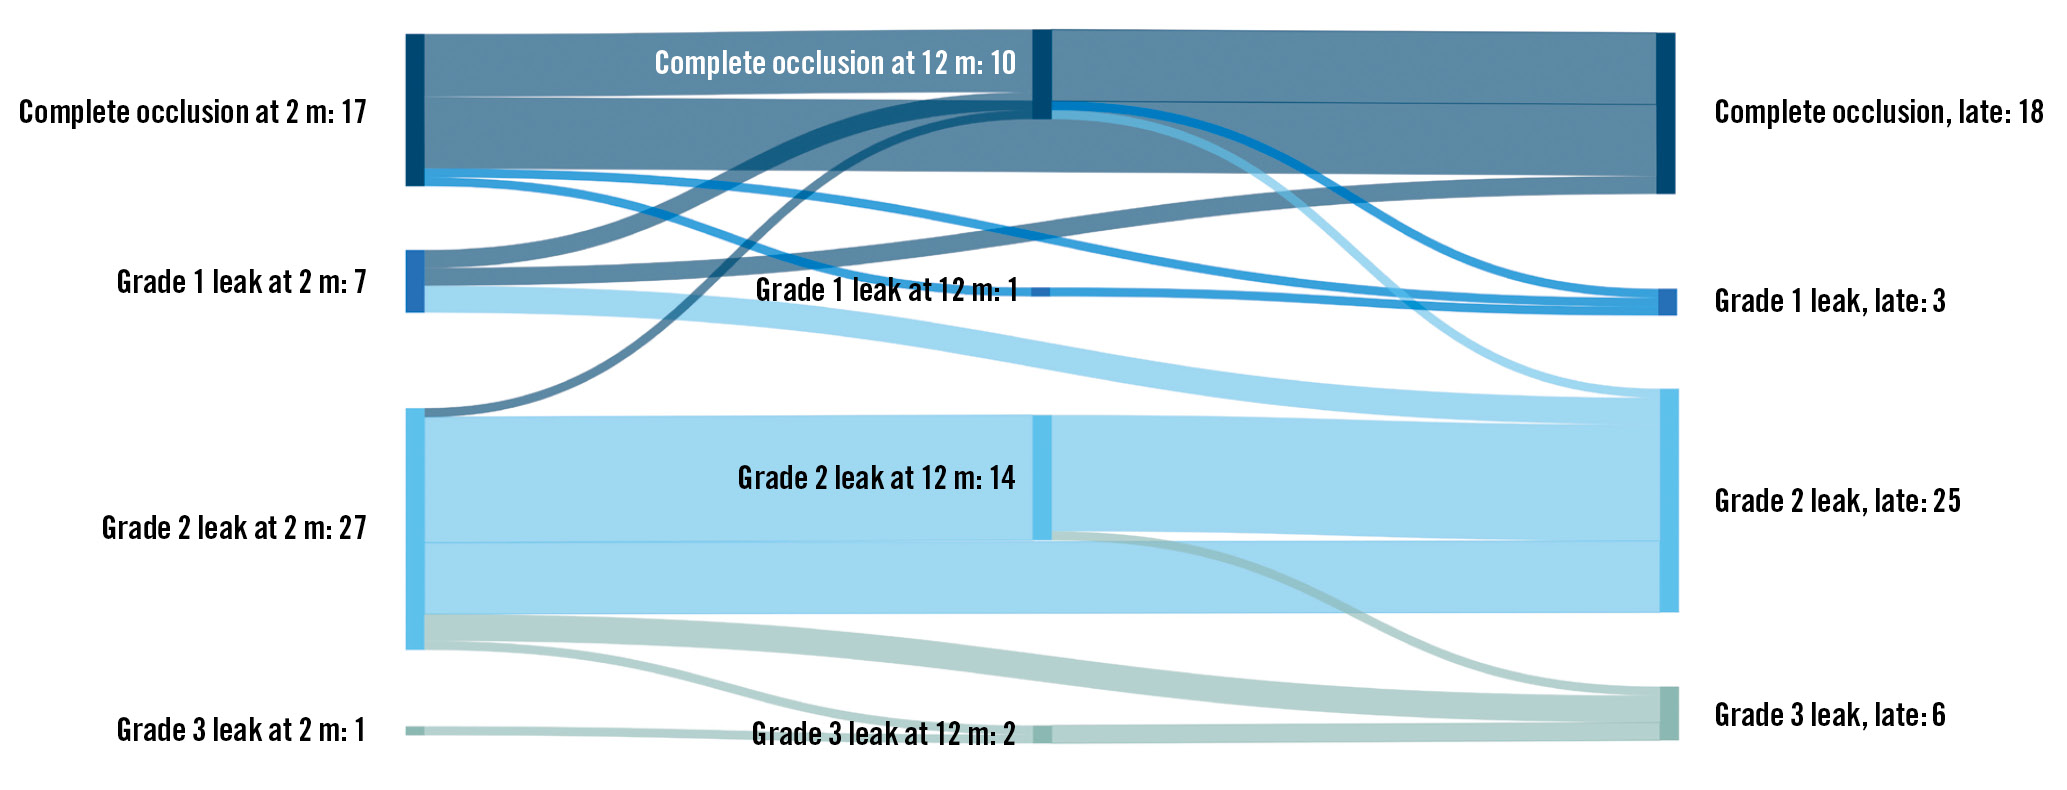
Figure 4. Sankey plot showing the temporal sealing status distribution. Sankey plot shows temporal sealing status at follow-up timepoints. The lines indicate the progression or regression of leaks between timepoints. m: months
HYPOATTENUATED THICKENING AND DEVICE-RELATED THROMBOSIS
No cases of DRT were observed in our cohort. The absence of DRT may partially be caused by the relatively low number of participants. Other studies have found an incidence of DRT between 3 and 4%, and a decreased but persisting risk for DRT occurrence beyond 365 days has been reported2122.
Interestingly, the proportion of patients with low-grade HAT more than tripled from 6 (11.5%) to 21 (40.4%) from the 2-month to late follow-up. This might suggest the development of benign endothelialisation across the Amulet surface and is in line with previous findings, where a relative increase of patients with HAT over time was observed7.
The possibility of the thin endothelial layer not being visualised properly on CCT and, thus, underestimation of HAT must be considered. Challenges in the recognition of HAT might be partially remedied in the future with higher-Âresolution photon-counting CT.
The high proportion of patients with HAT resolution and newly formed HAT between scans may indicate a temporary and dynamic evolution of the coverage on the atrial surface of the device (Table 2). It likely includes fibrin aggregation and platelet formation, which may be more visible on CCT than a thin layer of endothelial cells after possible overgrowth. Nevertheless, low-grade HAT is assumed to be benign in nature on the grounds that the thin layer of endothelial cells seals the transition area between the LAA and the device crest23. This overgrowth could inhibit DRT formation on the foreign nitinol mesh, prevent PDL and contribute to a complete seal of the LAA.
DEVICE DURABILITY
No visual signs of device degradation were noted. Furthermore, device compression was stable during follow-up. Interestingly, we found a median lobe compression rate of 4-5% throughout the follow-up period, as opposed to ~10% that was reported in other studies420. The compression rate may be associated with PDL, supporting the importance of device oversizing during implantation. While the lack of findings regarding device erosion and/or degradation could be attributed to a survivor bias, to our knowledge, no cases with device fracture or erosion have been reported. Furthermore, as prior studies have shown, cause of death is rarely attributed to device-related factors and is mainly driven by non-cardiac reasons242526. This supports the argument of the outstanding durability of the Amulet device and a low degree of interference with the surroundings.
Nevertheless, our data seem to contradict the assumption that the device conforms to the LAA and rather indicate that the LAA conforms to the device. This is supported by the low compression rate and high degree of circular device lobes observed after 2 months and throughout follow-up, compared to the primarily oval LAA orifice shape prior to implantation (Table 1, Table 2).
Limitations
This study holds several limitations. Being a single-centre study with only one device – the Amplatzer Amulet − included, the ability to extrapolate the present results to other devices or patient categories may be limited. Furthermore, the algorithm used for analysis of the sealing performance into G0-G3 leaks is descriptive and has not yet been verified for prognostic use. A similar limitation is related to durability. Until now, a consensus on durability evaluation has not been formulated. Moreover, this is a study with 52 included patients out of 185 eligible patients. Owing to the nature of our recruitment process, selection and healthy volunteer and survivor bias cannot be ruled out. As several studies have displayed a connection between PDL, DRT and thromboembolic complications, an underestimation of clinical outcomes and overestimation of the sealing performance is a definite possibility.
Lastly, the relatively low number of participants have partly hindered adjusted statistical analyses, except for PDL and contrast patency, which this study was powered for.
Conclusions
This study suggests that PDL prevalence and size remain stable over the long term, with only few patients exhibiting PDL aggravation and no trend towards PDL regression, thus highlighting the importance of the immediate procedural outcome. The observed increase in frequency of low-grade HAT over time may indicate continued endothelialisation beyond 2 months. Finally, long-term device durability was maintained in all patients, although the sample size restrictions and likely rare occurrence of device failure warrant larger, prospective studies to confirm these findings.
Impact on daily practice
The results presented in this paper support the left atrial appendage occlusion (LAAO) approach as a viable long-term treatment for atrial fibrillation. The data indicate, contrary to what has been the belief so far, that peridevice leak frequency and size are stable over the long term and rarely seal up or progress even during follow-up >4 years, and thus, highlight the importance of the immediate procedural outcome. Importantly, our results support the long-term safety and durability of the Amplatzer Amulet LAAO device.
Conflict of interest statement
K. Korsholm has received speaker honoraria from Abbott and Boston Scientific; he has received an unrestricted institutional grant from Boston Scientific. J.E. Nielsen-Kudsk has received institutional grants from Abbott and Boston Scientific. The other authors have no conflicts of interest to declare.
Supplementary data
To read the full content of this article, please download the PDF.