Cory:
Unlock Your AI Assistant Now!
Abstract
BACKGROUND: The 12-month outcomes of BIOMAG-I − the first-in-human study investigating the third-generation drug-eluting resorbable magnesium scaffold (DREAMS 3G) − showed promising results regarding clinical outcomes and late lumen loss.
AIMS: The current study aimed to investigate vascular healing parameters assessed by optical coherence tomography (OCT) and intravascular ultrasound (IVUS), focusing on strut visibility, vessel and scaffold areas, and neointimal growth patterns.
METHODS: This is a BIOMAG-I substudy including patients with available serial OCT and IVUS data. We conducted a frame-based analysis of OCT findings in conjunction with IVUS-derived vessel and scaffold areas, evaluating the qualitative and quantitative aspects of vascular healing.
RESULTS: Among the 116 patients enrolled in this trial, 56 patients treated with DREAMS 3G were included in the analysis. At 12 months, OCT imaging revealed that 99.0% of the struts were invisible, and no malapposed struts were depicted. While the vessel area showed no significant difference between the timepoints, the minimum lumen area significantly decreased from post-percutaneous coronary intervention to 6 months (6.88 mm2 to 4.75 mm2; p<0.0001), but no significant changes were observed between 6 and 12 months. Protruding neointimal tissue (PNT) − a unique neointimal presentation observed following resorbable magnesium scaffold implantation − was observed in 89.3% of the study patients at 12 months, and its area exhibited a 47.4% decrease from 6 to 12 months.
CONCLUSIONS: This imaging substudy revealed that, at 12-month follow-up, virtually all struts of the DREAMS 3G scaffold became invisible, without evident malapposition. The vascular healing response to DREAMS 3G implantation also appeared favourable up to 12 months, which is indicated by advanced strut degradation and spontaneous regressing PNT between 6 and 12 months.
The bioresorbable scaffold (BRS) was developed to address the drawbacks of conventional coronary metallic stents, which remain permanently in the coronary arteries after implantation12. Resorbable magnesium scaffold (RMS) technology has continued to evolve over time and distinguishes itself by lower thrombogenicity and relatively early conversion to benign minerals relative to early-generation polymeric scaffolds3. The second-generation RMS, Magmaris (Biotronik), demonstrated a low incidence of scaffold thrombosis (ScT) in a large-scale clinical registry4, indicating that, in the coronary vessels, this technology may effectively address the limitations inherent to polymeric scaffolds.
By further modifying the magnesium alloy, a third-generation drug-eluting RMS, DREAMS 3G (Biotronik), was developed. DREAMS 3G exhibits enhanced tensile strength and reduced strut discontinuity following implantation, despite having thinner struts than the Magmaris scaffold3. In the first-in-human trial, BIOTRONIK – Safety and Clinical Performance of the Sirolimus-Eluting Resorbable Coronary Magnesium Scaffold System in the Treatment of Subjects With de Novo Lesions in Native Coronary Arteries (BIOMAG-I), promising clinical and angiographic outcomes were observed using this new RMS at 12-month follow-up, despite the lack of randomised control studies comparing it to drug-eluting stents5. However, in vivo assessment of vascular healing responses to implantation of this novel RMS has not yet been performed in humans. Furthermore, a phenomenon of neointimal protrusion towards the lumen has been observed following Magmaris scaffold implantation6. Whether this phenomenon is also observed with DREAMS 3G and its clinical significance remain unclear. Hence, this post hoc study aimed to investigate the process of vascular healing following DREAMS 3G implantation, specifically focusing on the visibility of stent struts and neointimal growth patterns observed over time using intravascular imaging including optical coherence tomography (OCT) and intravascular ultrasound (IVUS) obtained in the BIOMAG-I trial.
Methods
STUDY DESIGN OF THE PRESENT IMAGING ANALYSIS
The details concerning the BIOMAG-I trial have previously been published7. For the present imaging substudy, we included patients from the BIOMAG-I trial who had available OCT images of sufficient quality (i) before the index procedure, (ii) following the index procedure, (iii) at 6-month follow-up, and (iv) at 12-month follow-up. Additionally, we only included patients who also had available IVUS images at the timepoints of (ii), (iii), and (iv), in order to reliably delineate vessel and scaffold areas during the resorption process. Patients were excluded from the analysis if OCT imaging was of poor quality, thus unsuitable for analysis, or in cases where less than two-thirds of the longitudinal length of the implanted scaffold was available for imaging analysis. Furthermore, to maintain the accuracy of the malapposition analysis, cases were also excluded if DREAMS 3G scaffolds with different strut thicknesses were implanted in the same lesion. For more information regarding ethical approval and scaffold characteristics, please refer to Supplementary Appendix 1 and Supplementary Appendix 2.
ANALYSIS OF NEOINTIMAL GROWTH IN OPTICAL COHERENCE TOMOGRAPHY IMAGES
The OCT images obtained from the BIOMAG-I trial were transferred to the imaging core laboratory (ISAResearch, Deutsches Herzzentrum München, Munich, Germany) for offline analysis. The data were assessed by two investigators who were blinded to the clinical outcomes (M. Seguchi, A. Aytekin). All analysed segments were evaluated at 1 mm intervals. For detailed information on the OCT analysis concerning the quantification of underlying plaque characteristics, strut visibility, and malapposed struts, please refer to Supplementary Appendix 3.
In addition to the classification of frames by homogeneous or heterogeneous neointima appearance, we also evaluated the presence of peristrut low-intensity areas (PLIA), which is known to be associated with local inflammation, for each analysed frame8. We also assessed protruding neointimal tissue (PNT) as a specific phenomenon observed after implantation of resorbable magnesium scaffolds, with qualitative and quantitative measures. In this regard, we evaluated the number and proportion of the frames with PNT as well as the area of PNT on a patient and frame level. To quantify the PNT area, we traced the area defined by the relatively hypodense tissue zone surrounding individual scaffold struts (Supplementary Figure 1).
Details of the IVUS and angiographic analyses are described in Supplementary Appendix 4.
STATISTICAL ANALYSIS
Categorical variables are expressed as counts and percentages and were compared using Pearson’s chi-squared test or Fisher’s exact test. Continuous data are expressed as means with standard deviation and were checked for normality of distribution using the Shapiro-Wilk test, classifying them as parameters with either normal or non-parametric distribution. Normally distributed continuous variables were compared using an unpaired Student’s t-test. Otherwise, a Wilcoxon/Kruskal-Wallis rank-sum test was used to calculate the significance of differences between the medians of non-parametric data. To examine the correlation between continuous variables, the Spearman’s rank correlation coefficient (Spearman’s rho) was calculated. A p-value less than 0.05 was considered statistically significant. Statistical analysis was performed with JMP Pro, version 16.0 (SAS Institute).
Results
From the overall study population of the BIOMAG-I trial (116 patients, 117 lesions), a total of 56 patients with 56 lesions were enrolled for the imaging analysis (Supplementary Figure 2). Table 1 shows the baseline, lesion and procedural characteristics of the study patients. The mean age of study patients was 61.3±9.0 years, with the majority presenting with complex lesions (75.0% type B2/C lesions) and 17.9% presenting with non-ST-segment elevation myocardial infarction.
Table 1. Patient, lesion, and procedural characteristics.
| Patient characteristics | Imaging analysis N=56 |
|---|---|
| Age, years | 61.3±9.0 |
| Sex | |
| Male | 45 (80.4) |
| Female | 11 (19.6) |
| Previous myocardial infarction | 18 (32.1) |
| Hypertension | 44 (78.6) |
| Dyslipidaemia | 37 (66.1) |
| Diabetes mellitus | 15 (26.8) |
| Insulin-dependent diabetes | 2 (3.6) |
| NSTEMI | 10 (17.9) |
| Lesion/procedural characteristics | |
| Target vessel | |
| LAD | 22 (39.3) |
| LCx | 13 (23.2) |
| RCA | 21 (37.5) |
| AHA/ACC classification | |
| A | 2 (3.6) |
| B1 | 12 (21.4) |
| B2 | 25 (44.6) |
| C | 17 (30.4) |
| Pre-stenting balloon dilation | 56 (100) |
| Post-stenting balloon dilation | 56 (100) |
| Scaffold property | |
| 2.5 mm | 7 (12.5) |
| 3.0 mm | 23 (41.1) |
| 3.5 mm | 13 (23.2) |
| 4.0 mm | 9 (16.1) |
| 3.0+3.0 mm | 1 (1.8) |
| 3.5+3.0 mm | 1 (1.8) |
| 3.5+3.5 mm | 2 (3.6) |
| Data are presented as mean±SD or n (%). AHA/ACC: American Heart Association/American College of Cardiology; LAD: left anterior descending artery; LCx: left circumflex artery; NSTEMI: non-ST-segment elevation myocardial infarction; OCT: optical coherence tomography; RCA: right coronary artery; SD: standard deviation | |
INTRAVASCULAR ULTRASOUND AND QUANTITATIVE CORONARY ANGIOGRAPHY ANALYSIS AT 6- AND 12-MONTH FOLLOW-UP
The vessel area did not exhibit significant change between post-percutaneous coronary intervention (PCI) and 6 months (15.19±3.96 mm2 post-PCI, 14.85±4.10 mm2 at 6 months; p=0.56), nor between the 6- and 12-month follow-up (14.85±4.10 mm2 at 6 months, 14.47±4.19 mm2 at 12 months; p=0.53) (Table 2). On the other hand, the scaffold area decreased between post-PCI and 6 months, with borderline statistical significance (7.71±2.06 mm2 post-PCI, 7.07±2.22 mm2 at 6 months; p=0.07). Subsequently, the scaffold area did not change between 6 and 12 months (7.07±2.22 mm2 at 6 months, 7.15±2.63 mm2 at 12 months; p=0.75) (Table 2). In-scaffold late lumen loss (LLL), measured by quantitative coronary angiography (QCA), showed a slight increase between 6 and 12 months, without reaching statistical significance (0.20±0.23 mm at 6 months, 0.26±0.29 mm at 12 months; p=0.21).
Table 2. OCT, IVUS and QCA measurements at each timepoint.
| Post-procedure N=56 | 6 months N=56 | 12 months N=56 | p-value Post-procedure vs 6 months | p-value 6 months vs 12 months |
|
|---|---|---|---|---|---|
| OCT measurement | |||||
| Lumen area, mm2 | 8.56±2.33 | 6.91±2.41 | 6.87±2.64 | <0.0001 | 0.71 |
| Minimum lumen area, mm2 | 6.88±2.06 | 4.75±2.16 | 4.58±2.39 | <0.0001 | 0.40 |
| No. of analysed frames per lesion | 25.64±6.90 | 24.52±6.48 | 24.75±6.41 | 0.23 | >0.99 |
| No. of visible struts per lesion | 207.45±62.93 | 5.98±7.77 | 1.82±0.92 | <0.0001 | <0.0001 |
| Strut-frame ratio | 8.05±0.91 | 0.25±0.30 | 0.08±0.05 | <0.0001 | <0.0001 |
| No. of malapposed struts per lesion | 15.36±11.83 | 0.05±0.23 | 0.00±0.00 | <0.0001 | 0.08 |
| Neointima analysis | |||||
| No. of frames with homogeneous neointima per lesion | NA | 17.70±8.31 | 17.25±8.32 | NA | 0.78 |
| Proportion of frames with homogeneous neointima per lesion, % | NA | 72.1±26.7 | 69.4±26.8 | NA | 0.51 |
| No. of frames with PLIA per lesion | NA | 6.70±6.02 | 4.71±5.14 | NA | 0.03 |
| Proportion of frames with PLIA per lesion, % | NA | 28.0±24.5 | 19.2±20.6 | NA | 0.03 |
| No. of frames with PNT per lesion | NA | 7.18±6.34 | 5.36±4.44 | NA | 0.20 |
| Proportion of frames with PNT per lesion, % | NA | 28.7±21.9 | 22.2±18.3 | NA | 0.15 |
| No. of PNT per lesion | NA | 13.70±13.76 | 8.75±8.78 | NA | 0.06 |
| PNT area, mm2 | NA | 1.75±2.08 | 0.92±1.03 | NA | 0.03 |
| IVUS measurement | |||||
| Vessel area, mm2 | 15.19±3.96 | 14.85±4.10 | 14.47±4.19 | 0.56 | 0.53 |
| Scaffold area, mm2 | 7.71±2.06 | 7.07±2.22 | 7.15±2.63 | 0.07 | 0.75 |
| QCA measurement | |||||
| In-scaffold late lumen loss, mm | NA | 0.20±0.23 | 0.26±0.29 | NA | 0.21 |
| In-segment late lumen loss, mm | NA | 0.02±0.31 | 0.11±0.34 | NA | 0.13 |
| IVUS: intravascular ultrasound; NA: not applicable; OCT: optical coherence tomography; PLIA: peristrut low-intensity area; PNT: protruding neointimal tissue; QCA: quantitative coronary angiography | |||||
OPTICAL COHERENCE TOMOGRAPHY ANALYSIS AT 6- AND 12-MONTH FOLLOW-UP
Figure 1A displays representative OCT images at each timepoint, and Table 2 shows the temporal changes in vessel area and strut-related characteristics observed by OCT, IVUS and QCA following the index procedure, and at 6 and 12 months. The mean and minimum lumen areas showed significant reductions between post-PCI and 6 months and remained stable between the 6- and 12-month follow-up (Table 2, Figure 1B-C).
Figure 1D-E illustrate the time course of the number of visible struts and the strut-frame ratio (SFR; average number of visible struts per analysed frame) at each timepoint. Compared to post-procedure, the SFR exhibited significant reductions of 96.9% and 99.0% at the 6- and 12-month follow-up, respectively. Regarding strut malapposition, only 3 malapposed struts (0.05±0.23 struts per lesion) were observed at 6 months, and no malapposed struts were detected by OCT imaging at 12-month follow-up among the 56 patients (Table 2).
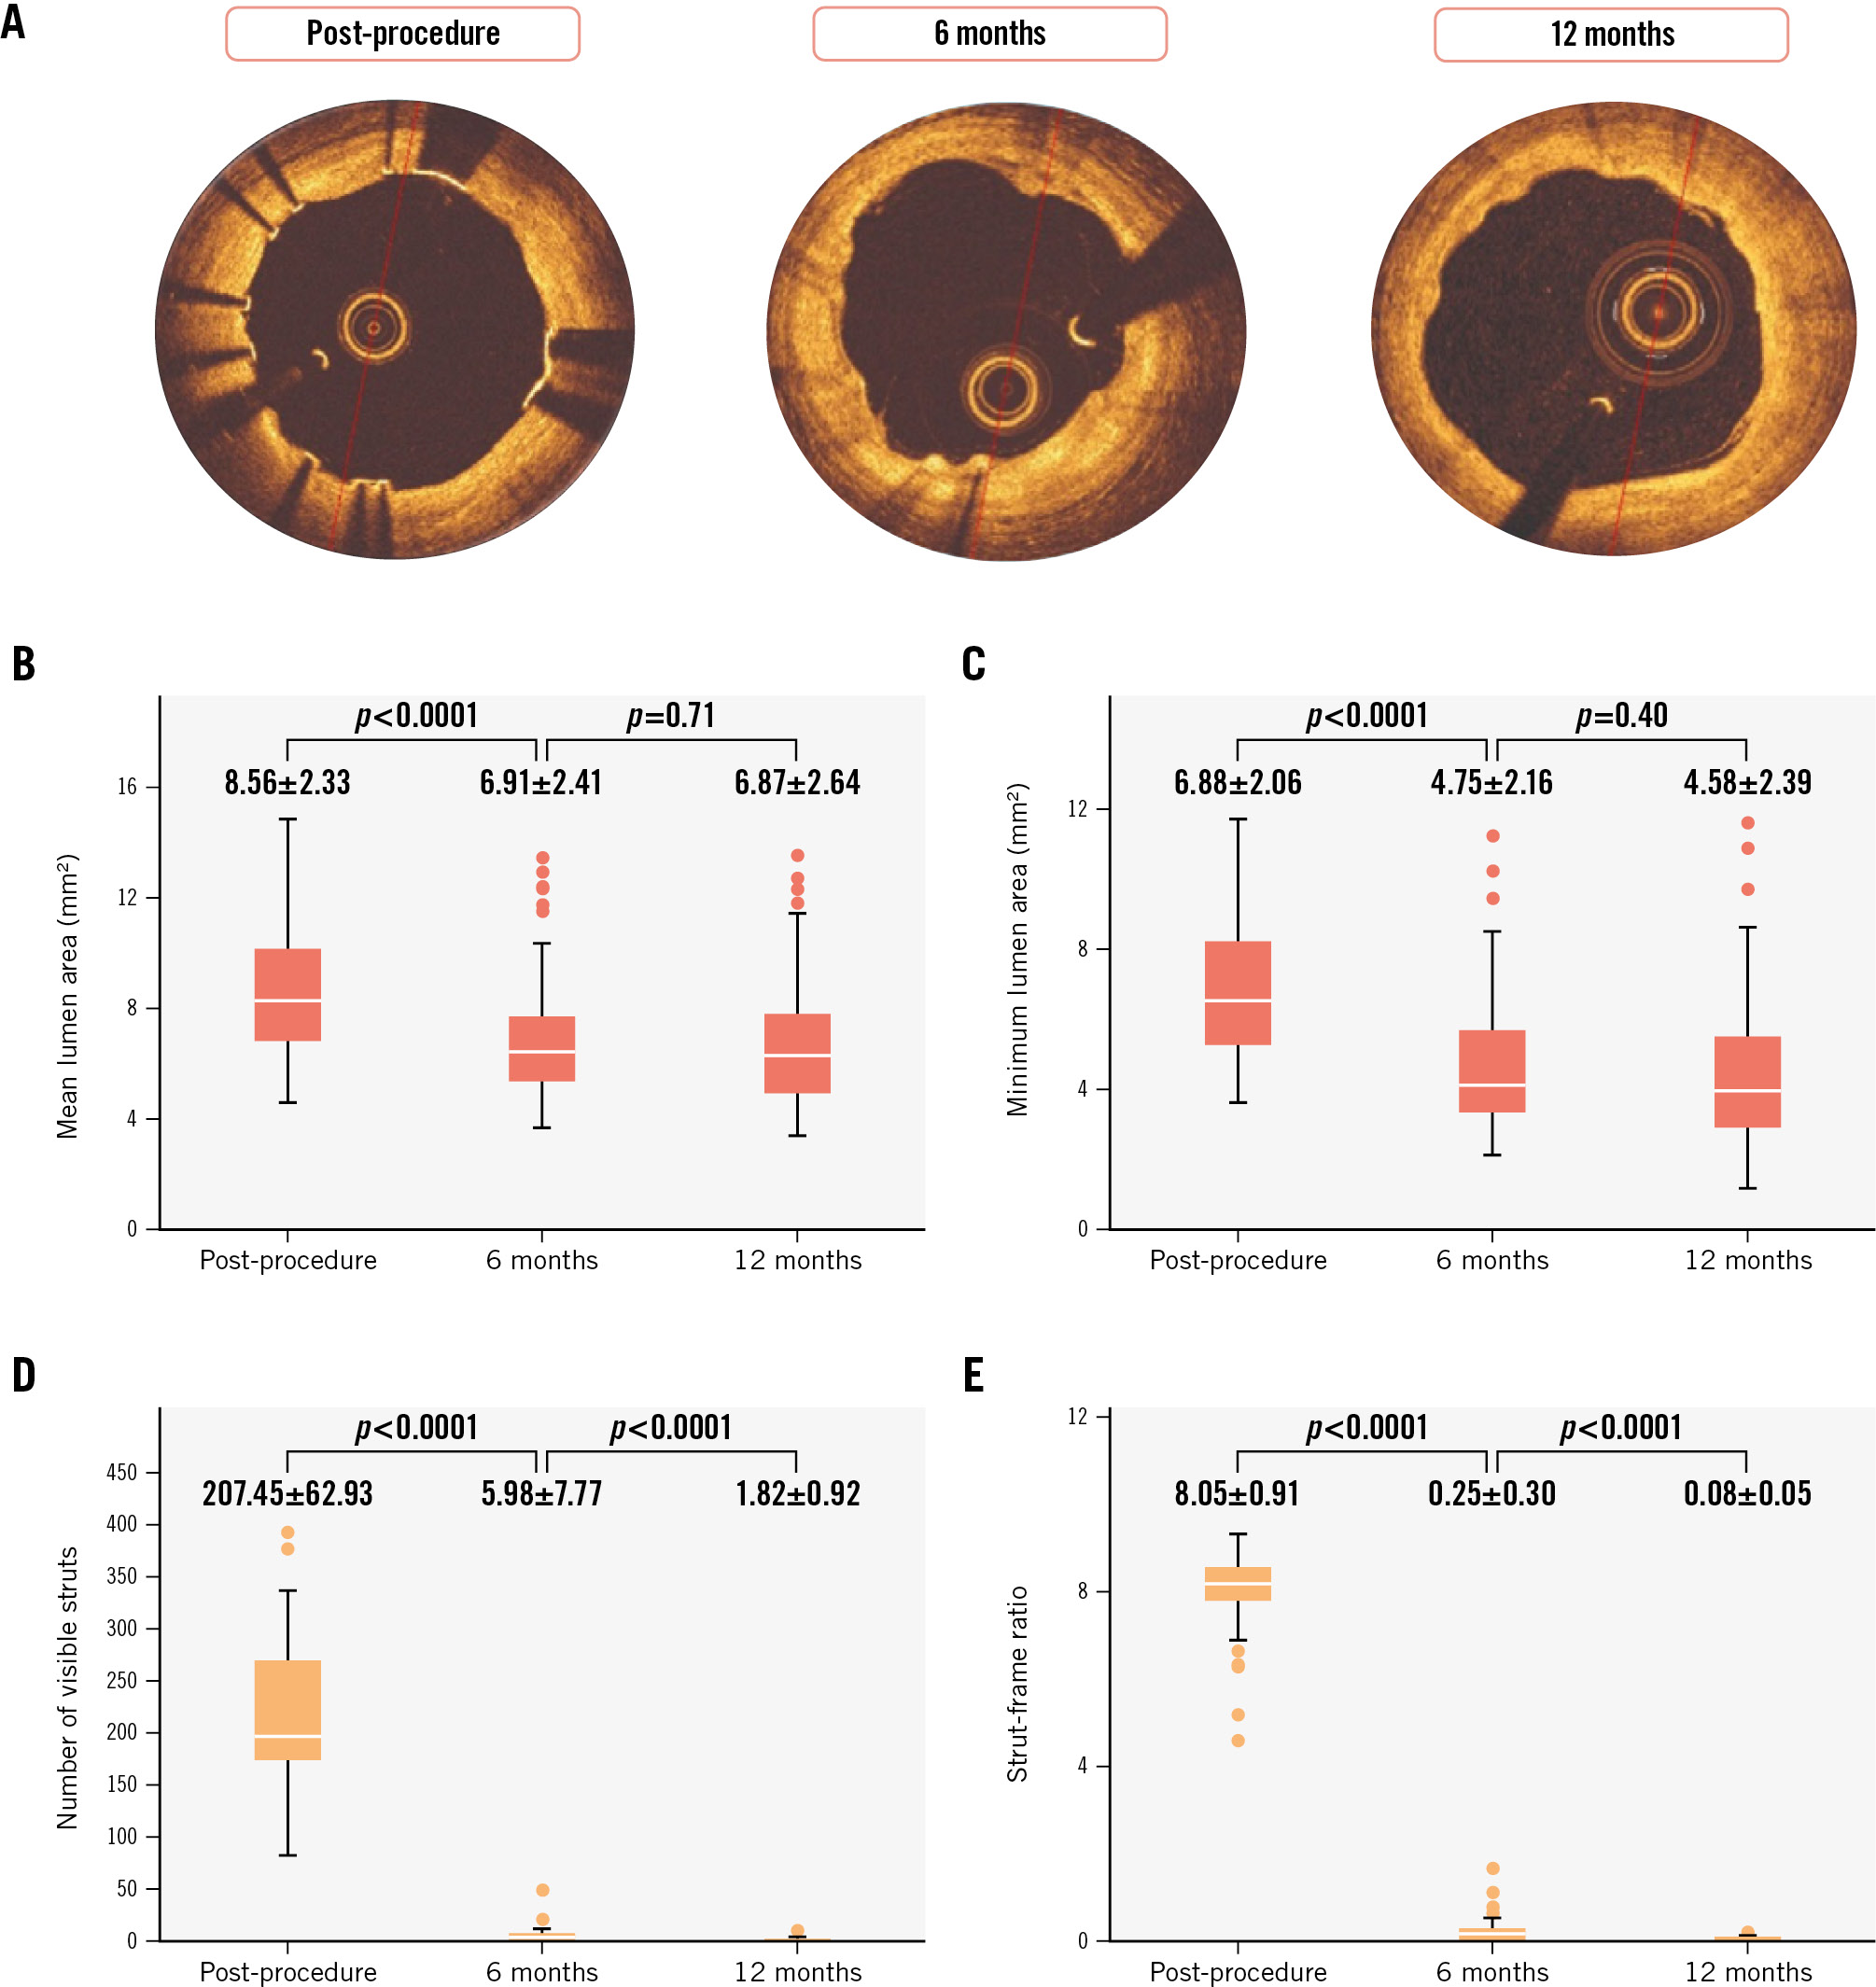
Figure 1. Temporal changes in mean and minimum lumen area, number of visible struts, and strut-frame ratio at each time-point. A) Representative OCT images at each timepoint. The box plots indicate temporal changes in mean lumen area (B), minimum lumen area (C), number of visible struts (D), and strut-frame ratio (E) at each timepoint. OCT: optical coherence tomography
NEOINTIMAL GROWTH: PERISTRUT LOW-INTENSITY AREA AND PROTRUDING NEOINTIMAL TISSUE AT 6 AND 12 MONTHS
Although the overall proportion of frames with homogeneous neointima was similar across the timepoints (72.1±26.7% at 6 months, 69.4±26.8% at 12 months; p=0.51), the proportion of frames with PLIA showed a significant reduction between the two timepoints (28.0±24.5% at 6 months, 19.2±20.6% at 12 months; p=0.03).
Among the 56 study patients, PNT was observed in 53 (94.6%) and 50 (89.3%) patients at 6 and 12 months, respectively (Supplementary Figure 3). Supplementary Figure 4A-D demonstrate the results of frame-based analysis of PNT quantification at each timepoint. The mean PNT area per lesion was significantly larger at 6 months than at 12 months, indicating a 47.4% reduction between these timepoints (1.75±2.08 mm2 at 6 months, 0.92±1.03 mm2 at 12 months; p=0.03) (Supplementary Figure 4D).
Concerning the correlation between PNT area and the proportion of quadrants for each plaque type in the underlying lesion prior to PCI, the proportion of calcified quadrants demonstrated a significant positive correlation with PNT area measured at both 6 and 12 months (Supplementary Figure 5C, Supplementary Figure 5G). However, the proportion of normal, fibrous, and lipidic quadrants did not display a significant correlation with the PNT area measured at 6 or 12 months (Supplementary Figure 5A-B, Supplementary Figure 5D-F, Supplementary Figure 5H).
PATIENT CHARACTERISTICS AND QUALITATIVE/QUANTITATIVE OCT MEASUREMENTS AMONG BINARY PROTRUDING NEOINTIMAL TISSUE GROUPS
To further investigate the impact of PNT on clinical significance, we divided the study patients into two groups based on the median distribution of the PNT area at 6-month follow-up: the high PNT group (N=28) and the low PNT group (N=28) (Supplementary Figure 2). Table 3 shows an overview of the baseline characteristics along with qualitative/quantitative measurements by OCT, IVUS and QCA at 6- and 12-month follow-up for both groups.
Regarding the change in PNT area between 6 and 12 months, the high PNT group demonstrated a significantly larger reduction compared to the low PNT group during the time frame (−1.60±2.49 in the high PNT group, −0.06±0.40 in the low PNT group; p=0.001) (Supplementary Figure 6).
The Central illustration illustrates the time course of lumen and vessel areas in the present study. OCT-derived mean and minimum lumen areas were significantly larger in the high PNT group compared to the low PNT group at the 6- and 12-month follow-up (Figure 2A-D). Concerning the change in mean and minimum lumen areas between post-procedure and 6 months, these areas showed a significantly smaller decrease in the high PNT group compared to the low PNT group (delta of mean lumen area: high PNT group −1.12±1.73 mm2, low PNT group −2.18±1.16 mm2; p=0.01; delta of minimum lumen area: high PNT group −1.65±1.46 mm2, low PNT group −2.59±1.43 mm2; p=0.02) (Table 3).
Table 3. Comparison between the high PNT group and low PNT group.
| All study patients N=56 | High PNT group N=28 | Low PNT group N=28 | p-value | |
|---|---|---|---|---|
| Patient characteristics | ||||
| Age, years | 61.29±9.03 | 60.29±10.10 | 62.30±7.87 | 0.41 |
| Male sex | 45 (80.4) | 24 (85.7) | 21 (75.0) | 0.31 |
| Previous myocardial infarction | 18 (32.1) | 8 (28.6) | 10 (35.7) | 0.57 |
| Hypertension | 44 (78.6) | 23 (82.1) | 21 (75.0) | 0.51 |
| Dyslipidaemia | 37 (66.1) | 20 (71.4) | 17 (60.7) | 0.40 |
| Diabetes mellitus | 15 (26.8) | 8 (28.6) | 7 (25.0) | 0.76 |
| Underlying plaque characteristics | ||||
| Proportion of normal quadrant, % | 36.8±21.4 | 32.2±22.5 | 41.4±19.7 | 0.11 |
| Proportion of fibrous quadrant, % | 43.9±17.9 | 45.8±20.4 | 42.1±15.1 | 0.44 |
| Proportion of calcium quadrant, % | 6.3±7.0 | 7.3±6.8 | 5.3±7.1 | 0.07 |
| Proportion of lipidic quadrant, % | 12.9±15.1 | 14.7±17.1 | 11.2±12.8 | 0.43 |
| OCT measurement | ||||
| No. of malapposed struts post-procedure | 15.36±11.83 | 17.32±11.31 | 13.39±12.22 | 0.12 |
| Mean lumen area post-procedure, mm2 | 8.56±2.33 | 9.13±2.60 | 7.99±1.92 | 0.07 |
| Minimum lumen area post-procedure, mm2 | 6.88±2.06 | 7.35±2.32 | 6.40±1.68 | 0.14 |
| No. of malapposed struts at 6 months | 0.05±0.23 | 0.04±0.19 | 0.07±0.26 | 0.57 |
| Proportion of frames with homogeneous neointima at 6 months, % | 72.1±26.7 | 79.5±21.1 | 64.6±29.9 | 0.08 |
| Proportion of frames with PLIA at 6 months, % | 28.0±24.5 | 24.6±22.3 | 31.4±26.5 | 0.34 |
| Proportion of frames with protruding neointimal tissue at 6 months, % | 28.7±21.9 | 44.8±18.7 | 12.5±9.5 | <0.0001 |
| Protruding neointimal tissue area per lesion at 6 months, mm2 | 1.75±2.08 | 3.09±2.23 | 0.41±0.28 | <0.0001 |
| Mean lumen area at 6 months, mm2 | 6.91±2.41 | 8.00±2.80 | 5.81±1.23 | 0.002 |
| Minimum lumen area at 6 months, mm2 | 4.75±2.16 | 5.70±2.51 | 3.81±1.15 | 0.003 |
| No. of malapposed struts at 12 months | 0.00±0.00 | 0.00±0.00 | 0.00±0.00 | NA |
| Proportion of frames with homogeneous neointima at 12 months, % | 69.4±26.8 | 71.2±27.2 | 67.5±26.7 | 0.46 |
| Proportion of frames with PLIA at 12 months, % | 19.2±20.6 | 17.2±19.9 | 21.3±21.5 | 0.46 |
| Proportion of frames with protruding neointimal tissue at 12 months, % | 22.2±18.3 | 30.2±18.7 | 14.2±14.1 | 0.0005 |
| Protruding neointimal tissue area per lesion at 12 months, mm2 | 0.92±1.03 | 1.50±1.14 | 0.34±0.40 | <0.0001 |
| Mean lumen area at 12 months, mm2 | 6.87±2.64 | 8.14±2.99 | 5.59±1.37 | 0.001 |
| Minimum lumen area at 12 months, mm2 | 4.58±2.39 | 5.63±2.82 | 3.53±1.16 | 0.001 |
| Delta mean lumen area between post-procedure and 6 months, mm2 | −1.65±1.55 | −1.12±1.73 | −2.18±1.16 | 0.01 |
| Delta minimum lumen area between post-procedure and 6 months, mm2 | −2.12±1.51 | −1.65±1.46 | −2.59±1.43 | 0.02 |
| Delta protruding neointimal tissue area between 6 and 12 months, mm2 | −0.83±1.93 | −1.60±2.49 | −0.06±0.40 | 0.001 |
| Delta mean lumen area between 6 and 12 months, mm2 | −0.04±0.89 | 0.14±1.11 | −0.22±0.57 | 0.28 |
| Delta minimum lumen area between 6 and 12 months, mm2 | −0.17±0.96 | −0.07±1.24 | −0.27±0.57 | 0.09 |
| IVUS measurement | ||||
| Mean vessel area post-PCI, mm2 | 15.19±3.96 | 16.30±4.23 | 14.07±3.39 | 0.04 |
| Mean scaffold area post-PCI, mm2 | 7.71±2.06 | 8.19±2.33 | 7.23±1.65 | 0.08 |
| Mean vessel area at 6 months, mm2 | 14.85±4.10 | 16.45±4.38 | 13.24±3.11 | 0.003 |
| Mean scaffold area at 6 months, mm2 | 7.07±2.22 | 7.88±2.56 | 6.26±1.45 | 0.03 |
| Mean vessel area at 12 months, mm2 | 14.47±4.19 | 16.03±4.66 | 12.90±3.00 | 0.008 |
| Mean scaffold area at 12 months, mm2 | 7.15±2.63 | 8.20±3.08 | 6.10±1.53 | 0.01 |
| Delta mean vessel area between post-procedure and 6 months, mm2 | −0.34±1.28 | 0.15±1.10 | −0.83±1.28 | 0.004 |
| Delta mean scaffold area between post-procedure and 6 months, mm2 | −0.64±0.83 | −0.31±0.86 | −0.97±0.67 | 0.002 |
| Delta mean vessel area between 6 months and 12 months, mm2 | −0.38±1.24 | −0.42±1.21 | −0.34±1.29 | 0.81 |
| Delta mean scaffold area between 6 months and 12 months, mm2 | 0.08±0.81 | 0.32±0.84 | −0.17±0.71 | 0.02 |
| QCA measurement | ||||
| In-scaffold late lumen loss at 6 months, mm | 0.20±0.23 | 0.13±0.20 | 0.28±0.24 | 0.03 |
| In-segment late lumen loss at 6 months, mm | 0.02±0.31 | −0.07±0.30 | 0.10±0.31 | 0.049 |
| In-scaffold late lumen loss at 12 months, mm | 0.26±0.29 | 0.15±0.27 | 0.37±0.27 | 0.002 |
| In-segment late lumen loss at 12 months, mm | 0.11±0.34 | 0.02±0.37 | 0.20±0.29 | 0.05 |
| Delta in-scaffold late lumen loss between 6 and 12 months, mm | 0.06±0.19 | 0.02±0.18 | 0.09±0.19 | 0.04 |
| Delta in-segment late lumen loss between 6 and 12 months, mm | 0.10±0.26 | 0.09±0.26 | 0.10±0.26 | 0.34 |
| IVUS: intravascular ultrasound; NA: not applicable; OCT: optical coherence tomography; PCI: percutaneous coronary intervention; PLIA: peristrut low-intensity area; PNT: protruding neointimal tissue QCA: quantitative coronary angiography | ||||
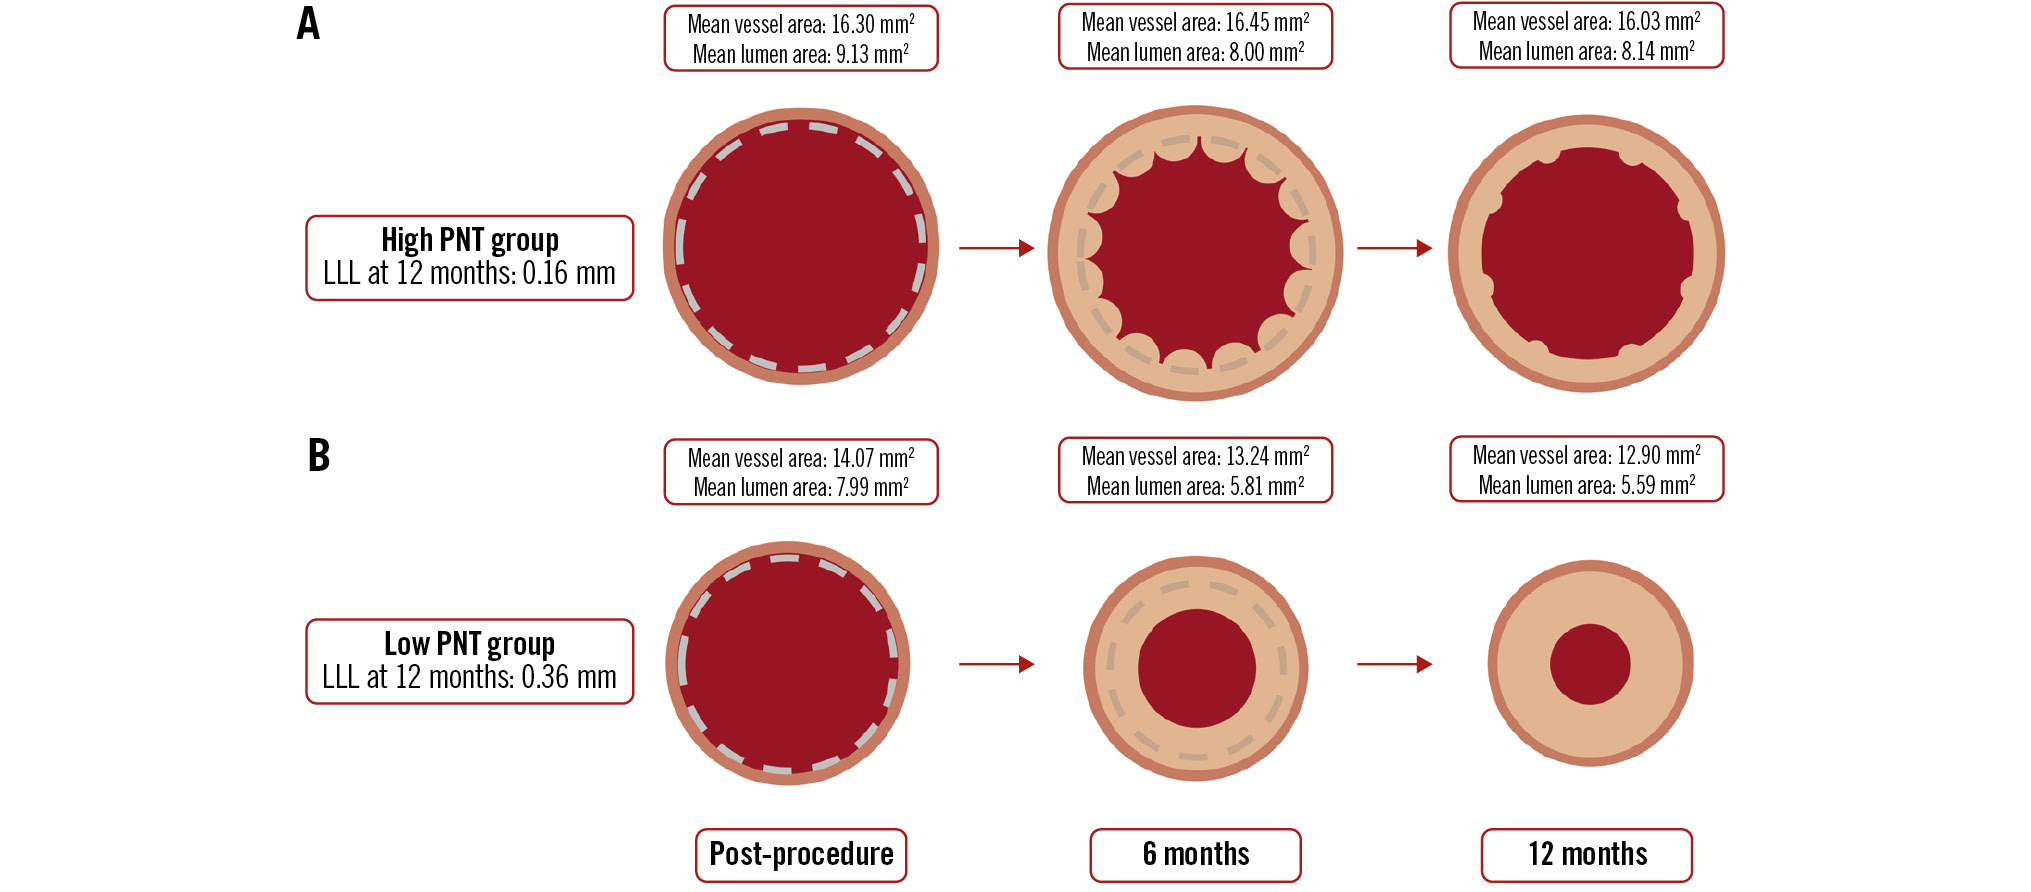
Central illustration. Temporal changes in lumen and vessel areas. Temporal changes of lumen and vessel areas in the high and low PNT groups. A) Illustrates the time course of the high PNT group, while (B) represents the low PNT group. Lumen area was measured using OCT images, while scaffold and vessel area assessments were conducted using IVUS. IVUS: intravascular ultrasound; LLL: late lumen loss; OCT: optical coherence tomography; PNT: protruding neointimal tissue
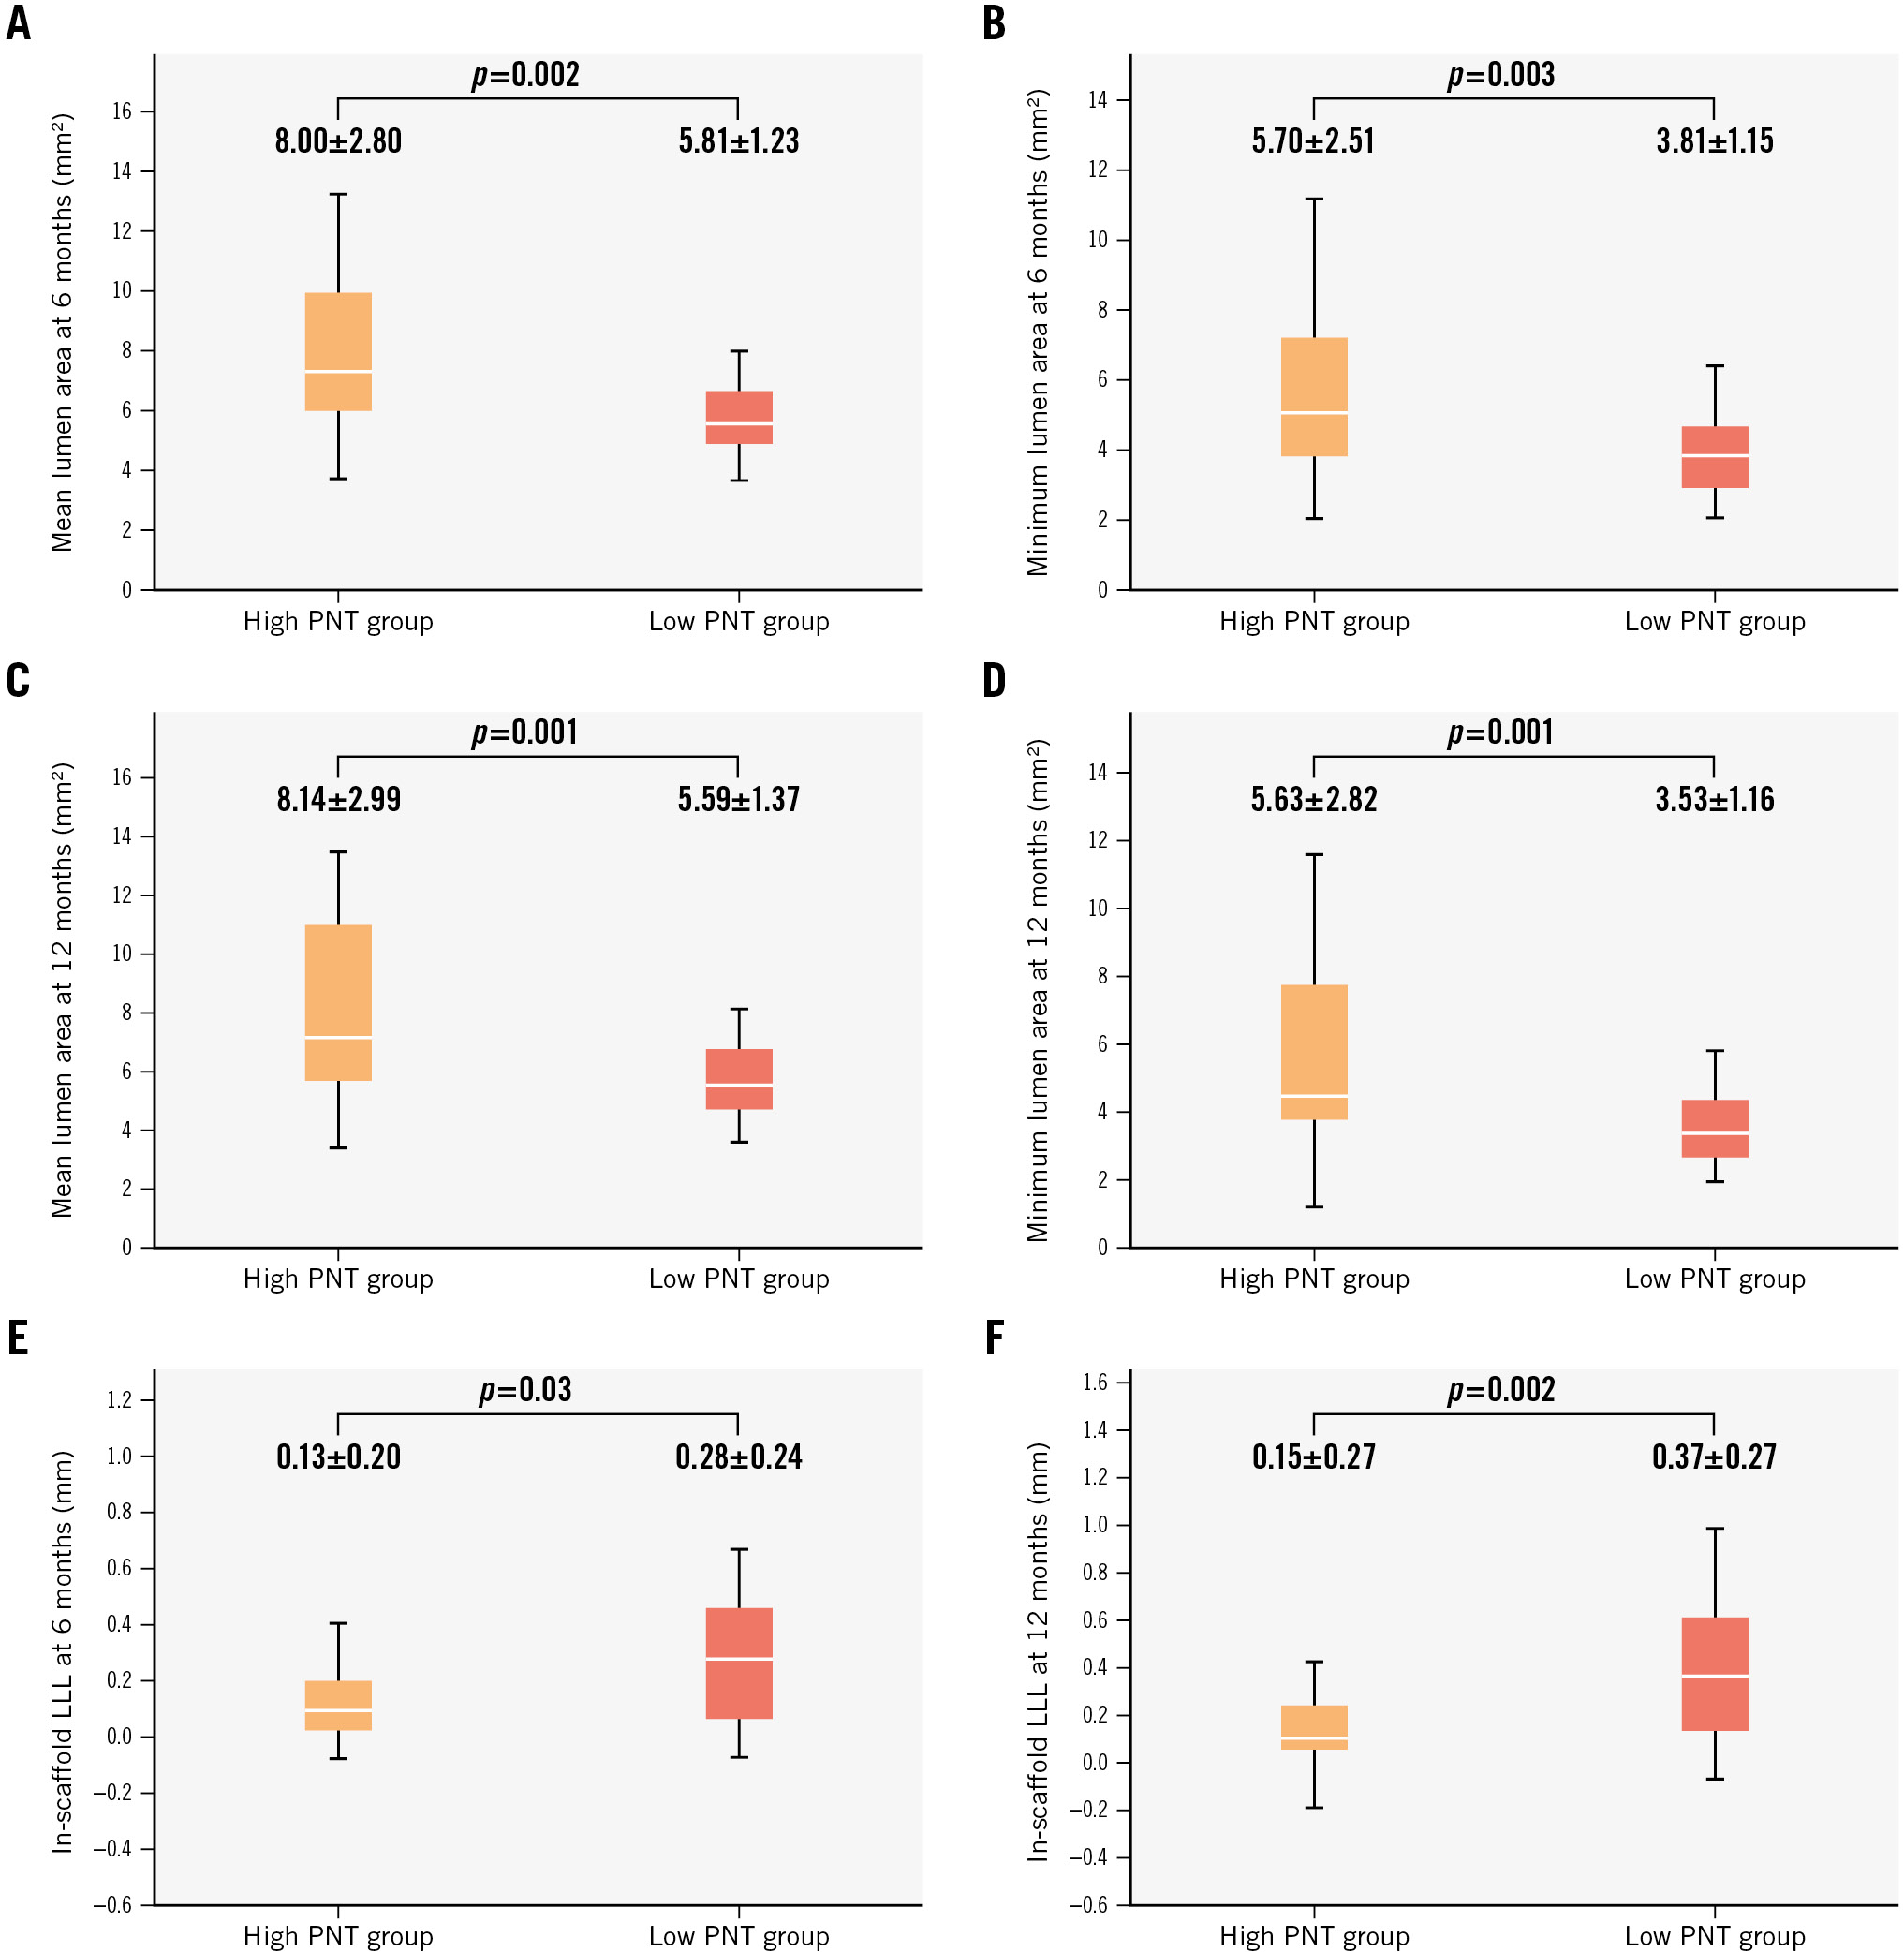
Figure 2. Comparison of mean lumen area, minimum lumen area, and in-scaffold late lumen loss at 6- and 12-month follow-up. Box plots represent the comparison of mean and minimum lumen areas measured using OCT at 6 months (A,B), mean and minimum lumen areas at 12 months (C,D), and in-scaffold late lumen loss (LLL) at 6 and 12 months (E,F). OCT: optical coherence tomography; PNT: protruding neointimal tissue
INTRAVASCULAR ULTRASOUND AND QUANTITATIVE CORONARY ANGIOGRAPHY MEASUREMENTS IN THE HIGH AND LOW PROTRUDING NEOINTIMAL TISSUE GROUPS
The high PNT group had a significantly larger vessel area than the low PNT group at all timepoints (Central illustration). Notably, between post-PCI and the 6-month follow-up, the vessel area in the low PNT group decreased (−0.83±1.28 mm²), whereas in the high PNT group, it remained stable (+0.15±1.10 mm²). The high PNT group consistently had a significantly larger scaffold area than the low PNT group at all measured timepoints.
Figure 2E-F show the in-scaffold LLL at 6 and 12 months for both groups. The in-scaffold LLL was significantly lower in the high PNT group compared to the low PNT group at both 6 months and 12 months (6 months: high PNT group 0.13±0.20 mm vs low PNT group 0.28±0.24 mm; p=0.03; 12 months: high PNT group 0.15±0.27 mm vs low PNT group 0.37±0.27 mm; p=0.002). As a continuous variable, the PNT area at 6 months showed significant negative correlation with in-scaffold LLL at 6 months (p=0.03, Spearman’s rho=−0.29) and at 12 months (p<0.001, Spearman’s rho=−0.46) (Supplementary Figure 7). On the other hand, the PNT area at 12 months did not correlate significantly with in-scaffold LLL at 6 months (p=0.58, Spearman’s rho=−0.08) or 12 months (p=0.33, Spearman’s rho=−0.13).
Discussion
In the context of the positive results of the BIOMAG-I trial, the current study aimed to provide an in-depth intravascular imaging analysis of vascular responses to DREAMS 3G implantation at 6- and 12-month follow-up. The main findings of this study are as follows:
i) At 6 and 12 months following DREAMS 3G implantation, 96.9% and 99.0% of DREAMS 3G struts, respectively, became invisible, assessed by OCT. No malapposed struts were detected on OCT images at 12-month follow-up owing to advanced strut degradation of the novel scaffold.
ii) IVUS analysis revealed a slight decrease in vessel and scaffold areas from baseline to 6 months, which remained stable between 6 and 12 months of follow-up.
iii) PNT was observed by OCT imaging in 89.3% of study patients at 12-month follow-up, and its area exhibited a 47.4% decrease from 6 months to 12 months after implantation. This reduction was more pronounced in lesions with a large PNT area at 6 months compared to in lesions with a small PNT area.
iv) Compared to lesions with a small PNT area, the lesions with a large PNT area at 6 months showed significantly larger minimum and mean lumen areas, along with significantly lower in-scaffold LLL at both the 6-month and 12-month timepoints.
v) IVUS assessment indicated that the vessel area in the high PNT group was consistently larger than in the low PNT group.
This is the first study to investigate consecutive intravascular imaging timepoints and provide in-depth analysis with regard to the imaging assessment of scaffold degradation and the vascular response following implantation of the scaffold. The findings of this study − showing that most struts become invisible 12 months after DREAMS 3G implantation and that vascular responses such as PLIA and PNT are less severe at 12 months than at 6 months − suggest that the vascular response to this scaffold is trending towards resolution by 12 months.
TIME COURSE OF STRUT DEGRADATION
The findings of this study, which reveal that 99.0% of struts were invisible on OCT images after 12 months of DREAMS 3G implantation, are consistent with previous preclinical investigations that indicated a 99.6% resorption rate of DREAMS 3G struts at 12 months3. This degradation time frame is significantly shorter than the 36-42 months required for complete strut resorption with the Absorb bioresorbable vascular scaffold (Absorb BVS [Abbott])9. In comparison to its precursor device, a preclinical study showed a resorption rate of 94.8% for the Magmaris scaffold after 1 year of implantation, suggesting that DREAMS 3G degrades slightly faster than its predecessor. In a prior clinical study using Magmaris, 33.3% of struts were indiscernible on OCT at the 12-month timepoint10. Despite the methodological differences in assessing indiscernible struts by OCT among studies, 99% of struts were invisible after 12 months in our study, which suggests more advanced degradation in DREAMS 3G compared to its predecessor device.
The relatively fast resorption time of DREAMS 3G is expected to mitigate the risk of device-related complications, such as very late ScT and neoatherosclerosis, which are associated with a prolonged presence of struts within the vessel wall. Conversely, if strut resorption progresses too rapidly, it may lead to early strut discontinuity, raising concerns about the premature loss of radial force. In this regard, DREAMS 3G exhibits enhanced material tensile strength and a characteristic of homogeneous strut resorption, which result in significantly fewer strut discontinuities than the Magmaris scaffold at comparable timepoints3. Owing to these inherent advantages, it is conceivable that the novel RMS may provide sufficient radial force over the critical time period of vascular healing, despite the fact that its resorption time is demonstrated to be shorter. Indeed, the main publication of the BIOMAG-I trial reported a superior LLL at 12-month follow-up with DREAMS 3G compared to the Magmaris scaffold5.
STRUT COVERAGE AND NEOINTIMA CHARACTERISTICS FOLLOWING DREAMS 3G IMPLANTATION
In the present analysis, the OCT images revealed that the remaining visible struts were well covered by neointima and were embedded at 6 months after scaffold implantation. Indeed, no malapposed struts were observed at 12 months in this OCT analysis. These results demonstrate that strut coverage of this novel RMS is satisfactory owing to its relative rapid degradation, and this characteristic is expected to reduce the risk of complications related to malapposed struts following scaffold implantation, such as ScT. Clinically, no ScT was observed up to 12 months among the 116 patients treated in the BIOMAG-I trial.
Regarding neointima characteristics, the proportion of frames with homogeneous neointima was consistently around 70% at 6 and 12 months. On the other hand, the proportion of frames with PLIA decreased significantly between 6- and 12-month follow-up. PLIA is considered to represent fibrinogen and proteoglycans in the extracellular matrix and is thought to be associated with peristrut inflammation8. The results of our study suggest a reduction in strut-associated inflammation over time, indicating that the vascular healing process progresses favourably between 6 and 12 months.
PROTRUDING NEOINTIMAL TISSUE AS A UNIQUE PHENOMENON OBSERVED AFTER RESORBABLE MAGNESIUM SCAFFOLD IMPLANTATION
This intravascular imaging assessment demonstrated that PNT was observed in 94.6% of study patients, and an average of 28.7% of analysed frames depicted PNT at the 6-month timepoint. This suggests that this unique phenomenon is a common manifestation of the vascular healing process following DREAMS 3G implantation.
Previous clinical studies have reported that PNT is observed following the implantation of the predecessor of DREAMS 3G, the Magmaris scaffold610. Gomez-Lara et al utilised OCT to investigate vessel healing properties following implantation of the Magmaris scaffold, demonstrating that protruding struts were observed in 37.5% of patients at 1 year after scaffold implantation10. On the other hand, in the present study, PNT was observed in 89.3% of patients at 12 months on OCT images; this proportion is considerably higher than that reported by Gomez-Lara et al.
The reason for this distinction could be attributed not only to the difference in the backbone material but also to the difference in the definition of protruding struts reported by them and our definition of PNT. Since 99.0% of the struts in DREAMS 3G were invisible on OCT at 12 months, the presence of visible struts was not a necessary condition for determining the presence of PNT in the present study. Therefore, neointimal protrusions towards the lumen were counted as PNT even if struts were not visible inside, which explains why the proportion of PNT observed in our study was higher compared to the study by Gomez-Lara et al.
Moreover, the present study demonstrated that the PNT area, the number of frames with PNT, and patients with observed PNT exhibited a decrease between the 6- and 12-month follow-up, implying that this characteristic can spontaneously resolve over time. Although the clinical significance for this unique phenomenon remains unclear, the present study revealed that the high PNT group showed more favourable imaging outcomes, such as lower LLL and a smaller decrease in lumen area, than the low PNT group. However, whether these favourable imaging-related measures will translate into improved clinical outcomes remains undetermined because of the small number of adverse clinical events observed in the BIOMAG-I study.
A discussion on the mechanism of PNT formation is included in Supplementary Appendix 5 and Supplementary Appendix 6.
Limitations
The present study has some limitations. This is a post hoc analysis of the BIOMAG-I trial, and as such, it shares the limitations associated with any non-prespecified analyses. Intravascular imaging data were not available for all the patients, and selection bias may be present. While the BIOMAG-I study enrolled 116 patients (117 lesions), it is important to note that more than half of these were excluded from this OCT post hoc analysis. In the entire BIOMAG-I cohort, 3 cases of target lesion revascularisation were reported up to 12-month follow-up. These cases did not meet the inclusion criteria for this analysis and were therefore excluded. The exclusion of these cases may have potentially influenced the results of this post hoc analysis. However, the in-scaffold LLL − the primary endpoint of the main BIOMAG-I study − was 0.24±0.36 mm for the entire cohort5, closely aligning with the 0.26±0.29 mm observed in the 56 cases included in this analysis. This suggests that the exclusion of these 3 cases likely had a minimal impact on the results of this post hoc analysis.
The accuracy of detecting remaining struts, malapposed struts, and protruding neointimal tissue is limited because of significant strut degradation in the OCT images at follow-up timepoints. In this study, strut degradation was quantified using a binary indicator of whether struts were visible or not. Therefore, in this analysis, only structures that appeared as struts accompanied by attenuation were counted as visible struts. This definition may not equal pathological complete resorption, representing a limitation of this imaging substudy.
Additionally, precisely differentiating neointima from the underlying vessel tissue outside of the scaffold is challenging because of advanced strut degradation in the OCT images. In this analysis, we integrated OCT-derived lumen area with IVUS-derived vessel and scaffold areas, owing to the difficulties in precisely assessing the scaffold and vessel areas using OCT images alone. These challenges were primarily due to the rapid degradation of DREAMS 3G and the associated lack of visibility on OCT imaging. Since BIOMAG-I is a single-arm study, the present analysis does not involve a direct comparison of the DREAMS 3G with metallic stents or polymeric BRS. There is also a possibility of a type II error in statistics due to the limited sample size.
Conclusions
This OCT assessment revealed that 99.0% of DREAMS 3G struts became invisible, and no visible malapposed struts were observed at 12-month follow-up. Considering the reduction in PNT area and the proportion of frames with PLIA between 6- and 12-month follow-up, the vascular healing process following DREAMS 3G implantation appeared favourable up to 12 months of follow-up.
Impact on daily practice
In optical coherence tomography images obtained at the 12-month follow-up of the first-in-human trial using the third-generation resorbable magnesium scaffold, virtually all of the scaffold struts had become invisible, without evident malapposition. The formation of protruding neointimal tissue − a distinct phenomenon − was commonly observed following the implantation of DREAMS 3G. This unique imaging finding may represent a benign vessel healing response.
Guest Editor
This paper was guest edited by Fernando Alfonso, MD; Department of Cardiology, Hospital Universitario de La Princesa, Madrid, Spain & Hospital ClÃnico San Carlos, Madrid, Spain
Acknowledgements
We would like to express our gratitude for the support of the collaborating institution in the BIOMAG-I trial. We are also grateful to Biotronik AG and MedStar Cardiovascular Research Network for providing the patient-level data.
Funding
The study was funded by Biotronik AG, Buelach, Switzerland.
Conflict of interest statement
H.M. Garcia-Garcia and R. Waksman were core laboratory members; the remaining authors were investigators of the trial. M. Seguchi reports honoraria for an interview from Biotronik. E. Xhepa reports lecture fees and honoraria from AstraZeneca, Boston Scientific, and SIS Medical, not related to the current work; proctor fees from Abbott; and financial support for attending meetings and/or travel expenses from Abbott. M. Haude reports grants/contracts from Biotronik, Cardiac Dimensions, OrbusNeich, and Philips; consulting fees from Biotronik, Cardiac Dimensions, Shockwave Medical, and OrbusNeich; honoraria/speaker fees from Biotronik, Cardiac Dimensions, Shockwave Medical, OrbusNeich, and Philips; support to attend meetings/travel support from Biotronik; is a steering committee member of the BIOSOLVE and BIOMAG trials; and is a former President of EAPCI. J. Torzewski reports grants and contracts from Abbott paid to his institution; speaker honoraria and support for attending meetings from Biotronik; and is an Associated Editor of Cardiovascular Biologics and Regenerative Medicine and Frontiers in Cardiovascular Medicine. J. Escaned is supported by the Intensification of Research Activity project INT22/00088 from Spanish Instituto de Salud Carlos III; and declares having served as speaker and advisory board member for Abbott and Philips. J.F. Iglesias reports research grants to the institution from Abbott, AstraZeneca, Biosensors, Biotronik, Concept Medical, Philips, and Terumo Corp., outside the submitted work; speaker fees/honoraria from AstraZeneca, Biosensors, Biotronik, Bristol-Myers Squibb, Cordis, Concept Medical, MedAlliance, Medtronic, Novartis, Terumo Corp., Pfizer, and Philips, outside the submitted work; and support to attend meetings from Biotronik and Medtronic. The institution of J. Bennett receives grants or contracts from Shockwave Medical; and J. Bennett receives consulting fees from Biotronik and Boston Scientific; speaker fees/honoraria from Biotronik, Boston Scientific, and Abbott; participates in the DSMB of Boston Scientific; and has a leadership or fiduciary role for Biotronik. G.G. Toth reports consulting fees from Biotronik, Medtronic, Abbott, and Terumo; and honoraria from Biotronik, Medtronic, Abbott, and Terumo. R. Toelg reports lecture fees from Biotronik, Abbott, and Boston Scientific. M. Wiemer reports speaker honoraria and conference attendance support from Biotronik. G. Olivecrona reports lecturer honoraria from Abbott, Biotronik, and Cordis; is a DSMB member of the SCIENCE trial; and is a CEC member of the BIOFREEDOM STEMI trial. H.M. Garcia-Garcia has grants or contracts from Cordis, Medis, Biotronik, Abbott, Neovasc, Boston Scientific, CorFlow, Pulse Medical, Philips, and Chiesi (paid to the institution); received consulting fees from Boston Scientific, Medis, Abbott, Biotronik, and ACIST; and participates in the DSMB/advisory board of the VIVID study. R. Waksman has grants from Biotronik, Medtronic, and Philips IGT; received consulting fees from Abbott, Append Medical, Biotronik, Boston Scientific, JC Medical, MedAlliance/Cordis, Medtronic, Philips IGT, Pi-Cardia Ltd., and Transmural Systems Inc.; participates in advisory boards of Abbott, Boston Scientific, Medtronic, Philips IGT, and Pi-Cardia Ltd.; and is an investor in Transmural Systems Inc. M. Joner reports personal fees from Abbott, AstraZeneca, Biotronik, OrbusNeich, ReCor, and Shockwave Medical; grants and personal fees from Boston Scientific and Edwards Lifesciences; personal fees and a grant from Cardiac Dimensions; and a grant from Infraredx, outside the submitted work. The other authors have no conflicts of interest to declare. The Guest Editor reports no conflicts of interest.
Supplementary data
To read the full content of this article, please download the PDF.