Abstract
Atherosclerosis is a complex disease with multiple factors associated with its progression and complications.Fibroatheroma is a pathological entity which contains abundant lipid, and often, a thin fibrous cap that is the most common underlying cause of acute myocardial infarction. Based on pathological descriptions, we propose a new imaging-based nomenclature indicating high-risk plaque characteristics that can be identified with imaging. Additionally, we review the literature indicating in vivo plaque characterisation as well as outlining the natural history of plaques and, more importantly, its responses to systemic and local therapies. Intravascular imaging has positively impacted how we evaluate atherosclerosis, and it can provide guidance on the use of tailored therapies and the evaluation of their long-term follow-up effects.
Imaging of the coronary atherosclerotic process has provided unique insights into the natural history of coronary artery disease (CAD) and has allowed us to better understand the mechanisms regulating plaque evolution. Efforts have been made over recent years to identify plaque prone to thrombosis and to detect plaque characteristics that are associated with a high risk of vascular complications and clinical events. Furthermore, the imaging of plaque pathology has allowed us to evaluate the systemic and local effects of existing and emerging treatments developed to inhibit plaque progression.
This review aims to facilitate a comprehensive assessment of plaque pathology using coronary imaging. We first describe the use of imaging to characterise the individual plaque components and how they coexist and form different plaque phenotypes; we then present the plaque features associated with clinical events. Finally, we summarise the pharmacological clinical trials that used serial imaging methods to evaluate the effect of established and newly developed drugs on plaque morphology and progression/regression (Central illustration).
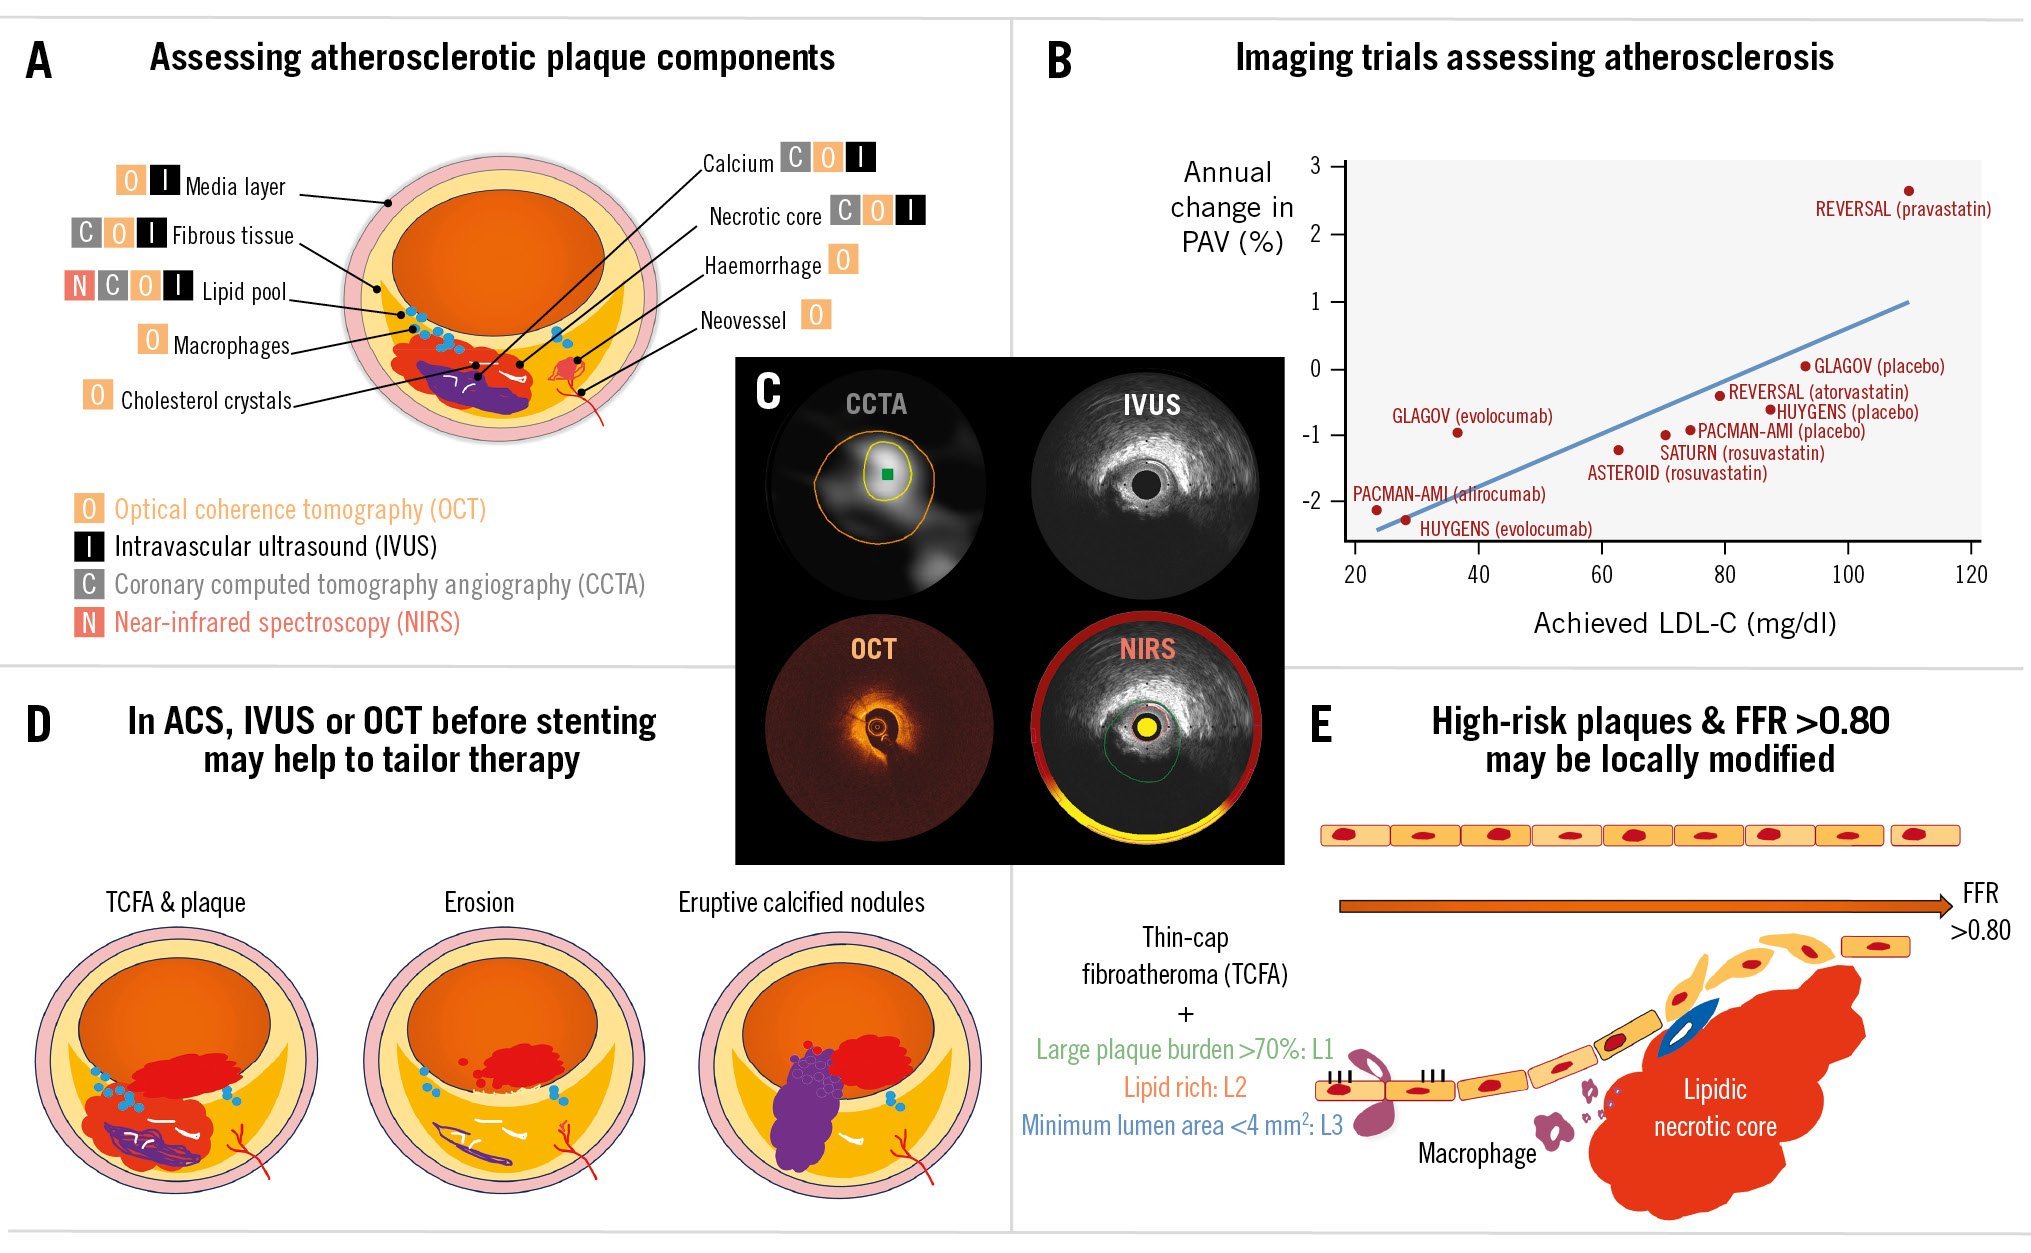
Central illustration. Imaging assessment of atherosclerotic plaque. A) Assessment of coronary plaque size and its components is possible using non-invasive or invasive imaging methods. B) Traditionally, serial IVUS studies have been used to assess the impact of systemic medications on plaque changes. The graph shows a selected number of studies with respect to the average change in PAV against the achieved LDL-C. C) Four images of a lipid-rich plaque with a large plaque burden and a small lumen area in a single coronary location of one patient imaged by coronary computed tomography angiography (CCTA; non-invasive), intravascular ultrasound (IVUS; invasive), optical coherence tomography (OCT; invasive) and near-infrared spectroscopy (NIRS; invasive). D) Intracoronary imaging has helped us to understand the pathophysiology of acute coronary syndromes (ACS) with respect to the underlying cause of the coronary thrombosis. For rupture and thin-cap fibroatheroma (TCFA), drug-eluting stents (DES) are the most common local treatment; drug-coated balloons (DCBs) are emerging as an alternative, but confirmatory studies are still ongoing. E) Patients with uncomplicated plaques that portray high-risk characteristics (i.e., large plaque burden, lipid-rich and reduced lumen area), but fractional flow reserve (FFR) >0.80, are being randomised to test whether pre-emptive local therapies, either stents or DCBs, can modify their natural history. LDL-C: low-density lipoprotein cholesterol; PAV: percentage atheroma volume
How to assess atherosclerotic plaque size and its components
The most used coronary imaging modalities are either non-invasive, such as coronary computed tomography angiography (CCTA), or invasive, such as intravascular ultrasound (IVUS) or optical coherence tomography (OCT) and their combination with near-infrared spectroscopy (NIRS).
Plaque
Plaque (also known as atheroma) refers to the material located between the lumen area (at the interface between the space where the blood flows and the vessel wall) and the outermost (trailing) edge of the media, which coincides with the location of the external elastic membrane (EEM) or lamina (EEL).
Plaque burden is the preferred metric to describe the relative amount of plaque area that is contained within the vessel area and is defined as the plaque area divided by the vessel area (reported as a percentage).
Plaque components determine its vulnerability; the following tissue types can be detected by coronary imaging (Supplementary Table 1).
Lipid core and necrotic core
Lipid plaque and necrotic core tissue (Figure 1, Moving image 1) were described by Rudolf Virchow, who used the term “atheroma” to describe a dermal cyst consisting of a fatty mass encapsulated within the fibrous cap, analogous to the capsule containing an abscess, that is vulnerable to rupture1. NIRS is the only imaging modality that is validated and approved for detection of lipid in the vasculature. NIRS is included in hybrid imaging probes: IVUS/NIRS or OCT/NIRS.
NIRS presents the data in a chemogram, a two-dimensional map of the plaque composition. Segments with a high probability of having lipid cores are shown in yellow, while those with a low probability of lipid are displayed in red. NIRS data are summarised as the lipid core burden index (LCBI), which is the amount of lipid in a scanned artery, and the maximum LCBI within any 4 mm pullback length (LCBI4mm) is commonly used to represent the amount of lipid in a coronary segment of 4 mm length2 (Figure 1, Moving image 1).
Greyscale IVUS or OCT, used without NIRS, as well as CCTA can also detect lipid contents (Figure 1, Moving image 1).
More specifically, on IVUS, hypoechogenic (also named echolucent) and attenuated plaques have been associated with lipid and necrotic core content in histological studies345. However, greyscale IVUS is less accurate than NIRS in identifying lipid tissue and, in addition to that, there is high interobserver variability in the reading/interpretation of IVUS for plaque phenotypes6. Therefore IVUS/NIRS should be preferred over greyscale IVUS alone for the detection of lipid-laden plaques3.
Virtual histology IVUS (VH-IVUS) use is limited to a few clinical centres worldwide. It visualises 4 distinct plaque components: fibrous (depicted in dark green), fibrofatty (light green), necrotic core (red), and calcium (white)7. Using VH-IVUS, fibroatheroma is defined by the presence of >10% confluent necrotic core. Thin-cap fibroatheroma (TCFA) is said to be present if more than 36 degrees (30 degrees in the PREVENT study – see below8) of the necrotic core is in direct contact with the lumen in 3 or more consecutive frames; otherwise it is defined as thick-cap fibroatheroma. VH-IVUS is limited, however, in terms of assessing fibrous cap thickness (FCT) because of its poor axial resolution (Figure 1B, Moving image 1).
OCT lipidic pool and necrotic core are defined as a hyporeflective (low-signal) region with diffuse borders that is covered by a fibrous cap which has a high signal attenuation9. The thickness of the fibrous cap is used to classify lipid-rich plaques as thin- (TCFA – cutoff of <65 μm) or thick-cap fibroatheromas. For reproducible fibrous cap thickness analysis, we propose the use of automated software developed for this purpose instead of a manual measurement.
CCTA uses attenuation, expressed in Hounsfield units (HU), to differentiate between calcified plaques with higher attenuation and non-calcified plaques with lower attenuation. The recommended threshold for the definition of low-attenuation plaques is <30 HU, although attenuation is affected by some CCTA acquisition parameters such as lumen attenuation and tube voltage. These plaques have been shown to correlate with lipid-rich plaques assessed by IVUS in relatively small studies101112 (Figure 1A, Moving image 1).
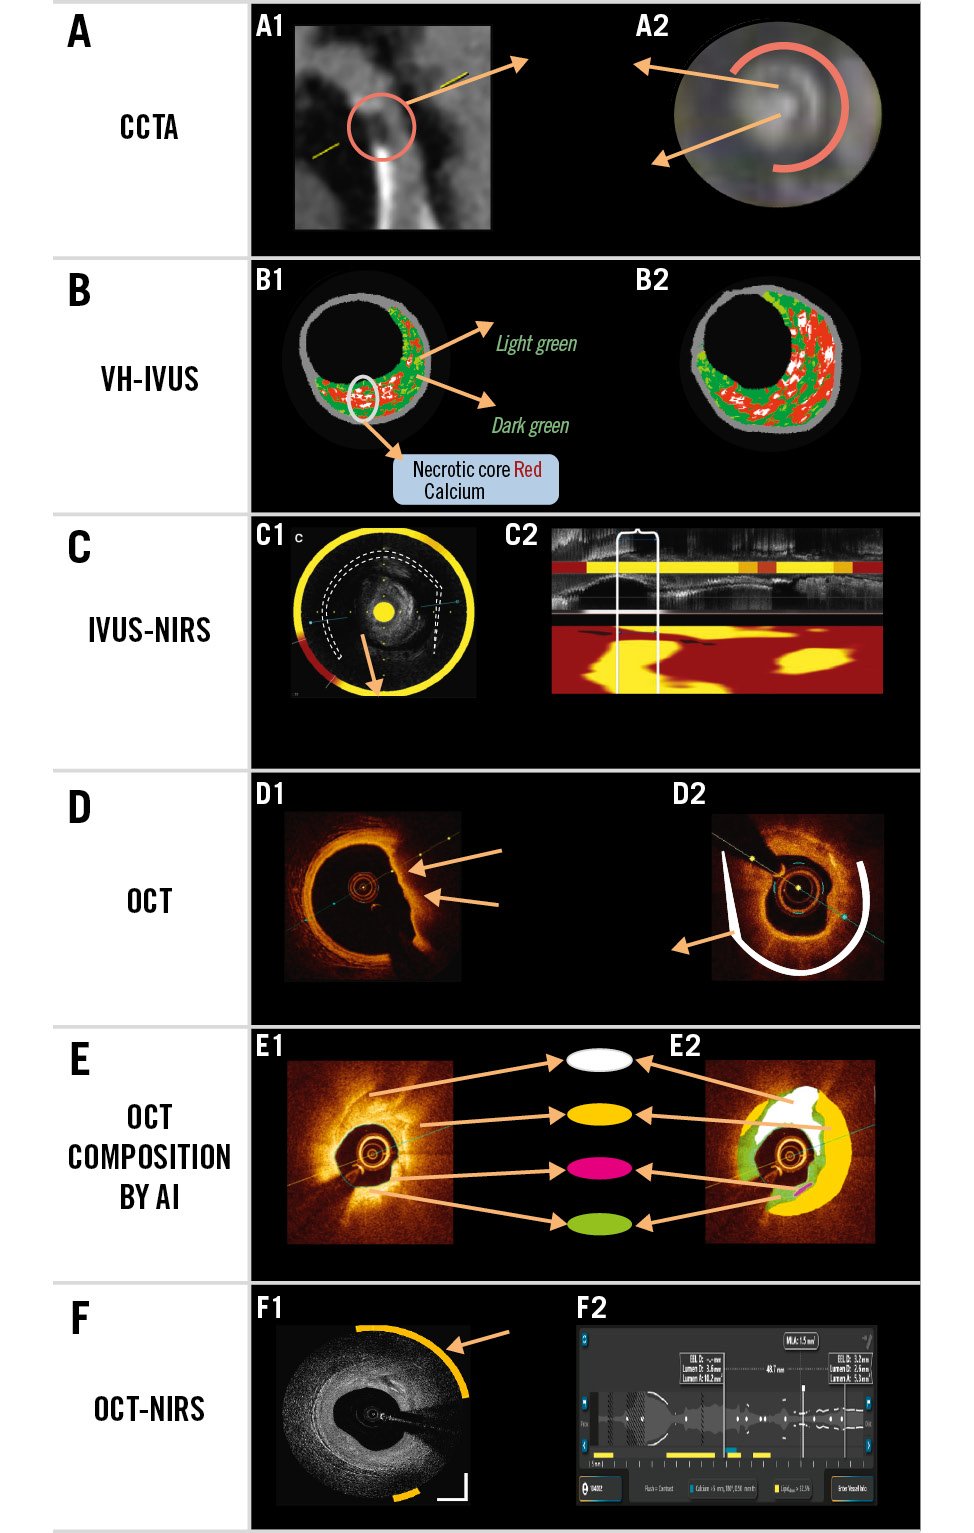
Figure 1. Lipid- and necrotic core-rich plaques. Examples of lipid-rich plaques using different imaging modalities. A) Coronary computed tomography angiography (CCTA). A1) Plaque with low Hounsfield units (HU) which corresponds to a napkin-ring morphology plaque, as shown in the cross-section (A2). B) Virtual histology (VH)-intravascular ultrasound (IVUS) shows 4 tissue types; the large amount of necrotic core abutting the lumen is suggestive of thin-cap fibroatheroma. C) IVUS near-infrared spectroscopy (NIRS) shows cholesterol content regions in yellow on the same IVUS frame (C1) and on the chemogram (C2; shown below the longitudinal IVUS view) representing the entire length of the imaged vessel; a lipid core burden index (LCBI) >400 is deemed to confer high risk for future events. D) Optical coherence tomography (OCT) indirectly provides insights into lipid content in the vessel wall. Hyporeflective (low-signal) sectors with diffuse borders have been associated with lipid content. E) Artificial intelligence (AI) algorithms applied to OCT images colour code the tissue contents of the vessel wall. F) OCT in combination with NIRS is also available. F1) An OCT frame: the yellow arc indicates the sector in which the lipid is located. F2) The longitudinal viewport: the lipid colour bar shows the longitudinal location where lipid is ≥user-defined threshold (Moving image 1, Supplementary Figure 1, Supplementary Table 1).
Calcium
Coronary angiography has low to moderate sensitivity compared to IVUS, OCT, or CCTA to identify coronary calcification13.
On IVUS, calcium is shown as a hyperechoic (echodense) structure brighter than the reference adventitia with shadowing of deeper vascular tissue structures. IVUS has high sensitivity (89-90%) and specificity (97-100%) for detecting calcium deposits within a plaque13. However, it has shown limited sensitivity (64%) in visualising accumulation of microcalcification (≤0.05 mm)14 (Figure 2, Moving image 2).
Qualitative assessment includes the evaluation of the distribution patterns of coronary calcification:
(a) superficial: the leading edge of acoustic shadowing is within the shallowest 50% of the plaque and media thickness.
(b) deep: the leading edge of acoustic shadowing is within the deepest 50% of the plaque and media thickness13.
As an ultrasound beam cannot penetrate calcium, the thickness of its reflection in a greyscale IVUS image is a function of transducer saturation by the reflected ultrasound energy and not by the real anatomical thickness13. Therefore, calcium thickness, area, and volume cannot be measured by IVUS. Nevertheless, the presence of a smooth surface with reverberations (secondary false concentric echoes at reproducible distances between the IVUS transducer and the calcium leading edge) has been associated with thin calcium by OCT15.
In OCT evaluation, calcium is hyporeflective (i.e., a signal-poor, dark region) with sharply delineated borders. OCT has shown a sensitivity for the detection of calcium ranging between 85.4% and 96% and a specificity of 97-100% using pathology as a gold standard14. In a head-to-head comparison between IVUS and OCT, Wang et al reported that in 13.2% of IVUS-detected calcium, calcium was either not visible by OCT or was underestimated due to superficial OCT plaque attenuation14 (Figure 2, Moving image 2).
In contrast to IVUS, OCT can penetrate calcium and in most cases visualise its trailing edge, thereby allowing a three-dimensional assessment by evaluating (a) angle (degrees), (b) length (measured in mm), and (c) thickness (measured in mm), and, therefore, its area and volume16.
Calcium burden, assessed by IVUS or OCT, is important for percutaneous coronary intervention (PCI) planning, and algorithms (some using artificial intelligence [AI]) have been developed and validated that predict stent underexpansion with accuracy181920 (Figure 2, Moving image 2).
Coronary artery calcium (CAC) assessment by CCTA, reported as a calcium score, has been shown to be a strong predictor for incident cardiovascular disease events and is currently considered a reliable surrogate marker for screening of CAD21. The Agatston scoring method is one of the most common methods used for CAC scoring, and a calcium score of 0 has been reported to reflect a very low risk for cardiovascular events, especially in asymptomatic patients. However, due to the limited spatial resolution of computed tomography (CT) scans, a zero CAC score does not eliminate the possibility of calcium flecks or softer plaques2122.
In addition to cardiovascular risk assessment, CCTA provides an accurate characterisation of coronary atherosclerosis (i.e., plaque burden, plaque volume, tissue characterisation)2223. However, severe calcification can limit lumen assessment due to blooming artefacts and yield an overestimation of lesion severity, thus decreasing the specificity of CCTA, although photon-counting CT has fewer artefacts. Calcium can be reported based on CCTA as (a) angle (degrees) and (b) length (mm). Thickness and area are also impacted by blooming artefacts.
Finally, CCTA has the potential to identify microcalcifications, which have been suggested to be a frequent feature in some unstable plaques. In CCTA, spotty calcification is defined as a small, dense (>130 HU) plaque component surrounded by non-calcified plaque tissue. The cutoff to define a calcification in CCTA as spotty is <3 mm2223. Small spotty calcification has the strongest association with vulnerable plaque features defined by IVUS24.
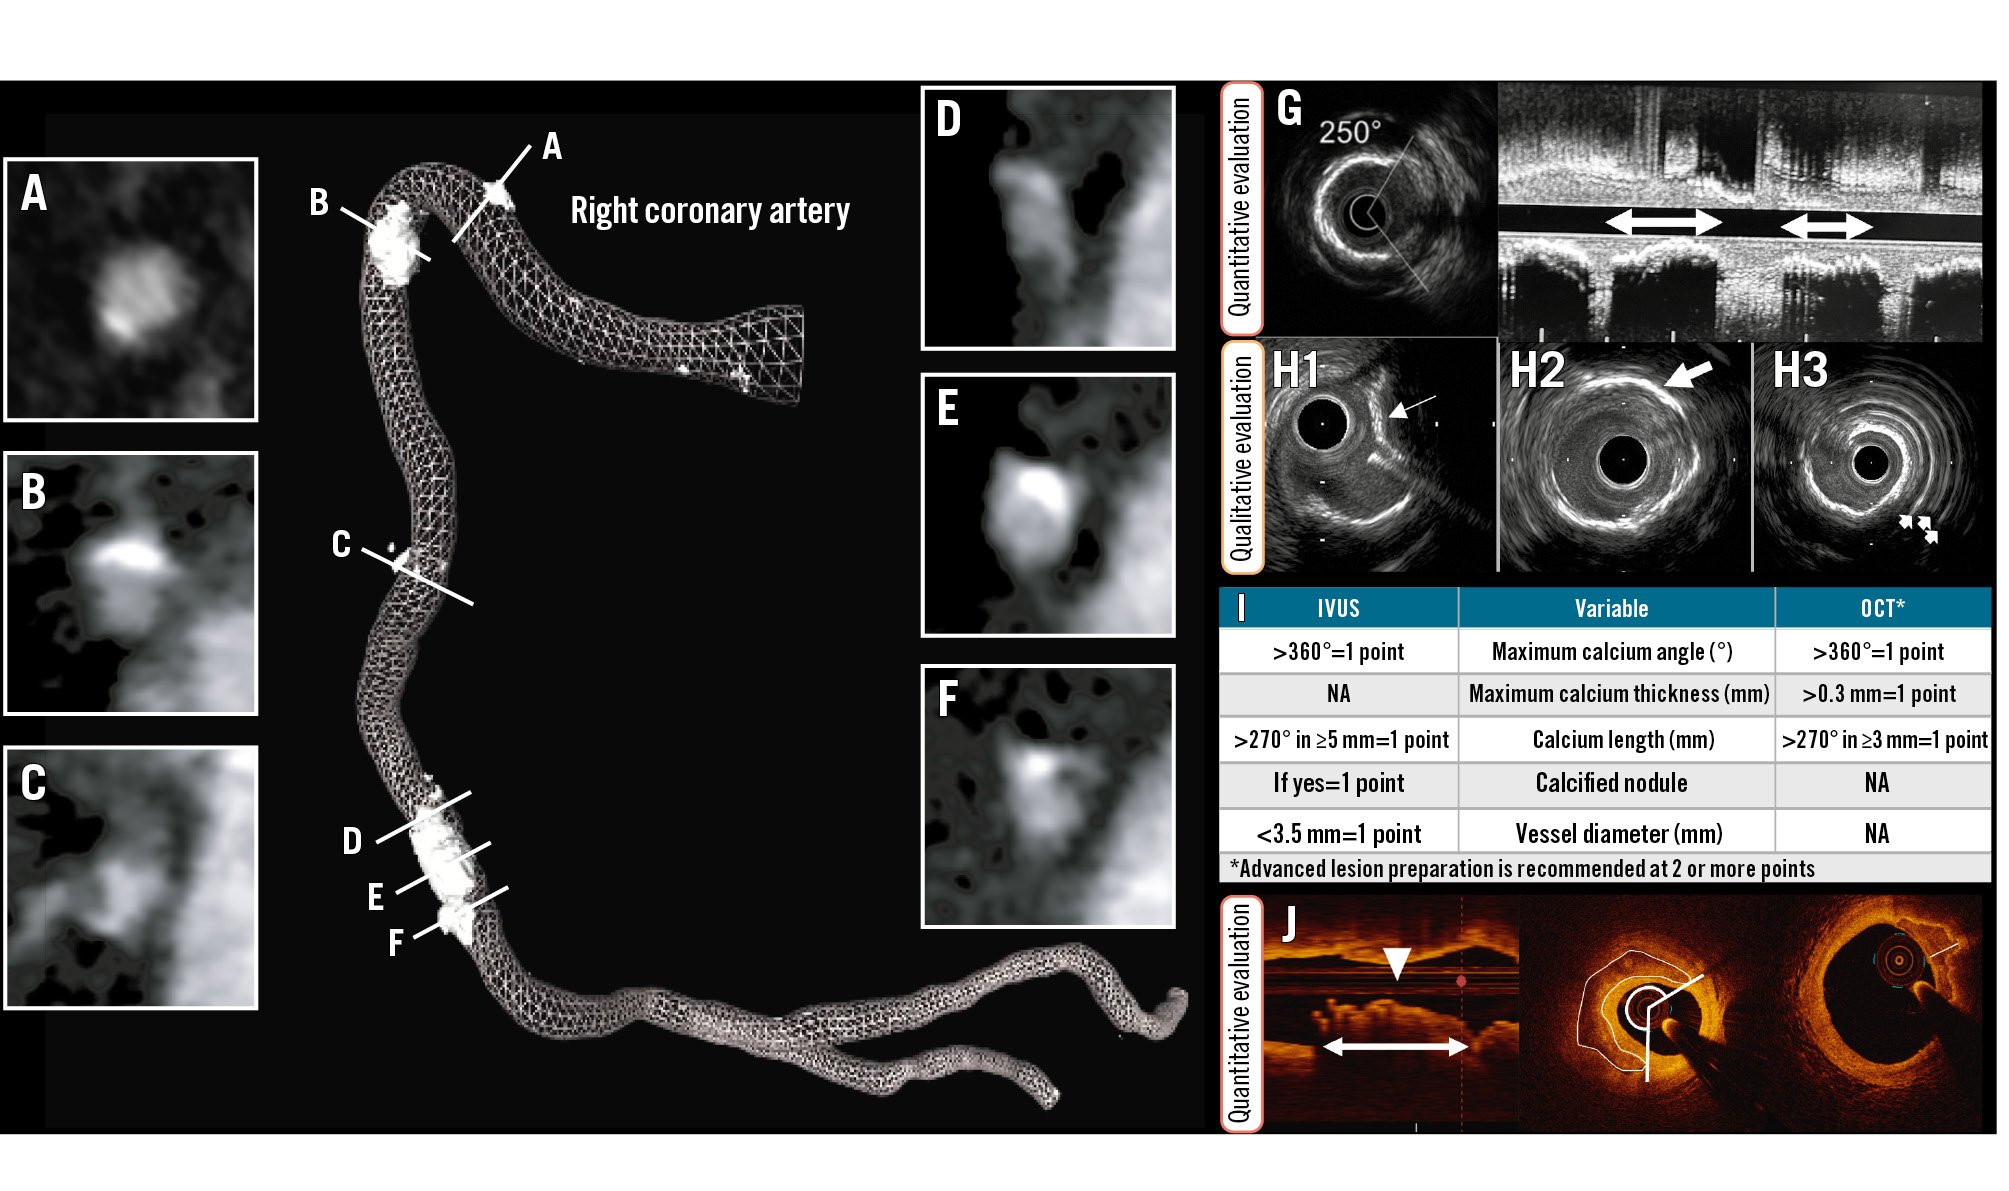
Figure 2. Calcified plaques. Non-invasive, coronary computed tomography angiography (left) provides information about the extent of calcification. The right coronary artery image shows the lumen profile (mesh) and the length of spots of calcification. Cross-sectional views from (A) to (F) depict the circumferential extent of calcium. From these images, the angle, density, area and thickness of the calcium can be measured. G) By intravascular ultrasound (IVUS), the arc and the length of calcium can be measured. H) Further, the nodular appearance (H1; white arrow) and location within the plaque such as deep calcium (H2; white arrow) and superficial calcium (H3; white arrows represent the reverberations from the superficial calcium) can be identified. J) By optical coherence tomography (OCT) also, the length, area, and thickness of calcification can be quantified. These variables have been used to derive two calcium scores, as shown in (I). (Moving image 2). NA: not applicable
Fibrous tissue
In early phases of the disease, fibrous tissue is the most prevalent tissue type in atherosclerotic plaques7. By IVUS, it is recognised as a homogeneous and normoechogenic structure, while on OCT it shows as a bright, hyperreflective tissue.
Macrophages
By OCT, macrophages appear as confluent multiple bright spots which cast dorsal shadowing9. Histopathology studies showed that OCT can detect the presence of macrophages over a fibrous cap, but it has a limited efficacy in identifying these microstructrures across the entire plaque. AI methods have been introduced to improve the reproducibility of macrophage detection25, as a recent report has also shown moderate to low correlation between the estimations of experts using two different OCT catheters26. Thus, it is highly recommended to take into account the limited precision of the modality when reporting the presence of macrophages in OCT images.
Cholesterol crystals
Cholesterol crystals appear as bright (with high reflectivity), sharp and well-delineated lines, without a clear dorsal shadow; they are sometimes multiple and stacked on top of each other. In comparison with histology, OCT has low to moderate sensitivity but high specificity for detecting these components27.
Microvessels
Microvessels are small (diameter of 50-300 μm) voids that are well demarcated, tend to concentrate in the intima, and have the same appearance as the lumen (signal-poor). They are present in multiple contiguous frames (>3) and can be seen to communicate with the lumen and/or with the adventitia. Three-dimensional OCT can show the complete network28. A histology study showed moderate sensitivity and specificity of the modality to detect plaque vascularisation (52% and 68%, respectively)29.
Thrombus
Thrombus is a mass prolapsing and/or floating into the lumen and is easily detected by OCT30; thrombus may be attached to the lumen and, in this setting, is usually mixed with some other tissue and may be hard to delineate. There are three types: red thrombus (erythrocyte-abundant), which is hyperreflective at the rim facing the OCT catheter and attenuated with dorsal shadowing in its depth; white thrombus (platelet-abundant), which is homogeneous with low attenuation; and mixed thrombus, which portrays a combination of both red and white thrombi characteristics9 (Figure 3, Moving image 3). Due to its unsurpassed resolution, OCT is currently considered the gold standard for the diagnosis of intracoronary thrombus.
IVUS can also recognise intraluminal masses which appear heterogeneous (i.e., present with different echogenicities) as well as those with different degrees of attenuation depending on their age and composition31. However, precise recognition may be challenging because of its limited resolution. It is, therefore, highly recommended to use moving images (i.e., loop or dynamic review, or simply go back and forth frame by frame) to better detect it and delineate thrombus extension; the latter may be difficult, however, if the thrombus is attached to the wall since thrombus may appear as a continuum with the underlying plaque.
CCTA has limited capabilities for thrombus detection. Thrombus appears as an irregular-shaped plaque with significant intraluminal protrusion3233. Similarly to OCT and IVUS, CCTA cannot distinctively measure thrombus as it is mixed with the underlying plaque. Therefore, it is often measured all together as plaque burden and the HU can be used to indicate the heterogeneous composition (Figure 3, Moving image 3).
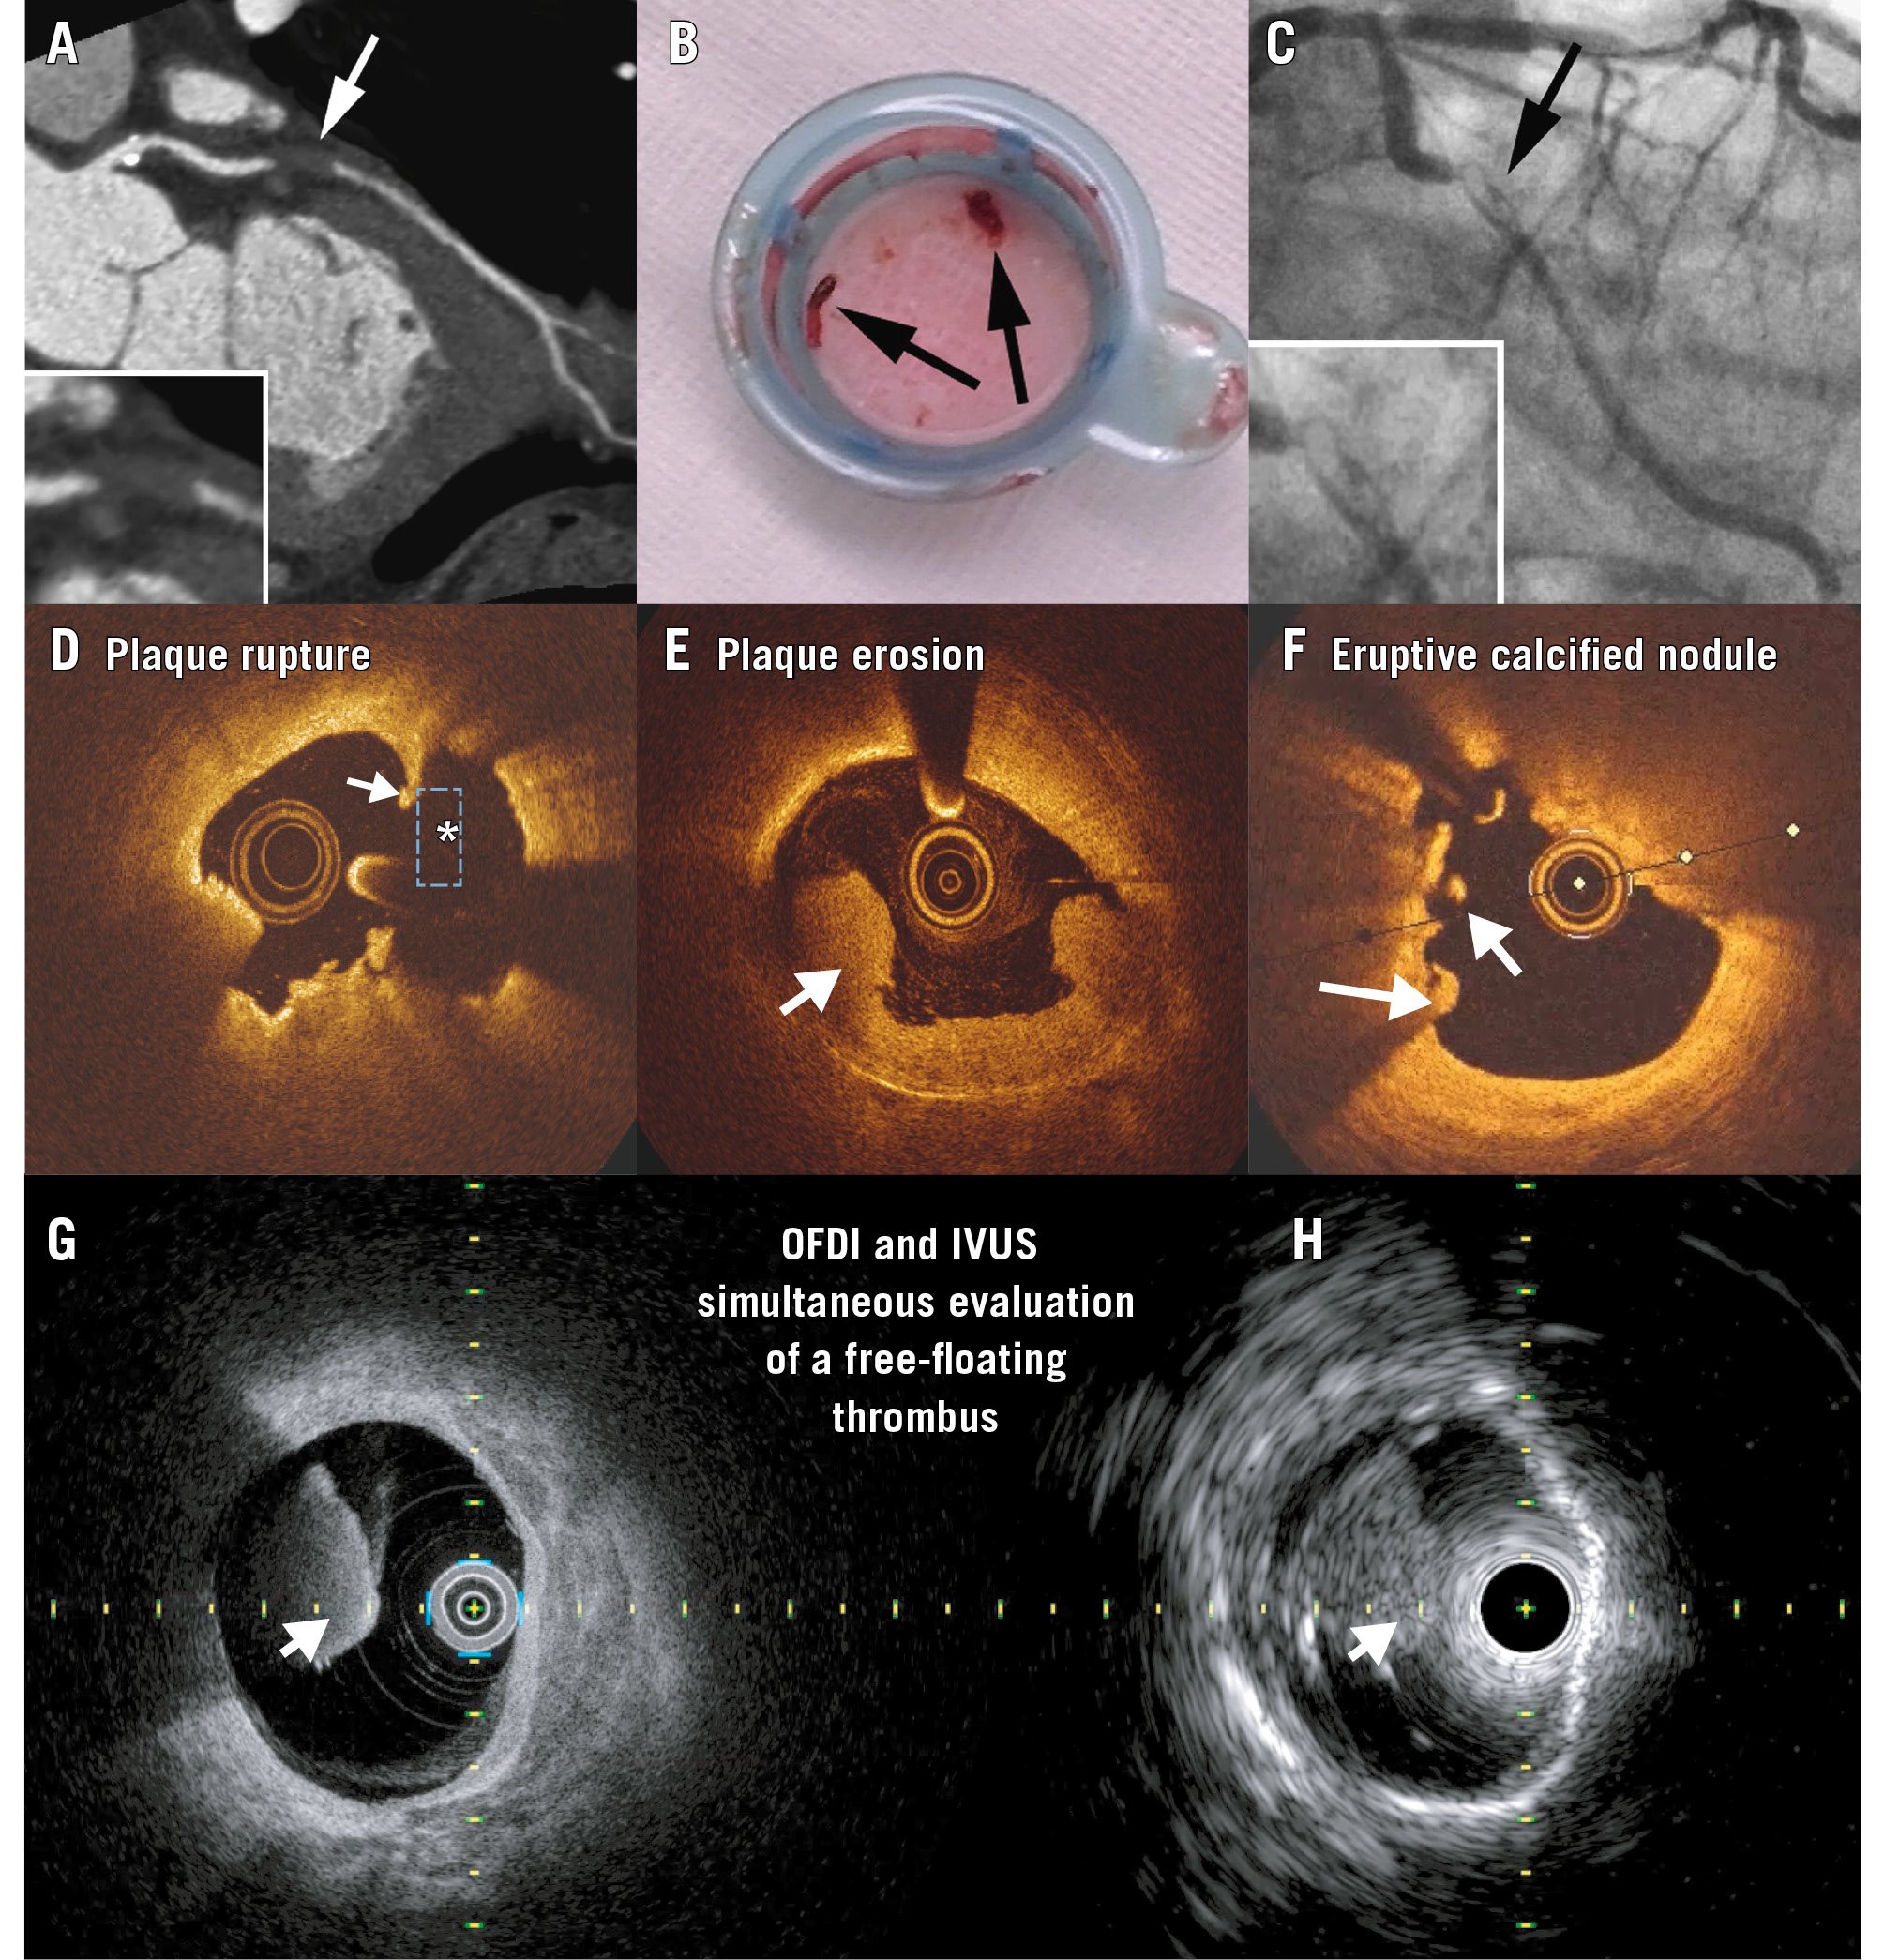
Figure 3. Thrombotic lesions. A-C) A case example of a patient admitted for chest pain who was imaged with coronary computed tomography angiography (A), which showed the lumen was occupied with a low Hounsfield unit lesion. On the same day, the patient was diagnosed with coronary thrombosis, as shown in (B) and (C). D-H) Optical coherence tomography examples of red thrombus (white arrow) in a patient with a ruptured plaque (D). The asterisk shows the cavity, and the white arrow indicates the remnants of the fibrous cap. White thrombus is seen in (E), and (F) shows one floating mass and another mass attached to the vessel overlying an eruptive calcified nodule. The Dual Sensor hybrid IVUS-OCT catheter system was developed by Terumo (Japan) by merging IVUS and optical frequency domain imaging (OFDI) probes. G,H) A red thrombus simultaneously imaged with this Dual Sensor system. (Moving image 3). A-C) Adapted with permission from33. G,H) reproduced with permission from Terumo, Tokyo, Japan. IVUS: intravascular ultrasound; OCT: optical coherence tomography
Plaque phenotypes
Intravascular imaging studies have adopted, non-systematically, some pathological terms to describe the appearance of the plaques, e.g., TCFA, which mimics pathological descriptions. We therefore propose that all intravascular imaging-defined plaque types consistently follow the relevant pathological descriptions (Figure 4, Moving image 4).
In addition, we propose that the plaque’s name should emphasise the coexistence of some plaque characteristics which have been shown to be prognostically relevant. These are (i) a Large plaque burden (>70%), which is the strongest predictor of future events and therefore will be named “L1”; (ii) a Lipid-rich composition, which will be indicated by “L2”; this will be used when, by OCT/IVUS, the hyporeflective/hypoechogenic region with diffuse contours is >1 quadrant, or, by NIRS, the maximum LCBI is >400; and (iii) a small Lumen area, which will be indicated if the minimum lumen area of the lesion is <4 mm2, named “L3” (Figure 5, Moving image 5).
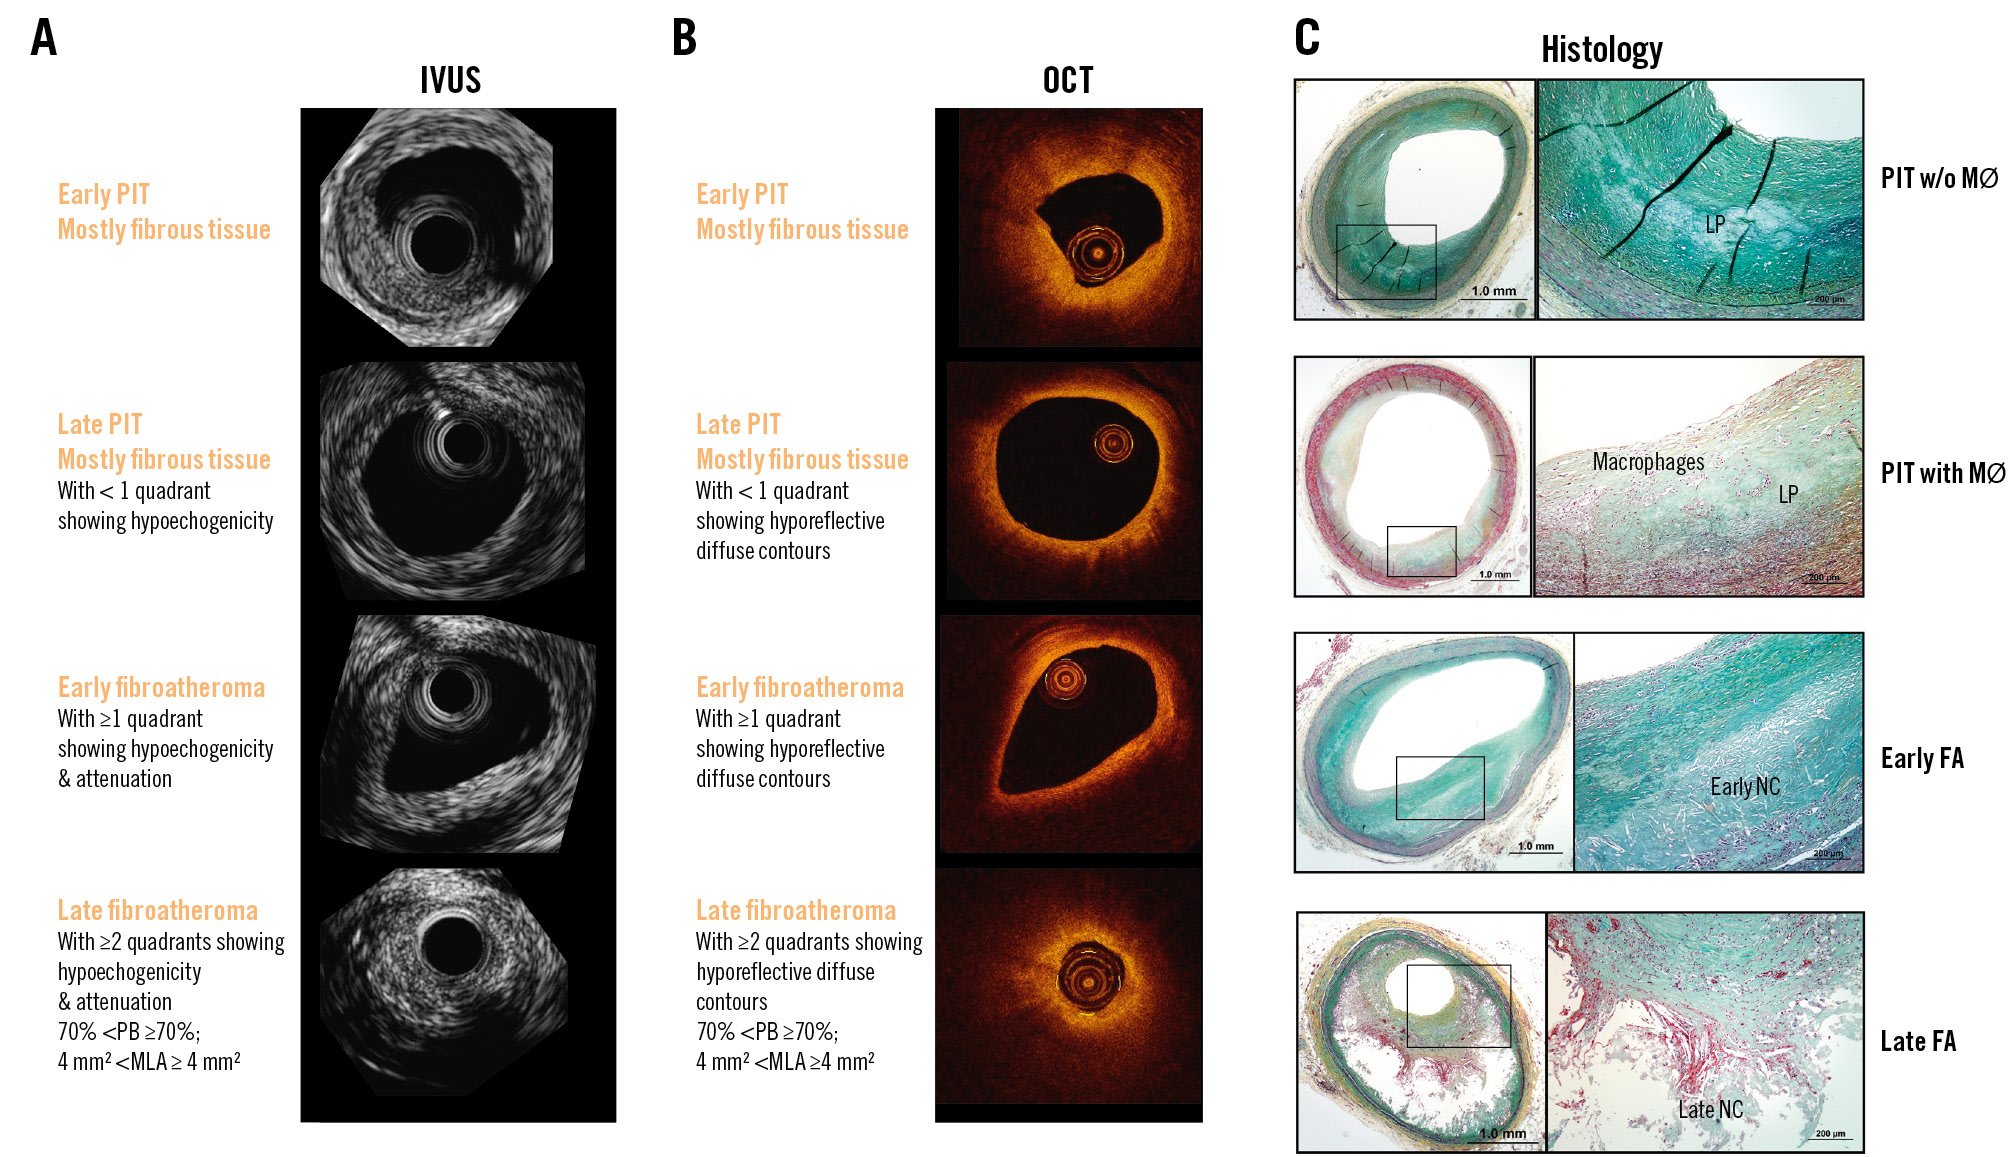
Figure 4. Plaque types: revised nomenclature. Corresponding frames for IVUS (A), OCT (B), and histology (C). The top row shows a pathological intimal thickening plaque which is mostly normoechogenic by IVUS and hyperreflective by OCT. The second row also shows a pathological intimal thickening plaque which portrays more hypoechogenic tissue by IVUS and hyporeflective tissue with diffuse contours by OCT. OCT may show some macrophages, and therefore the “+” sign could be added to indicate the additional plaque characteristics. The third row depicts an early fibroatheroma with >1 quadrant of hypoechogenicity and attenuation by IVUS and by OCT, also with >1 quadrant of hyporeflective tissue with diffuse contours. The fourth row shows a late fibroatheroma plaque with high-risk plaque characteristics such as large plaque burden and reduced lumen area. (Moving image 4). Adapted with permission from101. FA: fibroatheroma; IVUS: intravascular ultrasound; LA: lumen area; LP: lipid pool; MØ: macrophages; MLA: minimum lumen area; NC: necrotic core; OCT: optical coherence tomography; PB: plaque burden; PIT: pathological intimal thickening
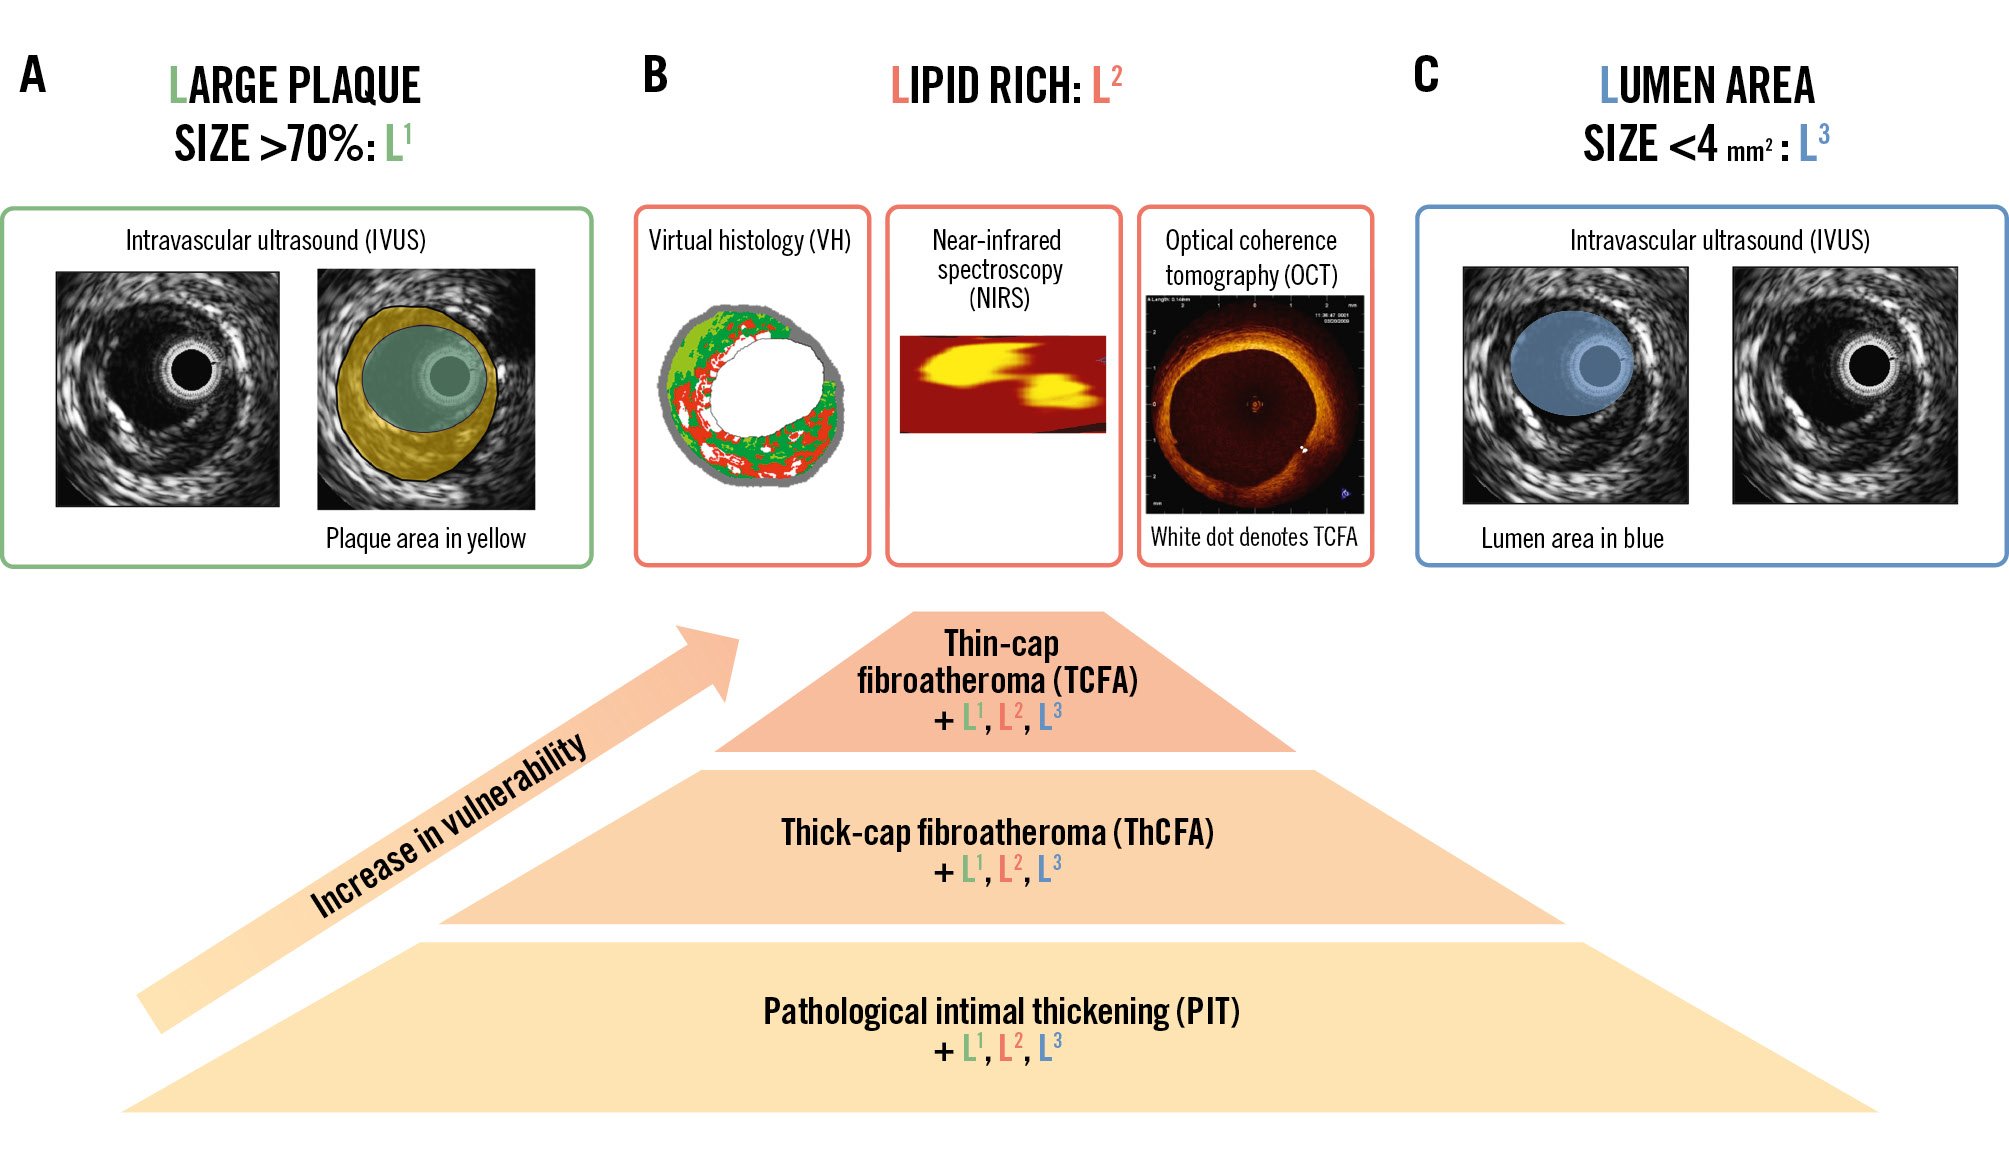
Figure 5. Main high-risk plaque characteristics. A) Commonly found high-risk plaque characteristics include large plaque size >70% – also called L1. Note the plaque area shaded in yellow, which is usually reported in mm2. Plaque size >70% is calculated as the ratio of the plaque area divided by the vessel area, which is called plaque burden. Secondly, the lipid (L2) content is also a marker of increased risk. As shown in Figure 2, there are many options for lipid characterisation. Lastly, a luminal (L3) area less than 4 mm2 is also associated with poor long-term outcomes. These L1, L2, and L3 plaque characteristics in addition to the PIT, TCFA and ThCFA should be reported. For example, a TCFA+L1+L2+L3 means that it is a TCFA whose plaque size is >70%, lipid content is large, and minimum lumen area is >4 mm2. B) It has been proposed that vulnerability increases from PIT through ThCFA to TCFA. (Moving image 5).
Pathological intimal thickening
By IVUS, pathological intimal thickening (PIT) is mostly normo- or hyperechogenic, alluding to its predominant fibrotic composition. We propose adding “plus” or “+” with “L1” and/or “L3” to the name if a large plaque burden and reduced lumen are present.
By OCT, it is mostly hyperreflective. “Plus” or “+” with “L1” and/or “L3” may be added accordingly.
Fibroatheroma
All fibroatheromas (FAs) are lipid-rich plaques, and therefore “L2” may or may not be added to the name.
By IVUS, an FA is a mixed plaque consisting of some hyperechogenic tissue and more than one quadrant of hypoechogenic tissue; this sector containing the hypoechogenic tissue may have some attenuation.
We propose adding “plus” or “+” and “L1” to the name when plaque burden is more than 70% and/or “L3” when the minimum lumen area <4 mm2.
By OCT, an FA is also a mixed plaque appearing as hyperreflective tissue and more than one quadrant of hyporeflective tissue; we also propose adding “plus” or “+” and “L1” to the name when plaque burden is more than 70% (for newer-generation OCT technologies) or “L3” if a minimum lumen area <4 mm2 is present.
Thin-cap fibroatheroma
TCFA is defined as a lipid plaque covered by a thin (<65 μm) fibrous cap. Similarly, we propose adding “plus” or “+” and “L1” to the name when the plaque burden is >70% or “L3” when a minimum lumen area <4 mm2 is present. For a plaque to be called a “fibroatheroma”, a large lipid content is required.
Fibrocalcific
The term fibrocalcific (FC) describes mixed plaque in which dense calcium is present in more than one quadrant. These plaques may also portray a large plaque burden (L1), lipid-rich sectors (L2), or a reduced minimum lumen area (L3), and these specific traits should be noted in the plaque name, for example, FC plus L1 and L3, etc.
Plaque rupture
Plaque rupture (PR) presents as a plaque ulceration (cavity) with a tear detected in a fibrous cap. Its cavity within the plaque communicates with the lumen with or without an overlying fibrous cap fragment. OCT is the best technique to detect PR, but not all plaque ruptures are detected by greyscale IVUS or OCT because the cavity is often filled with thrombus (Figure 3, Moving image 3).
Plaque erosion
Currently plaque erosion (PE) cannot be reliably diagnosed by IVUS, NIRS, or CCTA due to their limited resolution. OCT has an unsurpassed resolution, but it is still insufficient for visualising the endothelial lining. Therefore, the pathological definition of erosion cannot simply be adapted for the OCT definition (Figure 3E, Moving image 3).
We therefore suggest the following definition of plaque erosion: a thrombotic lesion without fibrous cap disruption when coronary embolism has been ruled out.
There have been other definitions of PE in the literature. 1) A culprit lesion with or without an intact fibrous cap, emphasising that visualisation of the endothelial layer was not possible in eroded plaques, despite its unique axial resolution3. 2) Another definition proposed using the term “OCT-erosion” instead of erosion. “OCT-erosion” was defined and categorised according to the absence of fibrous cap disruption associated with the presence of thrombus. “Definite” OCT-erosion was defined as the presence of attached thrombus overlying an intact and visible plaque. Alternatively, “probable” OCT-erosion was defined by (1) luminal surface irregularity at the culprit lesion in the absence of thrombus or (2) attenuation of underlying plaque by thrombus without superficial lipid or calcification immediately proximal or distal to the site of thrombus. This is in clear contrast to the pathological definition of erosion that requires the presence of attached thrombus34. In the clinical setting, however, we may assume in some cases that thrombus might have vanished by the time of the imaging.
We acknowledge that there is an inherent limitation of OCT for the diagnosis of plaque erosion, and that is the presence of significant thrombus overlying the culprit lesion, which may prevent visualisation (due to shadowing) of an underlying plaque rupture. However, the predominant type of thrombus in patients with plaque erosion (75% of patients) is white thrombus, which should not obscure the underlying plaque. However, these definitions remain highly controversial, and the risk of OCT overdiagnosis exists. Too many different types of plaques are probably lumped together in the intact fibrous cap category. Likewise, the advancement of thromboaspiration catheters may disrupt not only thrombus but also the underlying plaque. It remains impossible to ascertain whether some of the observed plaque ruptures are spontaneous or rather a result of a mechanical trauma (including a Dotter effect) on thin- or thick-cap fibroatheromas. Iatrogenic mechanical disruption of the culprit lesion by bulky thromboaspiration catheters remains a possible reason for misclassification.
ERUPTIVE CALCIFIED NODULES
By IVUS evaluation, eruptive calcified nodules (ECNs) appear as a convex calcified shape of the luminal surface with irregular leading edges (Figure 2, Moving image 2). Thrombus overlying this plaque may not be visualised by IVUS due to its limited resolution.
By OCT, ECNs appear as confined superficial calcification protruding into the lumen with disruption of the fibrous cap and associated thrombosis.
Thus, in describing plaque, the term ECN is exclusively to be used for “complicated” ECNs which are associated with thrombus and disruption of the overlying cap35. Some ECNs may actually also induce major dorsal shadowing on OCT9. This is in line with the pathological description in which a definition of ECN requires the presence of fibrous cap disruption and luminal thrombus.
NON-ERUPTIVE CN (NODULAR CALCIFICATION)
Nodular calcification has a similar appearance to an ECN, but it has an intact fibrous cap (i.e. non-eruptive), and in some lesions with stable protruding nodular calcifications, a bright leading edge with dorsal shadow may mimic an overlying thrombus and generate a misdiagnosis of an eruptive CN. However, the surface of a true eruptive CN tends to be more irregular, which allows, together with the clinical scenario, the correct diagnosis in most situations.
Intraplaque haemorrhage
We propose the following definitions to standardise reporting, but note some considerations in the subsequent paragraph:
By OCT, intraplaque haemorrhage appears as a hyporeflective core without dorsal attenuation.
By IVUS, intraplaque haemorrhage presents as a hypoechogenic core without attenuation.
Plaque haemorrhage is frequently seen in pathological specimens but its recognition by intracoronary imaging remains challenging. A pathological study evaluated 101 coronary arteries from 56 autopsy hearts using 40 MHz IVUS and NIRS and compared the imaging findings to histopathology. Segments with intraplaque haemorrhage had more fibroatheromas with a greater IVUS plaque burden, a greater prevalence of IVUS echolucent zones, and a higher NIRS lipid core burden index36.
The combined use of high-definition IVUS and OCT appears to be able to provide better intraplaque resolution and some important diagnostic clues in patients with intraplaque haemorrhage. Nevertheless, new studies are required to understand what are the best morphological criteria required for the diagnosis of intraplaque haemorrhage and whether intracoronary imaging is still simply unable to obtain a reliable diagnosis of this challenging anatomical entity in our patients37.
Should imaging-verified high-risk plaques be treated mechanically with local devices regardless of physiological (functional) lesion severity?
In 2006, for the first time, it was demonstrated that plaque composition assessed by IVUS-integrated backscatter analysis was able to differentiate plaques that remained quiescent from those that progressed and caused events38; ever since, there have been numerous similar studies reported. In the PROSPECT study, 697 patients were included, all with an acute coronary syndrome (ACS) that had successful revascularisation and three-vessel VH-IVUS7. This study demonstrated that lesions with a small lumen area (<4 mm2), increased (>70%) plaque burden, and a TCFA phenotype were at risk of causing events39. The prognostic implications of a TCFA phenotype was also confirmed by the VIVA study40, while the ATHEROREMO-IVUS41 study showed that plaque burden and its phenotype, as assessed in a single vessel by VH-IVUS, provided useful prognostic information and was able to identify patients at risk of suffering a major adverse cardiovascular event (MACE)4041. Taken altogether, these three studies showed that a large plaque burden (L1), plaque rich in lipid (L2), and plaque with a small residual minimum lumen area (L3) were associated with poor prognosis (Figure 5, Moving image 5).
Despite the consistency of the data, the low positive predictive value of the VH-IVUS-derived plaque characteristics reported in these studies – range 18-24% – created scepticism about the potential clinical value of IVUS in stratifying cardiovascular risk and detecting high-risk plaques42. Due to these results, VH-IVUS use is decreasing in the clinical arena.
Subsequently, research focused on alternative intravascular imaging techniques such as NIRS-IVUS and OCT. The ATHEROREMO-NIRS study included 203 patients undergoing coronary catheterisation. It was found that patients with an increased lipid component (above the median) had a 4-fold increased risk of adverse cardiovascular events at 1-year follow-up43. Similarly, the Lipid Rich Plaque (LRP) study included 1,563 patients with suspected coronary artery disease who underwent invasive coronary angiography. NIRS-IVUS imaging in the non-culprit vessels showed that an increased max LCBI4mm was an independent predictor of MACE at patient- (hazard ratio [HR] 1.18, 95% confidence interval [CI]: 1.05-1.32; p=0.0043) and lesion-level analyses (HR 1.89, 95% CI: 1.26-2.83; p=0.0021)2. In line with these findings, the PROSPECT II study44 recruited 898 patients admitted with an ACS who had undergone successful revascularisation and NIRS-IVUS imaging in the non-culprit vessels; these patients were followed up for 3.7 years. During this period, 66 events were reported that were caused from 78 non-culprit lesions; lesions with a large lipid core and increased plaque burden were at a high risk of causing these events (7.0%, 95% CI: 4.0-10.0). Patients with these lesions had a 4-year non-culprit lesion-related MACE rate of 13.2% (95% CI: 9.4-17.6).
Finally, two prospective OCT-based imaging studies have confirmed the value of this imaging modality in stratifying risk. In the CLIMA study, 1,003 patients who had been referred for an invasive assessment of the coronary artery anatomy underwent OCT imaging in the left anterior descending coronary artery and were followed up for 1 year. A minimum lumen area <3.5 mm2, the presence of a lipid arc greater than 180 degrees, a thin fibrous cap <75 μm, and the presence of macrophages were associated with a higher incidence of cardiac death or target vessel myocardial infarction. Patients having lesions with all of the above plaque characteristics had an increased risk, with an 18.9% event rate at 1-year follow-up45.
Similarly, in the COMBINE OCT-FFR study that included 390 diabetic patients with intermediate non-flow-limiting lesions assessed by fractional flow reserve (FFR), OCT showed that lesions with a TCFA phenotype were more likely to cause MACE than lesions with different plaque morphologies (13.3% vs 3.1%; p<0.001)46. These findings were also confirmed in a three-vessel OCT imaging study including 883 patients with an acute myocardial infarction (AMI) that underwent successful revascularisation. In this report, a TCFA phenotype (adjusted HR 8.15, 95% CI: 3.67-18.07) and a minimum lumen area <3.5 mm2 (adjusted HR 4.33, 95% CI: 1.81-10.38) were found to be independent predictors of non-culprit lesion-related MACE47.
There have been few studies evaluating local treatment of lesions that portray high-risk plaque characteristics. The SECRITT trial enrolled 23 patients who met the enrolment criteria (presence of non-obstructive VH-derived TCFA lesion with a thin cap on OCT) and were randomised to vShield (n=13; Prescient Medical) versus medical therapy (n=10). vShield is a nitinol self-expanding device which was associated with no device-related MACE at 6-month follow-up48. Then, the PROSPECT ABSORB study randomised patients with an angiographically non-obstructive stenosis that was not intended for PCI but had an IVUS plaque burden of ≥65% to receive a bioresorbable vascular scaffold (BVS) plus guideline-directed medical therapy (GDMT) versus GDMT alone. The primary endpoint, minimum lumen area, was larger in the BVS group, at 6.9 mm2 compared with 3.0 mm2 in lesions treated with GDMT only. A relevant, hypothesis-generating finding was that MACE occurred in 4.3% of BVS-treated patients versus 10.7% of GDMT-only patients at follow-up49.
The PREVENT trial8 included patients with non-flow-limiting (FFR>0.80) vulnerable coronary plaques identified by intracoronary imaging. Patients were randomly assigned (1:1) to either PCI plus optimal medical therapy or optimal medical therapy alone. Vulnerability was defined as having 2 of the following 4 characteristics: a minimum lumen area <4.0 mm2 by IVUS or OCT, a plaque burden of more than 70% by IVUS, a lipid-rich plaque by NIRS (max LCBI4mm >315), or a thin-cap fibroatheroma detected by VH-IVUS (defined as a ≥10% confluent necrotic core with >30° abutting the lumen in three consecutive frames on VH-IVUS) or by OCT (defined as a lipid plaque with arc >90° and fibrous cap thickness <65 μm). Most patients had plaque burden (PB) and minimum lumen area as qualifying criteria. At 2 years, target vessel failure (the primary outcome) occurred in 3 (0.4%) patients in the preventive percutaneous coronary intervention group and in 27 (3.4%) patients in the optimal medical therapy group (absolute difference –3.0 percentage points [95% CI: –4.4 to –1.8]; p=0.0003). The authors concluded, “The PREVENT study findings support an expansion of the indications for percutaneous coronary intervention to include non-flow-limiting, high-risk, vulnerable plaques.” However, information as to whether the events during follow-up were related to the randomised plaques has not been provided yet. To effectively translate these results into clinical practice would require that all patients undergo three-vessel FFR and invasive imaging, which are not widely available. Previous studies also showed that invasive imaging does not reach every segment in the coronary tree, and often the MACE that arise during follow-up come from non-imaged lesions. Therefore, CCTA (plus CT-derived FFR) could be an excellent screening tool to target vessels more efficiently for FFR and invasive imaging.
In addition, several prospective randomised studies (e.g., INTERCLIMA [ClinicalTrials.gov: NCT05027984], COMBINE-INTERVENE [NCT05333068], and VULNERABLE [NCT05599061]) are exploring the prognostic benefit of a pre-emptive invasive treatment of high-risk but non-flow-limiting lesions detected by intravascular imaging.
Thus, in summary, plaques with high-risk features are those that in the follow-up have been associated with MACE, although, overall, their positive predictive value remains low. The imaging variable that is most consistently related with long-term cardiovascular complications is a large plaque burden (L1, PB >70%); additionally, lipid-rich content (L2) with or without TCFA and a small residual lumen area (L3, <4 mm2) have been also found to be associated with long-term cardiovascular outcomes. Whether these plaques should be pre-emptively treated with local devices is currently being explored in the above-mentioned studies.
Should culprit plaques be imaged with intravascular imaging before stenting to tailor therapy?
Plaque rupture
PR of infarct-related or target lesions occurred in 66% of AMI patients and in 27% of stable angina (SA) patients. Non-infarct-related or non-target artery PR occurred in 17% of AMI patients and 5% of SA patients. Multiple PRs were observed in 20% of AMI patients and 6% of SA patients50.
Other reports showed similar findings51. In the context of AMI, PRs are treated locally, in the infarct-related artery, with drug-eluting stents (DES) or drug-eluting balloons. The former is the current standard of care, and the latter technology is building promising evidence but remains to be further established525354555657. Yet, the additional plaque ruptures do not require any local treatment since they heal over time and do not seem to portend a risk of future events.
Niccoli et al58 showed that preintervention OCT image analysis before DES implantation was prognostically relevant. At follow-up, adverse events occurred more frequently (39% vs 14%; p<0.001) in patients in whom thrombotic culprit lesions showed PR versus plaques with an intact surface. This was mainly driven by a higher risk of unstable angina and target vessel revascularisation. The authors suggested that the presence of a PR at the culprit lesion portends a poor prognosis even in patients successfully treated with DES and, therefore, that this information might be used to risk stratify and manage ACS patients.
Plaque erosion
Intravascular imaging is providing insights as to whether ACS without fibrous cap disruption could be treated without stenting. Although there is not yet a final position on this, we present below the evidence that is being considered in this regard.
In the Massachusetts General Hospital OCT Registry [59, 31% of patients had PE as detected by OCT. Patients with OCT-detected erosion were younger, had less severe stenosis, less thrombus burden, and less frequently presented with ST-segment elevation myocardial infarction (STEMI) than those with plaque rupture. Non-STEMI (NSTEMI) was the predominant presentation in patients with OCT-detected erosion.
Prati et al60 suggested that, in patients with ACS without severe residual lumen narrowing and an intact fibrous cap visualised on OCT, an intense antithrombotic strategy alone (without coronary stenting) was able to provide excellent long-term clinical outcomes. They initially reported the clinical outcomes of 12 out of 31 STEMI patients with an intact fibrous cap managed with thrombectomy and dual antiplatelet therapy alone (without stent implantation). Notably, after 2-year follow-up, none of these patients required coronary revascularisation. These investigators first proposed that, in patients with non-severe lesions after thrombus aspiration, this conservative management (“with a thromboaspiration-alone strategy”) would allow vessel wall healing and complete restoration of the endothelial lining.
Further, the EROSION study confirmed that, in selected patients with ACS caused by PE, a novel strategy of antithrombotic therapy alone with aspirin and ticagrelor (but without stenting) provided favourable 1-month clinical outcomes61. Among 405 ACS patients (97% with STEMI) with analysable OCT images, PE was found in 103 of them (25%). Most patients were treated acutely with tirofiban and thrombus aspiration. Once stabilised, patients showing normal coronary flow and <70% residual diameter stenosis at the culprit lesion were treated with the dual antiplatelet strategy alone. Sixty patients were eventually enrolled, and 55 of them were re-evaluated with OCT at 1 month. The primary endpoint of the EROSION study, a >50% reduction in thrombus volume at 1 month, was met in 47/60 patients (78%), and no trace of residual thrombus was visualised in 22 patients. The favourable long-term clinical results obtained by this strategy were also subsequently demonstrated. Residual thrombus volume further decreased from 1 month to 1 year (0.3 mm3 vs 0.1 mm3; p=0.001) with no visible residual thrombus in half of the patients and, from a clinical standpoint, 92.5% of patients remained event-free at 1 year62.
The EROSION III study is the first randomised clinical trial in this field. Patients with STEMI, angiographic diameter stenosis ≤70% and Thrombolysis in Myocardial Infarction (TIMI) flow grade 3 (at presentation or after antegrade blood flow restoration) were randomised (n=246) to either OCT guidance or angiographic guidance. Notably, both patients with OCT-detected PE and those showing small PR were included. The primary efficacy (surrogate) endpoint, the rate of stent implantation, was significantly lower in the OCT arm (44% vs 59%; p<0.05). In addition, the rates of cardiocerebrovascular events were comparable between the groups (11.6% after OCT guidance vs 9.6% after angiographic guidance; p=0.66), although this study was not powered for a comparison of clinical event rates at 1 year63.
Thus, despite the evidence in this section suggesting that patients with plaque erosion could be treated differently, compared to those with plaque rupture, the level of evidence is not yet sufficient to inform a change in clinical practice.
ERUPTIVE CALCIFIED nodules
Eruptive CNs are present in a minority (~5-10%) of ACS patients. Importantly, results of coronary interventions in CNs or nodular calcifications are poorer than the outcomes found in other types of calcified plaques5964. In some cases, results are clearly suboptimal despite the aggressive use of calcium modification techniques (including scoring and very high-pressure balloons, rotational or orbital atherectomy, and lithotripsy) (Figure 3, Moving image 3).
Some culprit lesions of ACS patients may not fit into this uniform, classical algorithm (namely, plaque rupture, erosion, or calcified nodules). Other potential aetiologies, including superficial calcific sheets, have emerged. Clinical reports showed that patients with ACS who have calcification in the culprit lesions have a worse prognosis6566. Anecdotal preliminary OCT reports have already suggested that superficial calcific sheets could indeed generate atherothrombotic complications leading to an ACS67.
In a multicentre study of 1,241 ACS patients with preintervention OCT available, 157 patients (12.7%) had a calcified plaque (defined in this study as superficial calcification without images of a ruptured lipid plaque) at the culprit lesion. Three distinct types of culprit calcified plaque were considered: (1) superficial calcific sheet (67.4%), (2) typical eruptive calcified nodules (25.5%), and (3) calcified protrusions (7.1%). The eruptive CNs were more frequently located in the right coronary artery, whereas the superficial calcific sheets were more frequently found in the left anterior descending coronary artery. The superficial calcific sheets had the most severe lumen narrowing and the worst coronary flow. Of interest, among 95 patients with a superficial calcific sheet, 81 (85%) showed “minimally disrupted” overlying fibrous tissue and the highest rise in cardiac biomarkers after stenting. Furthermore, white thrombus was predominant in this group, whereas most eruptive calcified nodules showed associated red thrombus68. The pathophysiology of a superficial calcific sheet to produce ACS remains elusive, and histological validation of superficial calcific sheets as the cause of ACS is eagerly awaited.
Assessment of the impact of medical treatment on atherosclerosis progression
IVUS has been the intracoronary imaging modality of choice to study the changes in plaque (percentage atheroma volume is the most used endpoint) by lowering the low-density lipoprotein cholesterol (LDL-C) plasma concentration; IVUS has also historically been used to compare the various antiatherosclerotic strategies69. The most contemporary trials also have used CCTA, OCT, or a multimodality imaging approach including IVUS, OCT, and NIRS70. Thereby, newer endpoints have been developed, such as lipid composition measured by different metrics, including lipid arc by OCT and lipid core burden index by NIRS, while in CCTA, a combination of plaque geometric and compositional endpoints have been used.
IVUS trials
Selected IVUS studies showing the stabilisation and regression of atherosclerotic plaques are included in Table 1.
Table 1. Coronary plaque stabilisation and regression studies: IVUS imaging.
| Statin trials | Reference | Primary endpoint | Results |
|---|---|---|---|
| REVERSAL (R)atorvastatin 80 mg vs pravastatin 40 mg | 71 | PAV | At 18 months, atorvastatin reduced progression |
| ASTEROID (NR)rosuvastatin 40 mg | 72 | Change in PAV and the change in nominal atheroma volume in the 10 mm subsegment | At 24 months, rosuvastatin induced significant regression |
| SATURN (R)atorvastatin 80 mg vs rosuvastatin 40 mg | 73 | PAV | At 24 months, both drugs induced significant (& similar) regression |
| COSMOS (NR)rosuvastatin 2.5 mg titrated to 20 mg | 94 | Percentage change in plaque volume | At 18 months, rosuvastatin induced significant regression |
| IBIS-4 (NR)rosuvastatin 40 mg | 91,93 | PAV | At 13 months, rosuvastatin induced significant regression |
| STABLE (R)rosuvastatin 40 mg vs 10 mg | 95 | Virtual histology-defined percentage compositional volume | At 12 months, rosuvastatin reduced necrotic core and plaque volume |
| JAPAN-ACS (R)pitavastatin 4 mg or atorvastatin 20 mg | 96 | Mean percentage change in PV | At 8-12 months, both drugs induced significant (& similar) regression |
| PCSK9 inhibitor trials | |||
| GLAGOV (R)evolocumab 420 mg vs placebo | 78 | PAV | At 18 months, evolocumab induced significant regression |
| HUYGENS (R)evolocumab 420 mg vs placebo | 79 | PAV (secondary endpoint) | At 12 months, evolocumab induced significant regression |
| PACMAN-AMI (R)alirocumab 150 mg vs placebo | 70 | PAV | At 12 months, alirocumab induced significant regression |
| ODYSSEY-J-IVUS (R)alirocumab 75 mg vs placebo | 80 | Percentage change in normalised total atheroma volume | At 36 weeks, the effect of alirocumab did not reach statistical significance |
| Cholesterol ester transfer protein inhibitors | |||
| ILLUSTRATE (R)torcetrapib plus atorvastatin vs atorvastatin alone | 97 | PAV | At 24 months, no effect of torcetrapib addition on PAV |
| Triglyceride-lowering agent | |||
| CHERRY (R)eicosapentaenoic acid 1,800 mg plus pitavastatin 4 mg vs pitavastatin 4 mg | 98 | Plaque volume and composition | At 6-8 months, no difference in PAV between groups |
| HDL-C mimetics | |||
| CHI SQUARE (R)placebo vs CER-001 3 mg/kg, 6 mg/kg, or 12 mg/kg | 99 | Nominal change in the total atheroma volume | At ~9 weeks, CER-001 infusions did not reduce plaque |
| CER-001 Atherosclerosis Regression Acute Coronary Syndrome (R)CER-001 3 mg/kg vs placebo | 100 | PAV | At 78 days, CER-001 did not promote regression |
| ApoA-I Milano (R)placebo vs ETC-216 15 mg/kg vs 45 mg/kg | 82 | PAV | At ~7 weeks, ApoA-I Milano/phospholipid complex (ETC-216) produced significant regression |
| Thiazolidinediones | |||
| PERISCOPE (R)glimepiride 1-4 mg vs pioglitazone 15-45 mg | 84 | PAV | At 18 months, pioglitazone slowed progression of plaques |
| APPROACH (R)rosiglitazone 4 mg/d vs glipizide 5 mg/d | 85 | PAV | At 18 months, rosiglitazone showed mild plaque regression, but it did not affect plaque size more than glipizide |
| Antihypertensive drugs | |||
| CAMELOT (R)amlodipine 10 mg vs enalapril 20 mg vs placebo | 86 | PAV | At 24 months, amlodipine showed a non-significant trend towards less progression of plaque, while enalapril and placebo showed progression |
| PERSPECTIVE (R)perindopril 8 mg vs placebo | 87 | Mean plaque cross-sectional area | At 3 years, perindopril did not change plaque size |
| OLIVUS (R)olmesartan 10-40 mg vs control | 88 | PAV | At 14 months, olmesartan decreased plaque size |
| HDL-C: high-density lipoprotein cholesterol; IVUS: intravascular ultrasound; NR: non-randomised; PAV: percentage atheroma volume; PCSK9: proprotein convertase subtilisin/kexin type 9; PV: plaque volume; R: randomised | |||
Antilipid therapies
Statin trials have evaluated different statin types and dose regimens. In the REVERSAL trial, high-intensity atorvastatin led to significant plaque regression71. The ASTEROID study demonstrated for the first time that high-dose rosuvastatin had plaque-regression capabilities72. A head-to-head comparison of atorvastatin and rosuvastatin was reported in the SATURN trial73. Although rosuvastatin lowers more LDL-C, the extent of plaque regression was of a similar magnitude in both study arms. When statins alone do not achieve the recommended targets, ezetimibe has been used in combination. This combination did not exert additional plaque-regression effects in the primary endpoints of the HEAVEN, ZEUS, PRECISE-IVUS, and EZETIMIBE-ACS trials [74-77. Despite its value, the amount of plaque regression achieved by aggressive statin therapy remains very low (<1%).
Proprotein convertase subtilisin/kexin type 9 (PCSK9) inhibitors are monoclonal antibodies (evolocumab and alirocumab) that target the PCSK9 enzyme. The GLAGOV trial showed that evolocumab in addition to statin versus statin/placebo induced plaque regression78. Similarly, in the HUYGENS trial, evolocumab consistently showed reduction in plaque size79.
In the PACMAN-AMI trial, alirocumab showed plaque regression in non-infarct-related arteries70, while in the ODYSSEY J-IVUS trial, a reduced dose of alirocumab did not reach statistical significance versus placebo in terms of plaque regression80.
Other antilipid therapies such as cholesterol ester transfer protein inhibitors (torcetrapib) and a triglyceride-lowering agent (eicosapentaenoic acid) did not demonstrate an effect on plaque size.
High-density lipoprotein (HDL) cholesterol mimetics, which aim at increasing HDL levels, have shown conflicting results from their inception. Recombinant apolipoprotein A-I Milano (ApoA-IM) dimer showed a reduction of carotid intimal thickening in rabbits81. This was followed by a successful IVUS study by Nissen et al, who showed that an ApoA-I Milano/phospholipid complex (ETC-216) produced significant regression82. Conversely, CER-001 showed no effects on plaque size, and lastly, CSL112, which is a human apolipoprotein A1, was evaluated in the AEGIS-II study and resulted in no reduction of cardiovascular outcomes83.
Non-lipid targets
Thiazolidinediones are medications for treating type 2 diabetes mellitus. In the PERISCOPE trial84, pioglitazone reduced plaque size, while in the APPROACH trial85, rosiglitazone did not affect plaque size more than glipizide.
Antihypertensive drugs have shown conflicting results in terms of their effects on coronary plaques. In the CAMELOT trial, amlodipine, enalapril and placebo were compared. Amlodipine showed regression of plaque, albeit non-significant, while the other two groups showed its progression86. The PERSPECTIVE trial did not show plaque reduction in the perindopril group87. Conversely, olmesartan decreased plaque size in the OLIVUS trial88. Lastly, the AQUARIUS trial did not show beneficial effects with the use of aliskiren89.
OCT trials
OCT is unable to visualise the entire plaque burden in segments with advanced CAD. Therefore, OCT primary study endpoints have been lipid arc and fibrous cap thickness, given the excellent resolution of OCT.
Antilipid therapies
A systematic review and meta-analysis that pooled the results of 9 statin trials showed that FCT increased by 67.7 μm with statin therapy90. Trials not included in this meta-analysis are summarised below.
IBIS-4 was a prospective observational study in 103 patients presenting with STEMI. IVUS and OCT were performed in 2 non-infarct-related arteries at baseline presentation in order to then assess the effect of rosuvastatin 40 mg on fibrous cap thickness and macrophage line arc by OCT at 13-month follow-up. The study showed a significant increase in FCT from 64.9±19.9 μm to 87.9±38.1 μm (p=0.008) and a reduction in macrophage line arc from 9.6±12.8o to 6.4±9.6o (p<0.0001); further, 69.2% of TCFAs identified at baseline regressed to a non-TCFA morphology [91.
PCSK9 inhibitors
The ALTAIR trial was a prospective, randomised, single-centre study that included 24 patients undergoing stent implantation. Patients were randomised to receive either alirocumab 75 mg every 2 weeks plus rosuvastatin 10 mg or to rosuvastatin 10 mg alone, to assess the effect of adding the PCSK9 inhibitor alirocumab to rosuvastatin in patients with TCFA who underwent coronary stent implantation. It showed a significant increase in FCT (140 μm vs 45 μm; p=0.002), a significant decrease in lipid index (–26.2% vs –2.8%; p<0.001) and a decrease in macrophage grade (–28.4% vs –10.2%; p=0.033)92.
The HUYGENS trial was a prospective and randomised trial in 161 patients presenting with NSTEMI who underwent OCT and IVUS imaging of non-culprit vessels at baseline and at 50 weeks post-presentation. Patients were randomised to either evolocumab 420 mg or placebo every month while taking the maximum tolerated statin dose, to assess the change in the minimum FCT and maximum lipid arc. It showed a greater increase in the minimum FCT (42.7 μm vs 21.5 μm; p=0.015) and a decrease in the maximum lipid arc (–57.5° vs –31.4°; p=0.04) and macrophage index (–3.17 mm vs –1.45 mm; p=0.04)79.
The PACMAN-AMI trial was a prospective and randomised trial in 300 patients presenting with STEMI or NSTEMI who underwent IVUS, NIRS, and OCT imaging of non-culprit vessels at baseline and at 52 weeks. Patients were randomised to either alirocumab 150 mg every 2 weeks or placebo while taking rosuvastatin 20 mg, to assess the change in IVUS-derived percentage atheroma, in NIRS-derived max LCBI4mm, and in OCT-derived minimum FCT from baseline to week 52. It showed a greater increase in the minimum FCT (62.67 μm vs 33.19 μm; p=0.001); other parameters have been described before70.
The YELLOW III trial was a prospective observational trial in 137 patients undergoing percutaneous interventions who had a non-obstructive, non-culprit lesion with luminal stenosis 30-50%; these patients underwent OCT and NIRS/IVUS imaging at baseline and at 26 weeks. Patients were randomised to either evolocumab 420 mg or placebo every month while taking the maximum tolerated statin dose, to assess the change in max LCBI4mm by NIRS/IVUS and OCT-derived FCT from baseline to week 26. It showed a significant increase in the minimum FCT (97.7±31.1 μm to 70.9±21.7 μm; p<0.001) and a significant decrease in both maximum lipid arc (189.1±73.4o to 161.6±68.7o; p<0.001) and maximum macrophage arc (122.1±67.7° to 148.2±72.5°; p<0.0001) (ClinicalTrials.gov: NCT04710368; unpublished as of yet).
Conclusions
In conclusion, intravascular imaging has positively impacted how we evaluate coronary atherosclerosis and its natural history; it also provides guidance on the use of tailored therapies and enables the assessment of their long-term follow-up effects.
Conflict of interest statement
H.M. Garcia-Garcia has grants or contracts from Medtronic, Biotronik, Abbott, Neovasc, Corflow, Lucent Bio, Philips, and Chiesi (paid to the institution); and received consulting fees from Boston Scientific, Medis, Abbott, and ACIST. N. Pinilla-Echeverri has served as a consultant and speaker, received research grant support, and served on the advisory board for Abbott; has served on the advisory board for Philips; and has served as a consultant for Conavi, Amgen, Bayer, and Novartis. The other authors have no conflicts of interest to declare.
Supplementary data
To read the full content of this article, please download the PDF.
Moving image 1. Lipid- and necrotic core-rich plaques.
Moving image 2. Calcified plaques.
Moving image 3. Thrombotic plaques.
Moving image 4. Plaque types: revised nomenclature.
Moving image 5. Main high-risk plaque characteristics.