Cory:
Unlock Your AI Assistant Now!
Abstract
Background: Ischaemia without obstructive epicardial coronary artery disease (CAD) is common and is often related to coronary microvascular disease (CMD). Previous studies primarily focused on functional assessment in patients with established ischaemia without obstructive epicardial CAD.
Aims: We sought to assess the prevalence of CMD and compare clinical and procedural characteristics including myocardial perfusion imaging, as derived from rubidium-82 positron emission tomography (82Rb-PET), and health status according to CAD classification.
Methods: We conducted a prospective, observational study of symptomatic patients with suspected obstructive epicardial CAD on coronary computed tomography angiography. All patients were referred to 82Rb-PET and invasive coronary angiography with bolus thermodilution. CMD was defined as the absence of obstructive epicardial CAD (fractional flow reserve>0.80 or diameter stenosis <90%) combined with coronary flow reserve <2.5 and/or index of microvascular resistance ≥25. Main analyses included myocardial perfusion characteristics by 82Rb-PET and health status at baseline and at 3-month follow-up according to CAD classification (no disease, obstructive epicardial CAD, isolated CMD or combined obstructive epicardial CAD and CMD).
Results: Among 561 patients, isolated CMD was diagnosed in 131 patients (prevalence 0.23, 95% confidence interval [CI]: 0.20-0.27). Vessel territories with isolated CMD were characterised by similar perfusion characteristics to non-diseased vessels (mean difference in hyperaemic myocardial blood flow 0.03 [95% CI: −0.13 to 0.06] mL/min/g). Patients with isolated epicardial disease on both patient and vessel levels had reduced stress myocardial blood flow compared to patients without disease. The probability of being angina-free at 3 months tended to be lower for the CMD group (odds ratio [OR] 0.56, 95% CI: 0.31-1.00) and higher for the revascularised epicardial disease group (OR 1.52, 95% CI: 0.94-2.48) compared to the group classified as not diseased.
Conclusions: CMD, as identified with bolus thermodilution, is common in patients referred to invasive coronary angiography based on suspected obstructive epicardial CAD even in patients with normal stress myocardial blood flow by 82Rb-PET. (ClinicalTrials.gov: NCT02264717 and NCT04707859)
Current European and North American guidelines on chronic coronary syndrome emphasise the use of coronary computed tomography angiography (CTA) as a first-line diagnostic test in patients with symptoms suggestive of obstructive epicardial coronary artery disease (CAD)12. However, a sizeable proportion of patients with suspected obstructive epicardial CAD on coronary CTA do not have obstructive epicardial disease on the downstream invasive coronary angiography (ICA)34.
Previous studies report that up to 1 in 2 patients with relevant anginal symptoms but without obstructive epicardial CAD show evidence of coronary microvascular disease (CMD)5. Diagnosing CMD may help guide personalised treatment strategies and optimise patient outcomes. Guidelines currently recommend the use of invasive coronary flow reserve (CFR) and the index of microvascular resistance (IMR) to identify CMD2. However, previous studies mainly focused on functional assessment in patients with established angina but without obstructive epicardial CAD among populations referred to ICA based on multiple diagnostic strategies67.
In a population of symptomatic patients referred to ICA following coronary CTA, we aimed to evaluate and compare clinical and procedural characteristics, including myocardial perfusion imaging as derived from rubidium-82 positron emission tomography (82Rb-PET), and health status for patients with no disease, those with CMD only, those with obstructive epicardial CAD only or those with both CMD and obstructive epicardial CAD.
Methods
Study population
This was a substudy of the Danish Study of Non-Invasive Diagnostic Testing in Coronary Artery Disease (Dan-NICAD) 2 and 3. The trial designs were previously published89. This substudy included all patients that were referred for ICA based on suspected obstructive epicardial CAD (>50% diameter stenosis [DS]) on index coronary CTA. All patients were referred to myocardial perfusion imaging including 82Rb-PET and ICA. All patients provided informed written consent. The Central Denmark Region Committees on Health Research Ethics approved the study. The study was registered at ClinicalTrials.gov: NCT03481712 and NCT04707859.
Rubidium-82 positron emission tomography
A detailed description of the scanning protocol was previously reported89. Adenosine was administered continuously for 7 minutes (140 μg/kg/min). Quantitative analyses were performed to derive the global and territory-specific (left anterior descending artery [LAD], left circumflex artery [LCx], and right coronary artery [RCA]) resting and stress myocardial blood flow (MBF) and subsequent MBF reserve (MBFR), according to a cardiovascular imaging expert panel statement10. Findings were reported as averaged values and as the lowest mean value for two adjacent segments, both on a patient and a territory level.
Invasive coronary angiography and functional assessment
According to guideline recommendations and the study protocol, all coronary stenoses with visually estimated 30-90% DS in vessels >2 mm were considered for physiological assessment8. Additionally, for patients included as part of Dan-NICAD 3, full 3-vessel physiological assessment was applied, with the only exception being visually high-grade stenoses (>90% DS)9. In short, the pressure wire (PressureWire X Guidewire [Abbott]) was advanced distally in the target vessel (>2 mm distal to all visible disease or 2/3 of the vessel length), and its position was recorded during contrast injection. Resting pressure waveforms were recorded for at least 10 seconds when the effects of contrast and nitrate were considered negligible. For thermodilution, a total of 3 mL of saline was administered manually three times before and three times after administration of intravenous adenosine (140 μg/min/kg) to obtain mean baseline and hyperaemic transit times using the Coroventis CoroFlow system (Coroventis AB). All pressure waveforms, flow data and three-dimensional quantitative coronary angiograms (3D-QCA) underwent blinded review and analysis for artefacts in a core lab setting (Interventional Imaging Core Laboratories, Institute of Clinical Medicine, Aarhus University, Denmark). For the thermodilution measurements, cutoffs were applied according to guidelines, with fractional flow reserve (FFR) ≤0.80, CFR <2.5, and IMR ≥253. IMR was adjusted according to Yong’s formula11. We further calculated microvascular resistance reserve (MRR), which was recently introduced as a measure of the microvasculature that eliminates the influence of epicardial disease. We applied a cutoff of 3.0 for MRR12.
Health status
All patients were invited to complete the 19-item Seattle Angina Questionnaire (SAQ) at baseline and after 3 months. We included angina stability score, quality of life (QoL), angina frequency score, physical limitation score, and treatment satisfaction score. A summary score was calculated as the mean of the angina frequency, physical limitation, and QoL scores. The SAQ score ranged from 0-100 with higher scores indicating better health status. Freedom of angina was defined as an angina frequency score of 100.
Analysis strategy
CAD classification was performed based on ICA findings and the thermodilution measurements as follows: (1) no disease: defined as no lesions with >30% DS and/or normal FFR, CFR and IMR; (2) CMD: defined as a vessel with FFR>0.80 and CFR <2.5 and/or IMR ≥25; (3) obstructive epicardial disease: defined as high-grade coronary artery stenosis (>90% DS) or FFR ≤0.80; and (4) concomitant disease: defined as vessels with FFR ≤0.80 and IMR ≥25. The prevalence of CMD was calculated with a predefined stratification according to selective assessment of vessels with visually estimated 30-90% DS, as performed in Dan-NICAD 2, versus complete 3-vessel assessment, as performed in Dan-NICAD 3. Main analyses included the following: (1) characterisation of quantitative perfusion characteristics (global and territorial MBF and MBFR) using 82Rb-PET according to stratification by CAD classification; and (2) the influence of CAD classification on the probability of being angina-free after 3 months. Vessel-level analyses were stratified according to whether bolus thermodilution was performed in vessels with <30% DS (non-stenosed vessels) or vessels with >30% DS (stenosed vessels), as part of the 3-vessel protocol.
Statistical analyses
Continuous variables are presented as means with standard deviations or medians with interquartile ranges (IQR). Categorical baseline data are presented as a number with percentages. Differences in procedural and clinical characteristics across CAD classification groups were tested for statistical significance with one-way analysis of variance or the Kruskal-Wallis test and the chi-squared test or Fisher’s exact test as appropriate. Bonferroni correction was applied in case of multiple comparisons. Logistic regression (“glm” package in R) was used to assess and illustrate the probability of being angina-free after 3 months depending on CAD classification and as a function of the baseline angina frequency score. Applicable tests were two-tailed, and p<0.05 was considered statistically significant. R version 3.5.2 (R Foundation for Statistical Computing) was used for all statistical analyses.
Results
A total of 713 patients underwent ICA. Following the exclusion of patients and vessels who lacked physiological assessment for 30-90% DS, or had lost pressure/thermodilution waveform data, or had insufficient quality of FFR pressure or thermodilution data, 561 patients and 1,682 vessels were included for analyses (Figure 1).
Our study included 357 (64%) patients from Dan-NICAD 2, which involved functional evaluation of moderately stenosed vessels, and 204 (36%) patients from Dan-NICAD 3, in which a protocolled 3-vessel physiological assessment was performed regardless of lesion severity. Baseline and procedural characteristics are summarised stratified by CAD classification in Table 1 and Table 2. The mean age was 63±8 years, and 174 (31%) were female.
Patients with obstructive epicardial CAD or concomitant obstructive epicardial CAD and CMD more frequently had typical chest pain (Table 1). The mean FFR, CFR and IMR were 0.89±0.10, 3.6±2.3, and 19±16, respectively. Median values are listed according to vessel and stratified by stenosed/non-stenosed vessels in Supplementary Table 1.
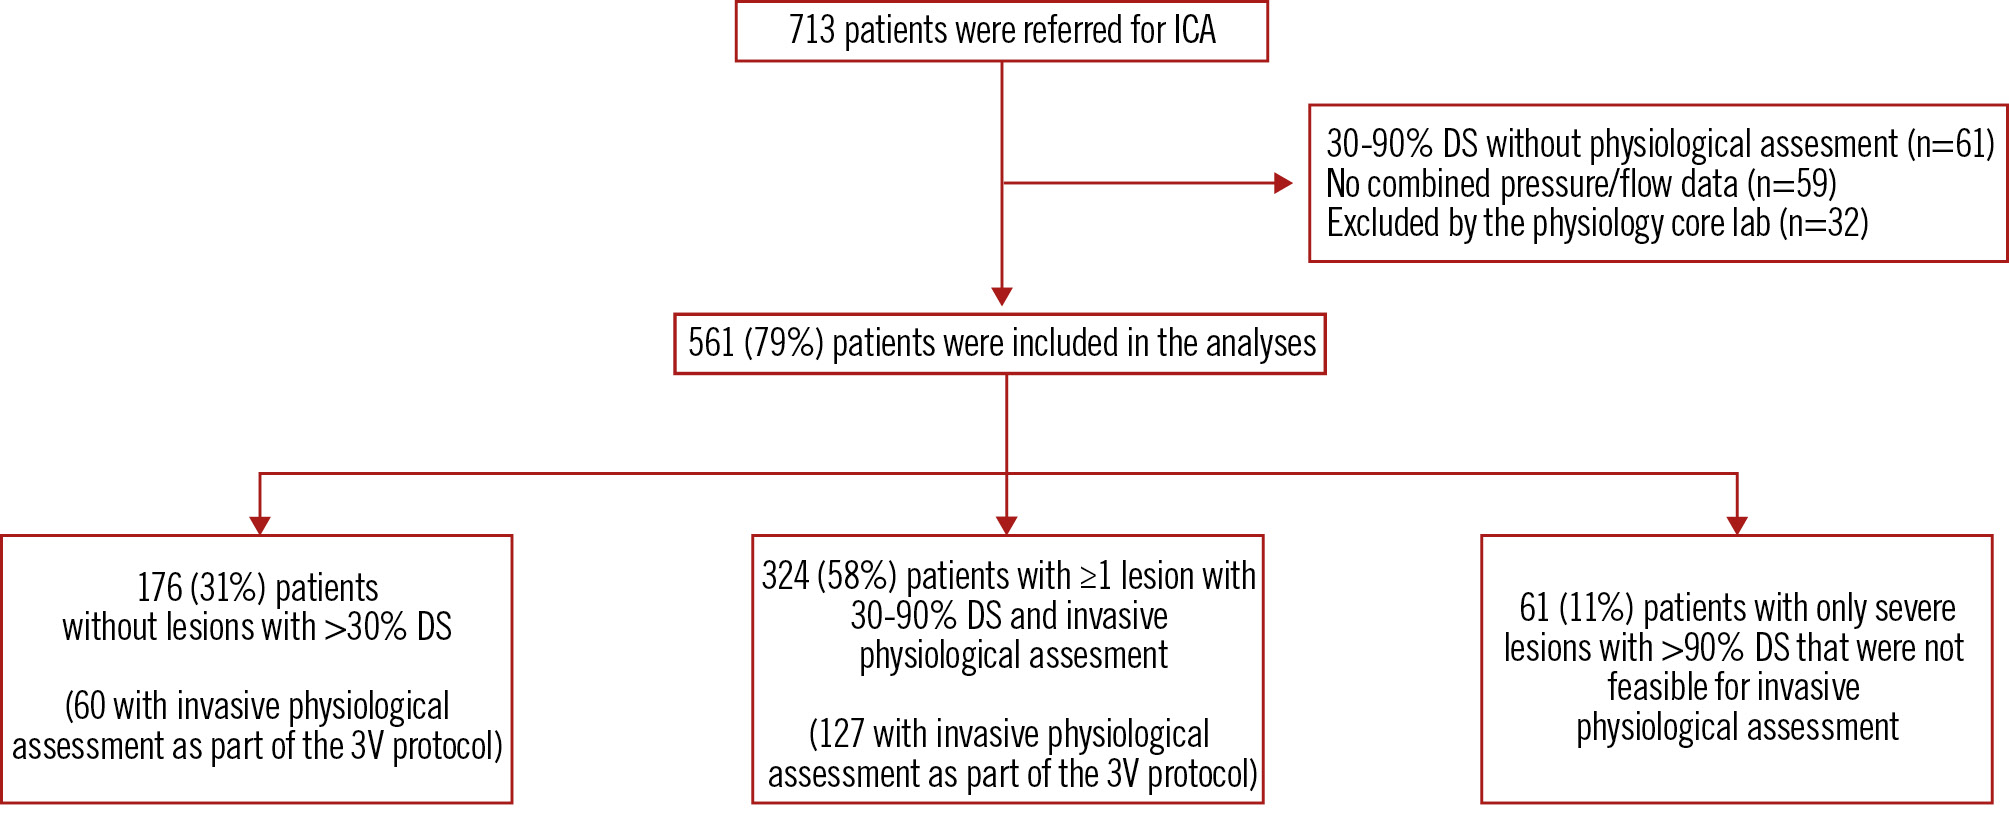
Figure 1. Study flowchart. The 3V protocol refers to the 3V functional assessment protocol that was applied in Dan-NICAD 3. 3V: three-vessel; DS: diameter stenosis; ICA: invasive coronary angiography
Table 1. Baseline characteristics.
| No disease | Microvascular disease | Epicardial disease | Concomitant epicardial and microvascular disease | p-value | |
|---|---|---|---|---|---|
| n | 212 (38) | 131 (23) | 179 (32) |
39 (7) |
|
| Demographics | |||||
| Age, years | 63.4±8.3 |
64.1±7.6 |
63.0±8.0 | 63.0±7.0 | 1.00 |
| Female | 83 (39.2) | 53 (40.5) | 30 (16.8) | 8 (20.5) | <0.01 |
| Risk factors | |||||
| Diabetes | 20 (9.4) | 9 (7.6) | 27 (15.1) | 4 (10.3) | 0.90 |
| Hypertension | 111 (52.4) | 72 (55.0) | 101 (56.4) | 27 (69.2) | 1.00 |
| Smoking | 1.00 | ||||
| Active smoker | 71 (33.5) | 41 (31.3) | 67 (37.4) | 15 (38.5) | |
| Former smoker | 28 (13.2) | 23 (17.6) | 28 (15.6) | 4 (10.3) | |
| Never | 113 (53.3) | 67 (51.1) | 84 (46.9) | 20 (51.3) | |
| Hyperlipidaemia | 74 (35.1) | 55 (42.0) | 64 (36.2) | 13 (33.3) | 1.00 |
| Family history of CAD | 77 (36.5) | 54 (41.2) | 63 (35.4) | 17 (44.7) | 1.00 |
| Clinical presentation | |||||
|
Symptoms |
<0.01 | ||||
| Typical chest pain | 46 (21.7) | 21 (16.0) | 69 (38.5) | 16 (41.0) | |
| Atypical chest pain | 78 (36.8) | 51 (38.9) | 52 (29.1) | 15 (38.5) | |
| Dyspnoea | 32 (15.1) | 20 (15.3) | 28 (15.6) | 2 (5.1) | |
| Non-specific | 56 (26.4) | 39 (29.8) | 30 (16.8) | 6 (15.4) | |
| Clinical likelihood (risk-factor weighted) | <0.01 | ||||
| <5% | 44 (21.0) | 28 (21.4) | 18 (10.2) | 3 (7.9) | |
| 5-15% | 91 (43.3) | 54 (41.2) | 59 (33.5) | 14 (36.8) | |
| >15% | 75 (35.7) | 49 (37.4) | 99 (56.2) | 21 (55.3) | |
| Imaging | |||||
| CACS | 173.0 [50.0, 383.0] | 368.5 [110.5, 805.3] | 363.0 [108.5, 1,231.0] | 704.0 [104.0, 1,319.0] | <0.01 |
| 82Rb-PET | |||||
| 82Rb-PET global resting MBF, mL/min/g | |||||
| Averaged | 1.13±0.24 | 1.19±0.27 | 1.05±0.24 | 1.05±0.22 | <0.01 |
| Mean of lowest 2 adjacent segments | 0.94±0.24 | 0.98±0.26 | 0.88±0.25 | 0.85±0.21 | 0.03 |
| 82Rb-PET global stress MBF, mL/min/g | |||||
| Averaged | 2.84±0.60 | 2.88±0.64 | 2.17±0.64 | 2.36±0.53 | <0.01 |
| Mean of lowest 2 adjacent segments | 2.35±0.57 | 2.40±0.60 | 1.68±0.73 | 1.76±0.72 | <0.01 |
| 82Rb-PET global MBF reserve, mL/min/g | |||||
| Averaged | 2.59±0.58 | 2.52±0.62 | 2.15±0.63 | 2.39±0.73 | <0.01 |
| Mean of lowest 2 adjacent segments | 2.39±0.63 | 2.33±0.60 | 1.71±0.73 | 1.96±0.93 | <0.01 |
| 82Rb-PET perfusion defect | |||||
| Stress MBF <2 | 14 (7.3) | 6 (4.7) | 67 (41.4) | 22 (62.9) | <0.01 |
| SSS ≥4 | 19 (9.8) | 9 (7.0) | 95 (58.0) | 7 (20.0) | <0.01 |
| Values are mean±standard deviation, median [interquartile range], or n (%). Patient-level clinical and procedural characteristics stratified by CAD classification. P-values are adjusted for multiple comparisons with Bonferroni correction. CACS: coronary artery calcium score; CAD: coronary artery disease; MBF: myocardial blood flow; MBFR: myocardial blood flow reserve; 82Rb-PET: rubidium-82 positron emission tomography; SAQ: Seattle Angina Questionnaire; SSS: summed stress score | |||||
Table 2. Vessel characteristics.
| No disease | Microvascular disease | Epicardial disease | Concomitant epicardial and microvascular disease | p-value | |
|---|---|---|---|---|---|
| n | 1,135 (67) | 231 (14) | 291 (17) | 25 (2) | |
| Anatomy | |||||
| Vessel | <0.01 | ||||
| RCA | 413 (36.4) | 67 (29.0) | 76 (26.1) | 4 (16.0) | |
| LAD | 290 (25.6) | 90 (39.0) | 161 (55.3) | 20 (90.0) | |
| LCx | 432 (28.1) | 74 (32.0) | 54 (18.6) | 1 (4.0) | |
| Diameter stenosis, % | 27.3 [18.8, 36.8] | 35.8 [24.1, 44.1] | 60.7 [45.0, 88.3] | 53.5 [41.4, 60.6] | <0.01 |
| Pressure | |||||
| FFR | 0.93 [0.87, 0.97] | 0.93 [0.87, 0.97] | 0.75 [0.70, 0.78] | 0.71 [0.65, 0.78] | <0.01 |
| bPa, mmHg | 92.2 (11.1) | 93.5 (11.8) | 91.4 (12.5) | 94.7 (15.6) | 1.00 |
| hPa, mmHg | 85.1 (12.2) | 85.9 (14.1) | 82.9 (12.1) | 88.5 (17.7) | 1.00 |
| bPd, mmHg | 90.1 (11.6) | 90.8 (12.3) | 81.8 (13.1) | 79.8 (18.0) | <0.01 |
| hPd, mmHg | 78.4 (12.5) | 78.1 (13.6) | 61.6 (12.2) | 62.0 (18.5) | <0.01 |
| dPr | 0.98 [0.95, 1.01] | 0.97 [0.93, 1.00] | 0.88 [0.84, 0.91] | 0.88 [0.81, 0.90] | <0.01 |
| Flow/resistance | |||||
| CFR | 4.2 [3.2, 5.8] | 2.0 [1.6, 2.4] | 2.5 [1.9, 3.5] | 1.5 [1.1, 2.5] | <0.01 |
| Transit time rest, s | 0.74 [0.51, 0.98] | 0.53 [0.33, 1.08] | 0.56 [0.38, 0.76] | 0.99 [0.52, 1.45] | <0.01 |
| Transit time stress, s | 0.17 [0.12, 0.22] | 0.29 [0.19, 0.44] | 0.22 [0.16, 0.31] | 0.54 [0.45, 0.70] | <0.01 |
| IMR | 13.0 [9.5, 18.0] | 24.0 [13.0, 34.0] | 14.0 [10.0, 19.0] | 32.0 [27.0, 37.0] | <0.01 |
| 82Rb-PET (vessel territory) | |||||
| PET territory resting MBF, mL/min/g | |||||
| Averaged | 1.10±0.27 | 1.16±0.28 | 1.02±0.24 | 1.02±0.27 | <0.01 |
| Mean of lowest 2 adjacent segments | 0.93±0.24 | 0.97±0.26 | 0.83±0.23 | 0.80±0.22 | <0.01 |
| PET territory stress MBF, mL/min/g | |||||
| Averaged | 2.76±0.66 | 2.79±0.66 | 1.88±0.70 | 2.30±0.68 | <0.01 |
| Mean of lowest 2 adjacent segments | 2.28±0.59 | 2.27±0.59 | 1.49±0.61 | 1.84±0.61 | <0.01 |
| PET territory MBF reserve, mL/min/g | |||||
| Averaged | 2.59±0.70 | 2.50±0.73 | 1.91±0.71 | 2.46±1.27 | <0.01 |
| Mean of lowest 2 adjacent segments | 2.32±0.61 |
2.21±0.66 |
1.61±0.71 | 2.11±1.04 | <0.01 |
| PET territory perfusion defect | |||||
| Stress MBF <2 | 130 (11.4) | 24 (10.3) | 150 (51.5) | 7 (28) | <0.01 |
| SSS ≥4 | 43 (3.8) | 14 (6.0) | 137 (47.0) | 4 (16) | <0.01 |
| Values are mean±standard deviation, median [interquartile range] or n (%). Vessel-level procedural characteristics stratified by CAD classification. P-values are adjusted for multiple comparisons with Bonferroni correction. bPa: baseline aortic pressure; bPd: baseline distal pressure; CAD: coronary artery disease; dPR: diastolic pressure ratio; hPa: hyperaemic aortic pressure; hPd: hyperaemic distal pressure; IMR: index of microvascular resistance; LAD: left anterior descending artery; LCx: left circumflex artery; MBF: myocardial blood flow; PET: positron emission tomography; 82Rb: rubidium-82; RCA: right coronary artery; SSS: summed stress score | |||||
Prevalence of CMD according to measuring strategy and vessel territory
On a patient level, a 3-vessel measuring strategy resulted in a lower prevalence of patients being classified as disease-free (0.28 [95% confidence interval [CI]: 0.22-0.34] vs 0.44 [95% CI: 0.39-0.49]) or as having obstructive epicardial CAD (0.27 [95% CI: 0.21-0.33] vs 0.35 [95% CI: 0.30-0.40]), and the prevalence of patients classified with isolated CMD was higher (0.35 [95% CI: 0.28-0.42] vs 0.17 [95% CI: 0.13-0.21]) than with a selective measuring strategy. In the subgroup of vessels where a 3-vessel invasive physiological assessment protocol was applied (n=322), the prevalence of CMD was 0.35 (95% CI: 0.30-0.40), and this did not differ between the RCA (0.31 [95% CI: 0.22-0.40]), LAD (0.37 [95% CI: 0.27-0.48]), and LCx (0.37 [95% CI: 0.29-0.46]). For the subgroup of vessels with invasive assessment of 30-90% lesions (n=385), CMD prevalence was 0.31 (95% CI: 0.26-0.36), and this was highest for the RCA (0.42 [95% CI: 0.31-0.54]) compared to the LAD (0.25 [95% CI: 0.20-0.32]) and the LCx (0.37 [95% CI: 0.26-0.49]) (Figure 2).
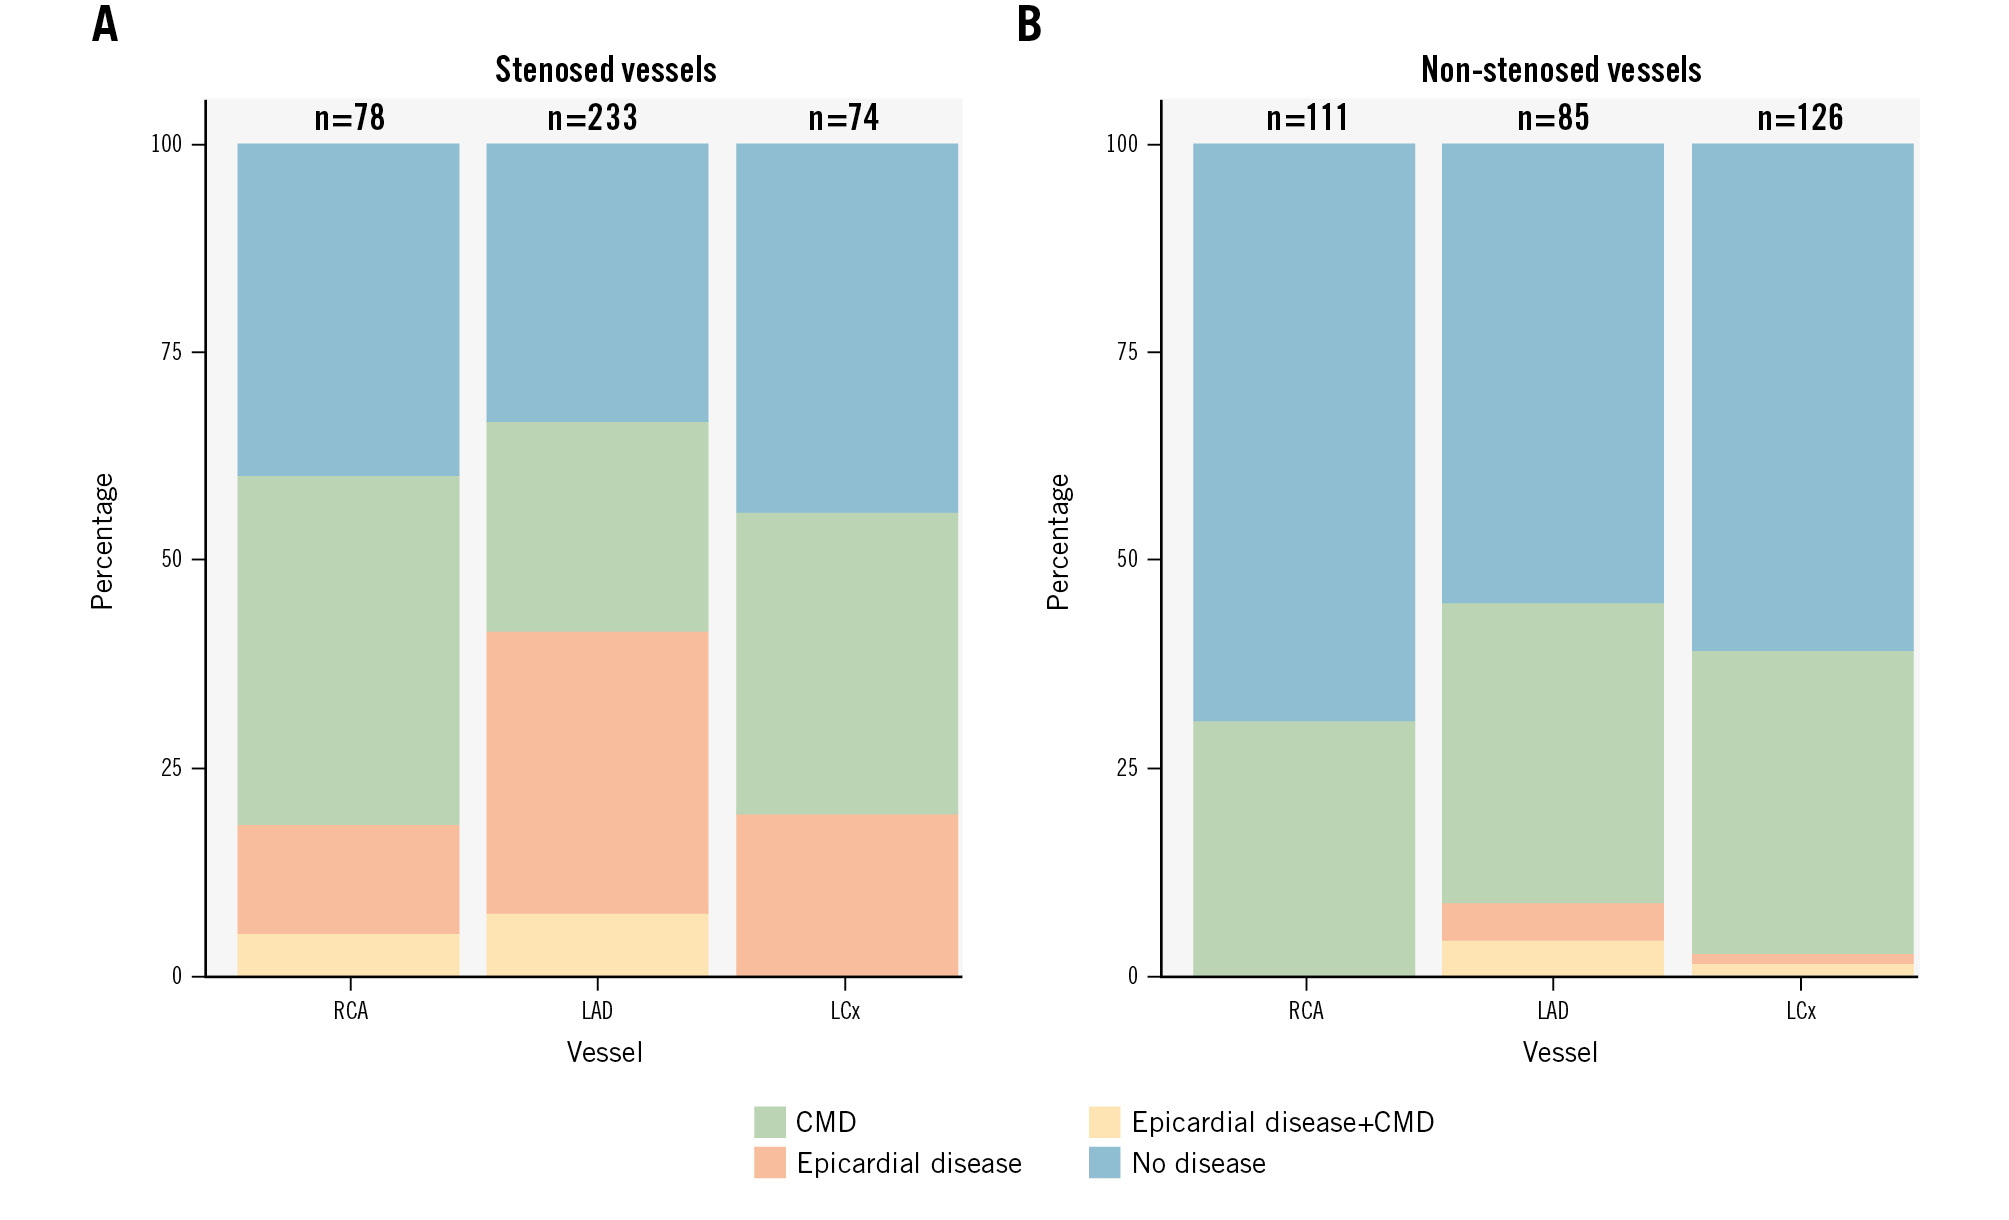
Figure 2. CAD classification stratified by coronary artery. Coronary microvascular disease, epicardial disease, and concomitant disease according to the evaluated coronary artery, stratified by stenosed vessels (>30% diameter stenosis by visual assessment (A) and non-stenosed vessels (B). CAD: coronary artery disease; CMD: coronary microvascular disease; LAD: left anterior descending artery; LCx: left circumflex artery; RCA: right coronary artery
Perfusion characteristics according to CAD classification
Complete 82Rb-PET data were available in 520 patients (93%). Territories with invasively assessed isolated CMD were characterised by a higher resting MBF (mean difference 0.06 [95% CI: −0.10 to −0.02]), while stress MBF (mean difference 0.03 [95% CI: −0.13 to 0.06]) and MBFR (mean difference −0.09 [95% CI: −0.02 to 0.19]) were similar (Table 2, Figure 3, Supplementary Figure 1) compared to territories without invasively assessed disease. Only territories with isolated obstructive epicardial CAD had, on average, reduced stress myocardial blood flow and myocardial blood flow reserve (Figure 3, Central illustration). Anatomical lesion severity as assessed by 3D-QCA was more severe for vessels with CMD compared to vessels without disease (Table 2).
Vessel characteristics.
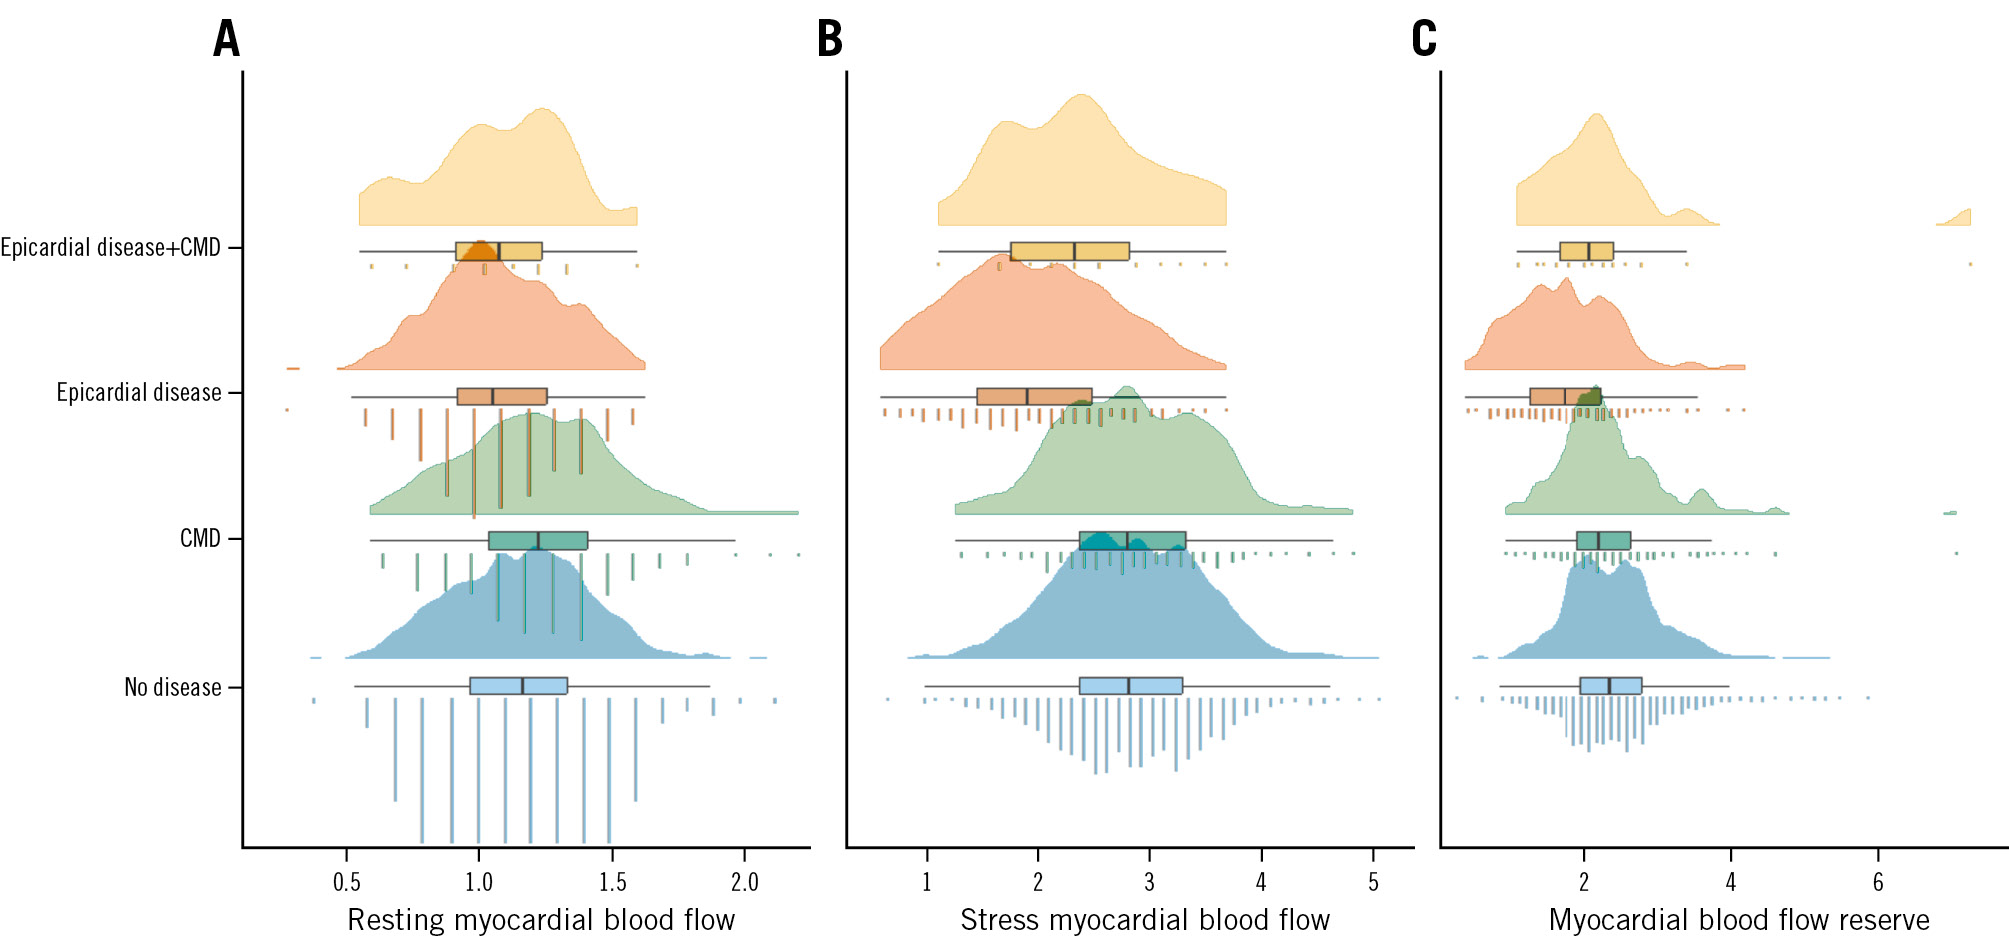
Figure 3. Perfusion characteristics according to CAD classification. Myocardial perfusion by 82Rb-PET illustrated with raincloud plots (combined density plot, boxplot and jittered point) according to resting myocardial blood flow (in mL/min/g; A), stress myocardial blood flow (in mL/min/g; B) and myocardial blood flow reserve (as a ratio of stress myocardial blood flow/resting myocardial blood flow; C) according to the 4 groups of invasive CAD classification). CAD: coronary artery disease; CMD: coronary microvascular disease; 82Rb-PET: rubidium-82 positron emission tomography
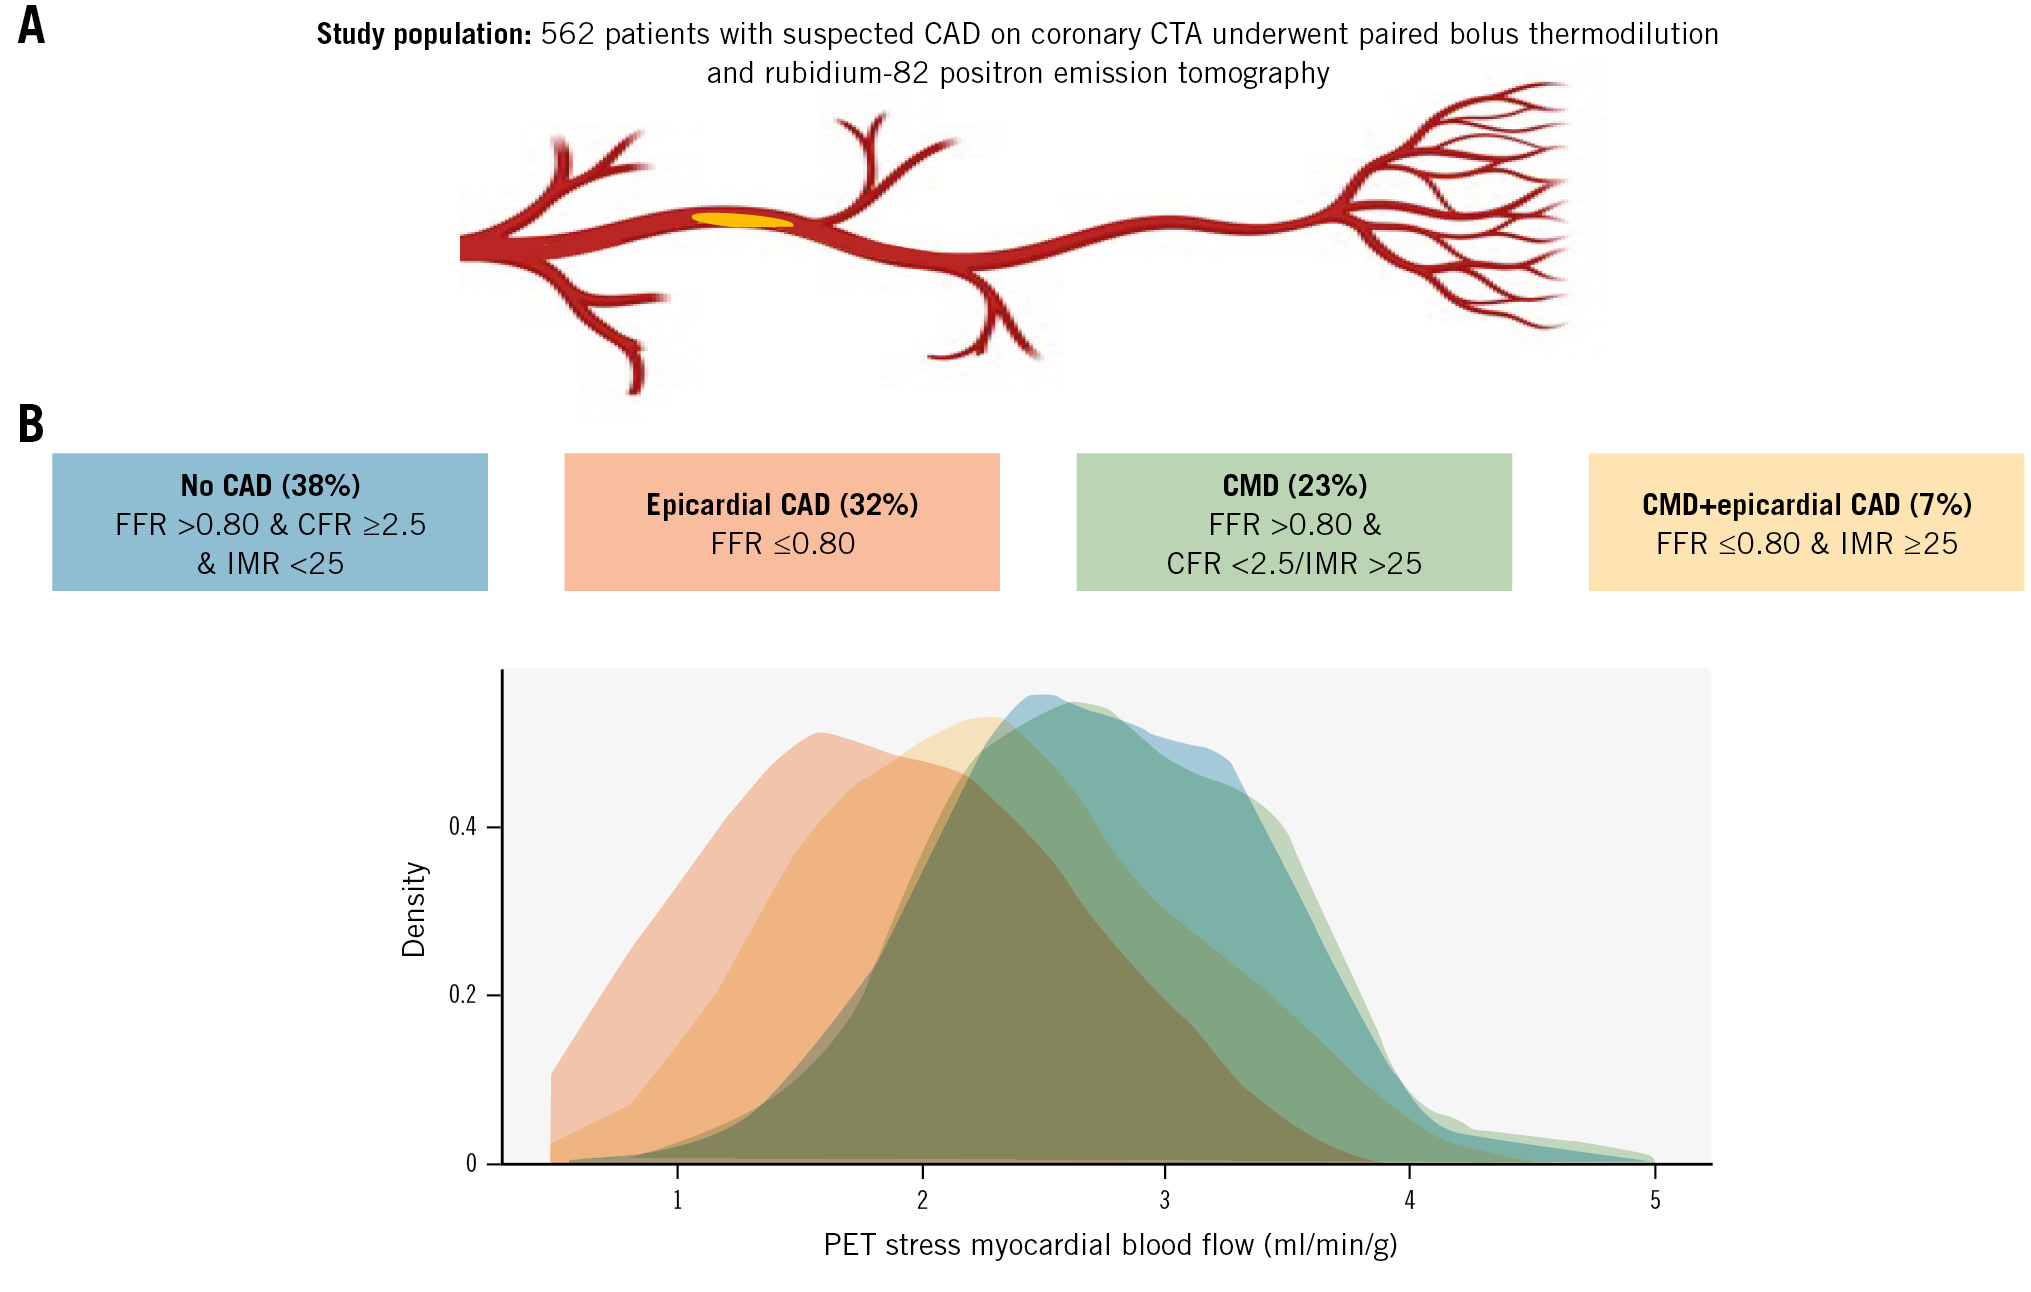
Central illustration. Stress myocardial blood flow according to CAD classification. A) Study population; (B) stress myocardial blood flow as assessed with 82Rb-PET according to CAD classification following routine bolus thermodilution assessment. CAD: coronary artery disease; CFR: coronary flow ratio; CMD: coronary microvascular disease; CTA: computed tomography angiography; FFR: fractional flow reserve; IMR: index of microvascular resistance; PET: positron emission tomography; 82Rb: rubidium-82
Influence of CFR, IMR, and MRR on CMD diagnosis
In the subgroup of patients with isolated CMD, 117 patients were classified as having disease based solely on CFR, 46 based solely on IMR, and 68 based on abnormal CFR in combination with abnormal IMR (Supplementary Table 2). Resting MBF was higher and stress MBF lower for the CFR group compared to the IMR group. No differences were seen in perfusion characteristics following stratification by MRR (Supplementary Table 2).
Symptoms and health status at baseline and three months according to CAD classification
Patients with isolated obstructive epicardial CAD or concomitant obstructive epicardial CAD and CMD more often described typical chest pain compared to patients with isolated CMD or no disease (Table 1). A total of 427 had complete baseline and 3-month follow-up SAQ data. No significant differences were found in key SAQ parameters between the groups at baseline and 3 months of follow-up (Supplementary Table 3, Supplementary Table 4). The probability of being angina-free at 3 months tended to be lower for the CMD group and higher for the revascularised epicardial disease group compared to the group without disease (Supplementary Table 4, Supplementary Table 5, Figure 4).
Baseline characteristics.
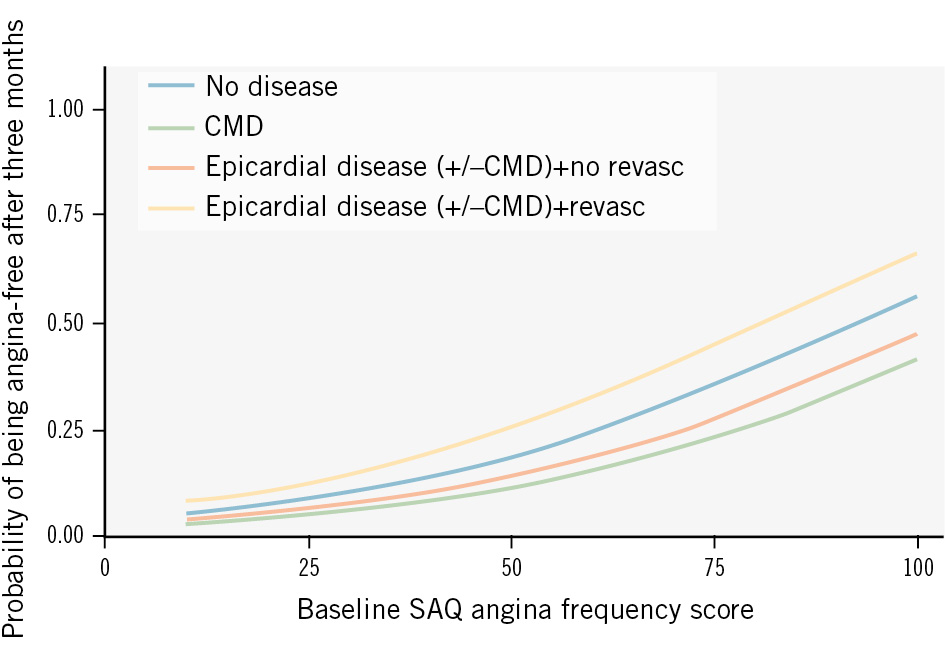
Figure 4. Influence of CAD phenotype on the probability of being angina-free. The probability of being angina-free as a function of the baseline SAQ angina frequency score including the effect of CAD phenotype. CAD: coronary artery disease; CMD: coronary microvascular disease; revasc: revascularisation; SAQ: Seattle Angina Questionnaire
Discussion
This is, to our knowledge, the largest study to date with consecutive invasive physiological lesion assessment in patients referred to ICA based on coronary CTA with suspected obstructive CAD. The main findings were as follows: (1) similar to previous studies focusing solely on patients with angina with no obstructive coronary artery disease (ANOCA), CMD was common in this cohort, with its prevalence dependent on complete assessment of all main coronary arteries; (2) only isolated obstructive epicardial CAD was associated with reduced stress myocardial perfusion, as assessed with 82Rb-PET; (3) patients with isolated CMD were less likely to be angina-free after 3 months compared to those who underwent revascularisation for obstructive epicardial disease.
Prevalence of coronary microvascular dysfunction
Previous studies found various CMD prevalence estimates ranging from 0.16 to 0.72, with an average of 0.41 in a recent meta-analysis that included patients with non-obstructive epicardial CAD13. Overall, we found a lower prevalence, likely due to patient selection driven by our study design, which involved referral to ICA based on suspected obstructive epicardial CAD on coronary CTA. However, the prevalence of CMD increased when all 3 major epicardial vessels were assessed, leading to identification of almost 1 in 2 with isolated CMD or concomitant CMD and epicardial disease. The increasing yield of multivessel assessment is in line with a recent study comparing a single-vessel protocol with multivessel invasive coronary functional testing7. While the latter study was performed in patients referred to an expert ANOCA testing centre, our findings underscore the diagnostic impact of microcirculatory assessment even in early stages, when there is still a primary suspicion of obstructive epicardial CAD. Our findings are important because coronary CTA is gaining international traction as a first-line diagnostic strategy in patients presenting with symptoms suggestive of CAD. Additionally, our findings illustrate that patients can have CMD, defined by bolus thermodilution, despite fairly normal perfusion on 82Rb-PET. This may explain persistent angina symptoms following percutaneous coronary intervention (PCI) that may be caused by undiagnosed CMD, with the need for supplementary medical treatment. Indeed, we showed that patients with isolated CMD were less likely to be angina-free after 3 months compared to patients who underwent revascularisation for obstructive epicardial CAD (Supplementary Table 5). Furthermore, our findings underscore uncertainties related to the diagnosis of CMD.
Clinical indication for diagnosing CMD
The importance of CMD is increasingly acknowledged14. Its identification, including patient-specific treatment, has been shown to be related to improved quality of life6. However, accurate assessment of CMD is challenging, with a lack of reproducible and accurate techniques. While invasive CAD classification of patients with ischaemia with no obstructive CAD (INOCA) using bolus thermodilution and acetylcholine improves treatment satisfaction, it did not seem to improve patient outcomes in a randomised clinical study15. On the contrary, CMD diagnosed with CFR (Doppler flow, cutoff 2.0) is associated with increased rates of major cardiac events and target vessel failure compared to patients/vessels with FFR>0.80 and normal CFR16. However, wire-based CFR, unlike FFR, does not appear to have a continuous relationship with clinical outcomes17. Unlike CFR, the evidence underlying IMR is strongest for prognostication following PCI in acute coronary syndrome18. In stable patients, a high IMR is mainly associated with a poor outcome when combined with a low CFR19. We found that patients with isolated CMD had a similar symptom profile and similar myocardial perfusion characteristics by 82Rb-PET as patients without obstructive epicardial CAD or CMD, both on a patient and vessel level. The latter underscores the need for further research into diagnostic pathways that include CMD diagnosis.
Optimal invasive diagnoses of CMD
Assessment of coronary physiology with bolus thermodilution has several technical limitations, including but not limited to manual injection of saline and wire positioning. The latter affects transit times and thus inherently IMR, which has been shown to have a broad span of normal values in previous reports, limiting clinical interpretation and reproducibility202122. Microvascular resistance assessment with continuous thermodilution theoretically accounts for epicardial atherosclerosis and is far more reproducible than bolus thermodilution2324. Furthermore, increased microvascular resistance measured with continuous thermodilution correlates to physical limitations and angina in patients without obstructive epicardial CAD25. This paper documents that bolus thermodilution identifies CMD in a substantial number of patients with normal myocardial perfusion by 82Rb-PET, thus questioning its value (Figure 3). Our findings add to the previous Dan-NICAD analysis describing poor correlation between CFR derived from bolus thermodilution and myocardial blood flow reserve measured by 82Rb-PET (rho 0.11 for RCA, rho 0.34 for LCx, and rho 0.24 for LAD on a per-vessel level in Dan-NICAD 3)26. Aside from potential limitations related to bolus thermodilution, the clinical importance of discordant bolus thermodilution and 82Rb-PET is not well understood but may in part be attributed to applied 82Rb-PET definitions where small subendocardial defects with intact flow may still be present27. Furthermore, a suspicion regarding the presence of functional CMD could be raised from elevated basal flow on 82Rb-PET, but no clear-cut value for clinical use has been established10.
Clinical implications
Assuming that bolus thermodilution is a gold standard for invasive assessment of CMD, routine assessment may be warranted in patients referred to ICA following coronary CTA. The latter includes patients with a normal 82Rb-PET, as a substantial proportion of patients will have CMD following bolus thermodilution assessment if the current European guideline recommendations are followed. A full 3-vessel assessment with bolus thermodilution may be necessary for a complete diagnostic evaluation for CMD identification, but if CMD is demonstrated in the first interrogated vessel, selective assessment seems sufficient.
Limitations
We were not able to differentiate and identify subendocardial perfusion characteristics using relative subendocardial stress-to-rest ratios as proposed by Gould et al28. However, from a theoretical point of view, we would not expect bolus thermodilution to correlate better to stress-to-rest ratios. We did not include vasospasm evaluation with acetylcholine testing. However, our findings still apply to a broad population as acetylcholine testing is not widely adopted. Female sex was underrepresented in our study, which may be of importance as female sex is associated with angina without obstructive epicardial CAD. On the contrary, we included a slightly larger proportion of females compared to the INOCA subanalysis of the ISCHEMIA trial29. A distal wire position may lead to a false-positive IMR, and it cannot be excluded that three-vessel interrogation could lead to a false-positive diagnosis of CMD20. It cannot be ruled out that epicardial CAD with FFR>0.80 may impact the transit times and thus the CFR- and IMR-related analyses despite adjusting the IMR with Yong’s formula. Conversely, IMR and CFR are used in clinical practice independent of epicardial CAD. The latter is in accordance with a preclinical investigation of IMR measurements in porcine models documenting that IMR was not influenced by epicardial stenosis30. We only included patients with suspected obstructive disease on coronary CTA, which may have impacted the CMD prevalence. While the variation in study protocol, with guided physiological assessment versus complete 3-vessel assessment, was useful to assess the difference in prevalence of CMD, it may have impacted the remaining presented analyses.
Conclusions
Up to 1 in 2 symptomatic patients referred to invasive coronary angiography based on suspected obstructive epicardial CAD on coronary computed tomography angiography have coronary microvascular disease, as assessed with bolus thermodilution, often with normal myocardial blood flow, as assessed with 82Rb-PET myocardial perfusion imaging.
Impact on daily practice
Our findings underscore that routine bolus thermodilution in patients referred to coronary angiography following coronary computed tomography angiography will lead to a coronary microvascular disease diagnosis in up to 1 in 2 patients, often despite normal perfusion as assessed with rubidium-82 positron emission tomography.
Conflict of interest statement
J. Westra acknowledges support in terms of a research grant (RÖ-1006004) from Region Östergötland; and a research grant from Lions forskningsfond mot folksjukdomer. L. Dupont Rasmussen acknowledges support in terms of a research grant (PD5Y-2023001-DCA) from the Danish Cardiovascular Academy, which is funded by the Novo Nordisk Foundation (grant number NNF20SA0067242) and The Danish Heart Foundation. E. Høj Christiansen acknowledges a research grant from Abbott. The other authors have no conflicts of interest to declare.
Supplementary data
To read the full content of this article, please download the PDF.