Cory:
Unlock Your AI Assistant Now!
Abstract
Background: Patients with coronary microvascular dysfunction (CMD) exhibit impaired vasodilatation of the microcirculation. This manifests as reduced microvascular resistance reserve (MRR) due to either increased resting flow (Qrest; functional CMD) or decreased hyperaemic flow (Qhyper; structural CMD). However, coronary flow is intimately linked to myocardial mass, potentially confounding the interpretation of flow and resistance measurements.
Aims: We investigated the relationship between subtended myocardial mass, microvascular resistance, and coronary flow to determine whether the disturbed resistance and flow patterns seen in CMD persisted after indexing by subtended myocardial mass.
Methods: We recruited 100 patients with angina with non-obstructive coronary arteries who underwent coronary computed tomography angiography to quantify vessel-specific subtended myocardial mass. Continuous intracoronary thermodilution was used to quantify absolute coronary flow and microvascular resistance, both at rest and during hyperaemia. Among patients with an MRR <3.0, hyperaemic microvascular resistance (Rμ,hyper) ≥475 Wood units (WU) defined structural CMD (versus functional CMD). Flow and resistance measurements were analysed both in absolute terms and after indexing by subtended mass.
Results: Mass and flow were analysed in 100 patients in the left anterior descending artery. The mean subtended myocardial mass in the structural CMD group (47.00±13.83 grams) was significantly lower than in the control group (59.64±21.69 grams; p=0.027), with no significant difference between the control group and the functional CMD group (53.75±13.99 grams; p=0.339). After indexing by the subtended mass, patients with structural CMD still had higher Rμ,hyper (control: 20.68±7.99 WU·kg vs structural CMD: 30.58±11.63 WU·kg; p<0.001) and lower Qhyper (control: 4.56±2.20 ml/min/g vs structural CMD: 3.20±0.90 ml/min/g; p=0.013). Conversely, patients with functional CMD exhibited similar indexed values of Rμ,hyperand Qhyper to controls.
Conclusions: Despite significantly lower subtended mass, patients with structural CMD exhibit abnormal indexed Rμ,hyper and Qhyper, supporting the notion of hyperaemic flow restriction at the tissue level that is independent of subtended mass. However, patients with functional CMD have similar subtended myocardial mass to controls and exhibit no flow restriction during hyperaemia.
Coronary microvascular dysfunction (CMD) is defined as a decrease in the vasodilatory reserve of the coronary microcirculation. It can be diagnosed invasively using either coronary flow reserve (CFR)1 or microvascular resistance reserve (MRR)2, with the latter having recently been shown to be specific for the microvascular compartment3. A reduction in CFR or MRR can arise via one of two mechanisms. Reduced resting microvascular resistance, postulated to be related to increased nitric oxide synthase activity4, can lead to increased resting coronary flow – a pattern referred to as functional CMD. Alternatively, an increase in minimal microvascular resistance, secondary to architectural changes to the microvasculature such as remodelling and plugging5, can lead to a limitation of maximal hyperaemic coronary flow – a pattern defined as structural CMD.
Importantly, the classification of patients with low vasodilatory reserve into one of these CMD subtypes requires the measurement of minimal microvascular resistance, for which the exact cutoff depends on the modality being used. When using continuous thermodilution, an absolute microvascular resistance of ≥475 Wood units (WU) has been proposed6, whilst when using bolus thermodilution, an index of microcirculatory resistance (IMR) of >25 is widely accepted7.
However, whilst microvascular resistance and coronary flow are heavily influenced by the health of the microcirculation, they are also intimately linked to the quantity of subtended myocardial mass, which has the potential to confound the interpretation of these measurements8. More specifically, minimal microvascular resistance is theoretically inversely proportional to subtended myocardial mass: the larger the subtended mass, the lower the resistance, and thus, the higher the coronary flow. As a consequence, patients with smaller than average perfusion territories will naturally exhibit higher values of minimal microvascular resistance and thus risk being misdiagnosed as having structural CMD.
To address this issue, we recruited patients with angina with non-obstructive coronary arteries (ANOCA) who underwent both continuous intracoronary thermodilution – for the measurement of absolute coronary flow and microvascular resistance – and coronary computed tomography angiography (CCTA) for the quantification of vessel-specific subtended myocardial mass. We explored the relationship between subtended myocardial mass and absolute coronary flow and resistance, and we investigated whether the disturbed resistance and flow patterns seen in CMD persisted after indexing by subtended myocardial mass.
Methods
Patient population
A total of 149 patients with ANOCA were screened for study inclusion. ANOCA was defined as the absence of an angiographically significant epicardial disease, specifically no diameter stenosis >50% and no fractional flow reserve (FFR) ≤0.80. Only patients who underwent continuous intracoronary thermodilution in the left anterior descending artery (LAD) were included. Patients with a history of myocardial infarction were excluded due to the potentially confounding effect of significant myocardial scarring on the analysis.
Patients were recruited from Cardiovascular Center OLV, Aalst, Belgium, between January 2019 and May 2023. Patients were included if they (i) had previously undergone a CCTA scan permitting the calculation of subtended myocardial mass and (ii) subsequently underwent invasive coronary angiography, including an assessment for CMD using continuous intracoronary thermodilution. The median time between CCTA and the invasive assessment was 28 days (interquartile range [IQR] 9-93). All patients provided informed consent. The study protocol was approved by the institutional review board of the Onze-Lieve-Vrouw Clinic in Aalst, Belgium (registration number: 2020/033).
CCTA for myocardial mass calculation
CCTA was acquired using a dual source computed tomography (CT) scanner (SOMATOM Force [Siemens Healthineers]) with 256 detectors, a pitch of 3.2, and 240 microns of spatial resolution. Before CCTA, all patients received 0.8 mg sublingual nitroglycerine and, in addition, intravenous metoprolol if the heart rate was ≥65 beats/min. Vessel-specific myocardial mass was quantified automatically using the Voronoi algorithm with dedicated software (Synapse 3D [Fujifilm Healthcare Solutions])9. The Voronoi algorithm is utilised to precisely partition the left ventricular (LV) volume by associating each voxel of the LV with the nearest voxel of an adjacent coronary artery. This process effectively maps the myocardial volume subtended by each coronary artery. The algorithm works by creating a Voronoi diagram, where each region contains all points closer to a specific coronary artery voxel than to any other. This detailed partitioning enables accurate quantification of the myocardial volume supplied by each artery. The Voronoi-based segmentation algorithm has been validated in an ex vivo swine heart study, demonstrating excellent accuracy9. In addition, the approach exhibits excellent intraobserver and interobserver repeatability10. Subtended mass values derived from this method have also been shown to correlate closely with invasively measured myocardial perfusion8. In addition, the approach has since been used as a gold-standard comparator to validate new approaches to the quantification of subtended mass11.
To convert the algorithm-derived volume into mass, the myocardial volume was multiplied by a constant representing myocardial tissue density (1.05 g/cm3). This is a widely accepted constant in cardiovascular imaging, having been used to convert myocardial volume to mass in numerous previous studies121314.
Study protocol
Coronary angiography
Coronary angiography was performed via radial or femoral artery access. A 6 Fr guiding catheter was used, and 0.2 mg of intracoronary isosorbide dinitrate was administered.
Continuous thermodilution
A guidewire equipped with a pressure/temperature sensor (PressureWire X [Abbott]) was connected to dedicated software for trace visualisation and analysis (CoroFlow Cardiovascular System [Coroventis]) and, after zeroing, was advanced through the guiding catheter. The pressures recorded by the pressure/temperature wire and by the fluid-filled guide catheter were equalised close to the tip of the guiding catheter. The wire was advanced into the distal part of the artery, and the temperature zeroed.
For the measurement of absolute coronary flow, a dedicated monorail infusion 2.52 Fr microcatheter with four distal side holes (RayFlow [HEXACATH]) was advanced over the pressure/temperature wire and connected to the 200 ml motorised syringe of an automated injection system (Medrad Stellant [Medrad Inc., now Bayer]) filled with room temperature saline (typically between 20°C and 23°C). The infusion catheter was advanced into the artery being investigated, and its tip was positioned into the first millimetres of the vessel. Absolute resting (Qrest) and hyperaemic (Qhyper) flow measurements were obtained using saline infusion rates of 10 ml/min and 20 ml/min, respectively. The resting and hyperaemic infusion protocols were either performed with separate runs for resting and hyperaemic states with a manually programmed infusion pump or a single run with an automatically programmed infusion pump15. Further details on performing flow measurements using coronary continuous thermodilution have been described elsewhere16.
Coronary flow and resistance indices
Absolute coronary flow (Q) in ml/min was calculated as per Equation 1, where Ti is the temperature of the infusate at the tip of the catheter, T is the temperature of mixed saline and blood in the distal vessel, and Qi is the saline infusion rate. Importantly, the values of T and Ti are relative to blood temperature.
Absolute resting microvascular resistance (Rμ,rest) in WU was calculated using Equation 2, where Pa,rest is central aortic pressure under resting conditions. Importantly, coronary autoregulation reduces Rμ,rest in the face of any epicardial resistance to ensure sufficient Qrest17. Accordingly, the use of Pa,rest adjusts for the presence of epicardial resistance, permitting the calculation of “true” Rμ,rest, i.e., Rμ,rest as would be expected in the absence of any epicardial resistance.
Absolute hyperaemic microvascular resistance (Rμ,hyper) in WU was calculated using Equation 3, where Pd,hyper is the distal coronary pressure during hyperaemia:
CFR was calculated using the following equation (Equation 4):
MRR was calculated with the following equation (Equation 5), where Pa,rest and Pa,hyper correspond to aortic pressure measured during resting and hyperaemic conditions, respectively. Unlike CFR, MRR is not influenced by the presence of epicardial resistance, making it a more specific index of microvascular function3.
Stratification by CMD subtype
Given the greater specificity of MRR than CFR for the microvascular compartment3, MRR was used to diagnose CMD, using a cutoff of <3.0, as proposed in a recent, large-scale study18. Patients with an MRR ≥3.0 were defined as controls. Among patients with an MRR <3.0, an Rμ,hyper of ≥475 WU defined structural CMD, whereas a value <475 WU defined functional CMD6. The cutoff of 475 WU was chosen as this represents the upper limit of the 95% confidence interval for Rμ,hyper in the LAD territory in normal controls19. This cutoff was subsequently proposed in a recent study by de Vos et al6. To assess the robustness of any findings, the analysis was also performed with CMD defined as a CFR <2.51. For the analysis stratified by CMD subtype (control vs functional CMD vs structural CMD), only measurements in the LAD were used, in keeping with current clinical practice16.
Indexing Q and Rµ by subtended myocardial mass and body surface area
The indexing of Q and Rμ values by subtended myocardial mass is based upon the following theory: the larger the subtended mass, the higher the Q and thus the lower the Rμ. Likewise, the smaller the subtended mass, the higher the Rμ and thus the lower the Q. Given that Q is proportional to mass, indexing requires Q to be divided by mass, and thus indexed Q (in ml/min/g)=Q/mass. On the other hand, as Rμ is proportional to 1/mass, indexing Rμ by mass requires Rμ to be divided by 1/mass, and thus indexed Rμ (in WU·kg)=Rμ x mass19. A numerical example is provided in Supplementary Figure 1. Indexed values were further indexed by body surface area (BSA) to adjust for the potential impact of body size on cardiac volume. BSA was calculated using the Mosteller formula20.
Statistics
Continuous variables with a normal distribution are expressed as mean±standard deviation and non-normally distributed variables as median and IQR. Categorical variables are expressed as counts and percentages.
Logistic regression was used for the prediction of binary variables. Multivariate regression was used to control for potential confounding variables. The following variables were included as covariates: age, sex, body mass index, smoking, hypertension, diabetes, dyslipidaemia, previous percutaneous coronary intervention, estimated glomerular filtration rate (eGFR), LV ejection fraction, baseline medications (statin, angiotensin-converting enzyme inhibitor/angiotensin receptor blocker, aspirin, other antiplatelet, antidiabetic medication), as well as heart rate and blood pressure (both extracted at the exact time of flow measurement). The final variables included in multivariate models were selected using both forward and backward selection, with only variables with a p-value<0.05 included in the final models.
Analysis of variance (ANOVA) was used to compare the mean of a given parameter across different subgroups. If ANOVA identified a significant difference between mean values, pairwise comparisons were performed using the Bonferroni post hoc test to identify which specific mean values differed. To counteract the impact of multiple testing, the Bonferroni correction was applied to p-values by multiplying them by the number of comparisons performed.
As an alternative approach to control for the impact of subtended mass on Rμ,hyper, patients with structural CMD were matched by subtended mass with control patients using propensity score matching. Balance after matching was assessed using the standardised mean difference (SMD), with an SMD <0.1 indicating an acceptable balance between groups.
All analyses were performed using Python 3.11.4 (Python Software Foundation). A p-value<0.05 was considered statistically significant.
Results
Study population
In total, 149 patients with ANOCA who underwent CCTA and subsequent invasive measurements of coronary flow and resistance in the LAD were screened for inclusion. Among them, 43 patients were excluded because of an FFR ≤0.80, and a further 6 patients were excluded because of a history of myocardial infarction. Thus, in total, 100 patients were included in the final analysis. The baseline clinical characteristics of the overall population are shown in Table 1.
Analysis stratified by CMD subtype
The population was classified into functional CMD (n=31), structural CMD (n=20), and controls (n=49). Of note, patients with structural CMD were older (control: 61.2±10.6 years, functional CMD: 61.7±10.4 years, structural CMD: 69.3±7.3 years; p=0.01), and more likely to be female (control: 36.7%, functional CMD: 58.1%, structural CMD: 75.0%; p=0.01) (Table 1). The structural CMD group also had the highest prevalence of hypertension (control: 55.1%, functional CMD: 38.7%, structural CMD: 80.0%; p=0.02) and the lowest eGFR (control: 80.4±14.6 ml/min, functional CMD: 84.3±11.3 ml/min, structural CMD: 71.2±17.3 ml/min; p=0.01). However, in a multivariate logistic regression analysis, age was the only baseline characteristic independently associated with structural CMD (Supplementary Table 1).
Table 1. Baseline characteristics of the study population, stratified by CMD subtype.
| Characteristic | Overall (n=100) | No CMD (n=49) | Functional CMD (n=31) | Structural CMD (n=20) | p-value |
|---|---|---|---|---|---|
| Age, years | 63.0±10.4 | 61.2±10.6 | 61.7±10.4 | 69.3±7.3 | 0.01* |
| Female | 51 (51.0) | 18 (36.7) | 18 (58.1) | 15 (75.0) | 0.01* |
| BMI, kg/m2 | 27.3±4.7 | 27.3±5.1 | 26.7±4.5 | 28.4±3.9 | 0.49 |
| BSA, m2 | 1.9±0.2 | 2.0±0.2 | 1.9±0.2 | 1.8±0.2 | 0.13 |
| Current smoker | 16 (16.0) | 8 (16.3) | 7 (22.6) | 1 (5.0) | 0.25 |
| Smoking history | 28 (28.0) | 13 (26.5) | 9 (29.0) | 6 (30.0) | 0.95 |
| Hypertension | 55 (55.0) | 27 (55.1) | 12 (38.7) | 16 (80.0) | 0.02* |
| Diabetes | 18 (18.0) | 6 (12.2) | 5 (16.1) | 7 (35.0) | 0.08 |
| Dyslipidaemia | 74 (74.0) | 36 (73.5) | 21 (67.7) | 17 (85.0) | 0.39 |
| FH of CAD | 10 (10.0) | 6 (12.2) | 4 (12.9) | 0 (0.0) | 0.25 |
| Previous PCI | 5 (5.0) | 2 (4.1) | 2 (6.5) | 1 (5.0) | 0.89 |
| eGFR, ml/min/1.73 m² | 79.8±14.9 | 80.4±14.6 | 84.3±11.3 | 71.2±17.3 | 0.01* |
| LVEF, % | 58.0±8.3 | 57.5±8.9 | 58.1±7.5 | 59.0±8.3 | 0.77 |
| Statin | 61 (61.0) | 28 (57.1) | 17 (54.8) | 16 (80.0) | 0.15 |
| ACEi/ARBs | 29 (29.0) | 14 (28.6) | 7 (22.6) | 8 (40.0) | 0.41 |
| Aspirin | 30 (30.0) | 16 (32.7) | 5 (16.1) | 9 (45.0) | 0.08 |
| Anticoagulation | 8 (8.0) | 5 (10.2) | 0 (0.0) | 3 (15.0) | 0.11 |
| Oral antidiabetic | 13 (13.0) | 4 (8.2) | 4 (12.9) | 5 (25.0) | 0.17 |
| Insulin | 1 (1.0) | 1 (2.0) | 0 (0.0) | 0 (0.0) | 0.59 |
| Data are n (%) or mean±standard deviation. *Indicates statistical significance. ACEi: angiotensin-converting enzyme inhibitors; ARB: angiotensin II receptor blockers; BMI: body mass index; BSA: body surface area; CAD: coronary artery disease; CMD: coronary microvascular dysfunction; eGFR: estimated glomerular filtration rate; FH: family history; LVEF: left ventricular ejection fraction; PCI: percutaneous coronary intervention | |||||
Subtended myocardial mass
The mean subtended myocardial mass in the structural CMD group (47.00±13.83 grams) was significantly lower compared to the control group (59.64±21.69 grams; p=0.027). However, there was no significant difference in subtended mass between the control and functional CMD groups (53.75±13.99 grams; p=0.339) (Table 2). In a multivariate logistic regression analysis, subtended mass was independently associated with structural CMD (Supplementary Table 1).
These differences in subtended mass corresponded to differences in total LV mass, with structural CMD having lower LV mass than the control and functional CMD groups (control: 147.46±36.57 grams, functional CMD: 133.71±34.06 grams, structural CMD: 122.74±40.77 grams; p=0.032). However, the percentage of left ventricular mass subtended by the LAD was similar between groups (control: 40.22±9.57%, functional CMD: 40.70±7.36%, structural CMD: 39.56±8.71%; p=0.903).
CFR and MRR
Compared with patients without CMD, those with functional and structural CMD had significantly lower mean CFR (control: 3.44±0.81, functional CMD: 2.00±0.45, structural CMD: 1.97±0.56; p<0.001) (Figure 1A) and MRR (control: 3.96±0.76, functional CMD: 2.31±0.49, structural CMD: 2.16±0.63; p<0.001) (Figure 1B, Table 2). Of note, there were no significant differences in CFR and MRR between the functional and structural CMD groups (Figure 1A, Figure 1B).
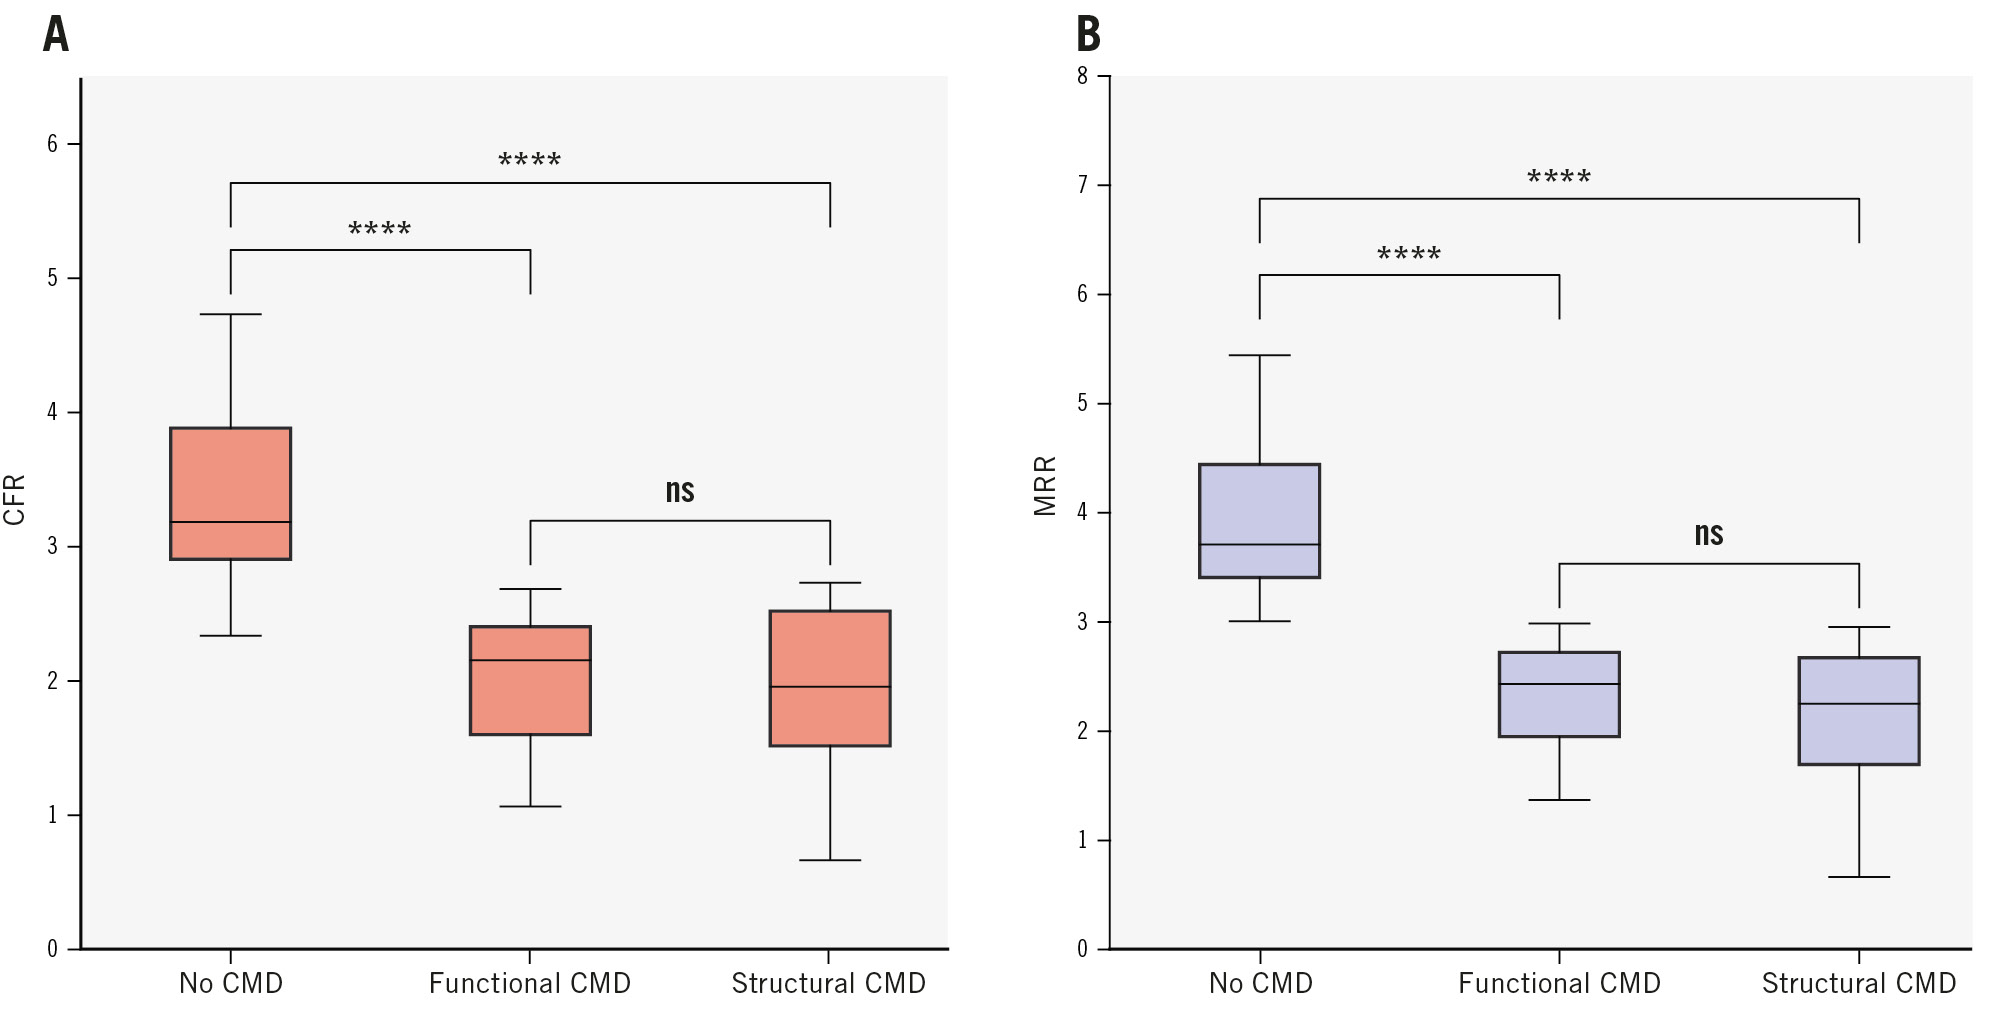
Figure 1. CFR and MRR stratified by CMD subtype. A) CFR; (B) MRR. Patients were classified into the control (MRR ≥3.0), functional CMD (MRR <3.0 and Rµ,hyper <475 WU), or structural CMD (MRR <3.0 and Rµ,hyper ≥475 WU) group. The displayed symbols correspond to the following p-values for pairwise comparisons: ns: p≥0.05; ****: p<0.0001. The Bonferroni correction was applied to p-values by multiplying them by the number of comparisons performed. CFR: coronary flow reserve; CMD: coronary microvascular dysfunction; MRR: microvascular resistance reserve; ns: non-significant; WU: Wood units
Flow and resistance in functional CMD
As per its definition, the functional CMD group had a significantly higher mean Qrest (117.18±38.68 ml/min) compared to the control group (71.04±18.33 ml/min; p<0.001), but there was no significant difference in mean Qhyper between these two groups (control: 241.09±72.87 ml/min, functional CMD: 222.40±46.35 ml/min; p=0.364) (Figure 2A, Table 2).
These findings were also reflected in the measured resistances, with a lower mean Rμ,rest in the functional CMD group (842.03±240.70 WU) compared to the control group (1,385.11±380.67 WU; p<0.001), and similar mean Rμ,hyper between these two groups (control: 355.78±93.43 WU, functional CMD: 362.84±63.51 WU; p=0.951) (Figure 2B, Table 2).
Importantly, these patterns persisted after indexing by subtended mass, with high indexed Qrest (control: 1.36±0.70 ml/min/g, functional CMD: 2.31±0.86 ml/min/g; p<0.001), low indexed Rμ,rest (control: 80.82±31.30 WU·kg, functional CMD: 45.07±17.98 WU·kg; p<0.001), but normal indexed values of Qhyper (control: 4.56±2.20 ml/min/g, functional CMD: 4.39±1.32 ml/min/g; p=1.000) and Rμ,hyper (control: 20.68±7.99 WU·kg, functional CMD: 19.33±5.68 WU·kg; p=0.757) (Figure 2C, Figure 2D, Table 2). These findings also persisted after further indexation by BSA (Supplementary Figure 2A, Supplementary Figure 2B).
Of note, the functional CMD group also exhibited a significantly higher resting heart rate than controls (control: 66.06±11.85 bpm, functional CMD: 76.58±13.93 bpm; p=0.001), with resting heart rate also shown to be an independent predictor of absolute Qrest and Rμ,rest (Supplementary Table 2). Furthermore, in multivariate logistic regression, resting heart rate was an independent predictor of functional CMD (p=0.006).
Flow and resistance in structural CMD
Structural CMD had a significantly lower mean Qhyper (142.76±37.42 ml/min) compared to the control group (241.09±72.87 ml/min; p<0.001), but with no significant difference in mean Qrest between these groups (control: 71.04±18.33 ml/min vs structural CMD: 80.34±41.76 ml/min; p=0.502). This corresponded to a higher mean Rμ,hyper (control: 355.78±93.43 WU vs structural CMD: 652.49±158.17 WU; p<0.001), but a similar mean Rμ,rest (control: 1,385.11±380.67 WU vs structural CMD: 1,432.36±587.84 WU; p=0.895) (Figure 2A, Table 2).
These findings persisted after indexing by subtended mass for both Qhyper (control: 4.56±2.20 ml/min/g vs structural CMD: 3.20±0.90 ml/min/g; p=0.013), and Rμ,hyper (control: 20.68±7.99 WU·kg vs structural CMD: 30.58±11.63 WU·kg; p<0.001) (Figure 2B, Table 2).
Indexed Qrest was also higher in the structural CMD group (control: 1.36±0.7 ml/min/g vs structural CMD: 1.85±1.16 ml/min/g; p=0.082), with a corresponding lower indexed Rμ,rest (control: 80.82±31.3 WU·kg vs structural CMD: 67.31±30.83 WU·kg; p=0.132), although these differences did not reach statistical significance (Figure 2C, Figure 2D, Table 2).
As seen with functional CMD, patients with structural CMD had a significantly higher resting heart rate compared with controls (control: 66.06±11.85 bpm vs structural CMD: 74.64±12.39; p=0.032). However, unlike with functional CMD, heart rate was not an independent predictor of structural CMD in multivariate analysis.
The robustness of these findings was also confirmed using a propensity score-matched analysis, matching patients with structural CMD with normal controls by subtended myocardial mass (Supplementary Table 3). These findings also persisted after further indexation by BSA (Supplementary Figure 2A, Supplementary Figure 2B). In addition, stratifying measurements by CFR (using a cutoff of 2.5) instead of MRR resulted in similar findings (Supplementary Figure 3).
Plots of subtended mass against flow and microvascular resistance are shown in Supplementary Figure 4. There was no significant correlation between subtended myocardial mass and resting indices. However, subtended mass exhibited a significant correlation with hyperaemic indices (Qhyper r=0.30; p=0.003; Rμ,hyper r=–0.29; p=0.004).
A summary of the study design and its main findings is shown in the Central illustration.
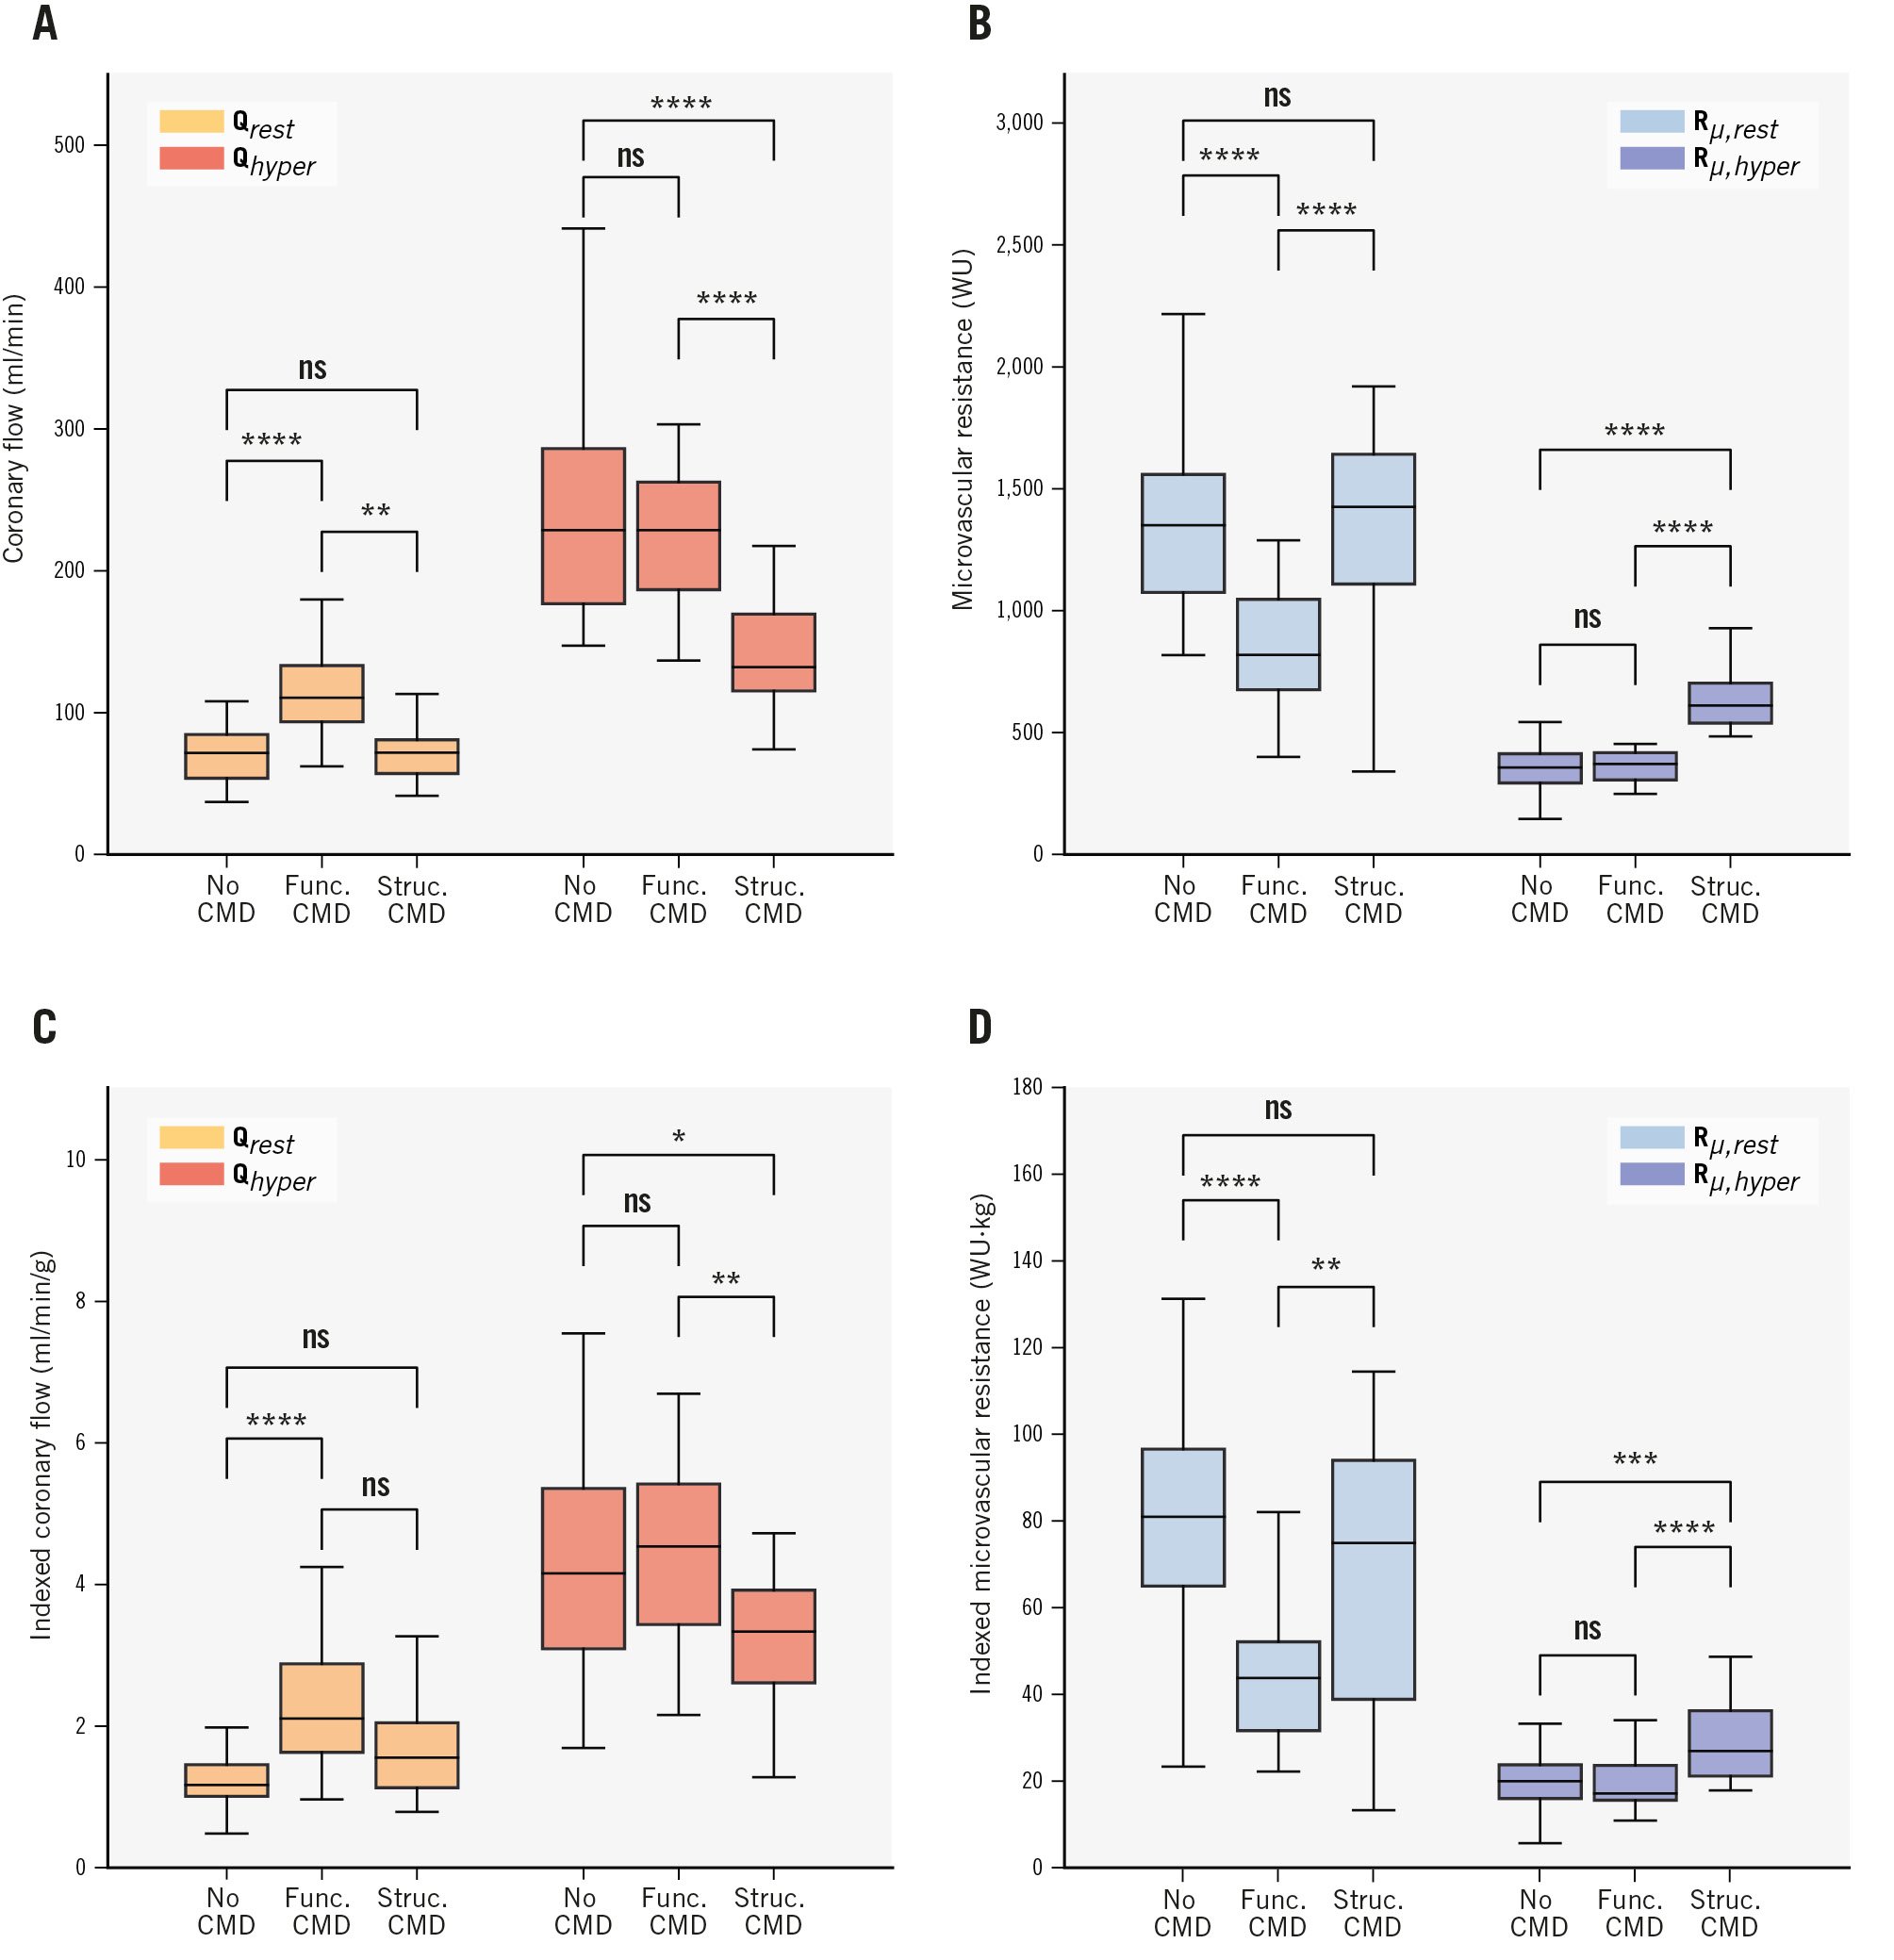
Figure 2. Comparison of flow and microvascular resistance parameters in vessels with no CMD (MRR ≥3.0), those with functional CMD (MRR <3.0 and Rµ,hyper <475 WU), and those with structural CMD (MRR <3.0 and Rµ,hyper ≥475 WU). A) Absolute coronary flow (ml/min); (B) absolute microvascular resistance (WU); (C) indexed absolute coronary flow (ml/min/g); (D) indexed absolute microvascular resistance (WU·kg). The displayed symbols correspond to the following p-values for pairwise comparisons: ns: p≥0.05; *: p<0.05; **: p<0.01; ***: p<0.001; ****: p<0.0001. The Bonferroni correction was applied to p-values by multiplying them by the number of comparisons performed. CMD: coronary microvascular dysfunction; func.: functional; MRR: microvascular resistance reserve; ns: non-significant; Qhyper: hyperaemic coronary flow; Qrest: resting coronary flow; Rµ,hyper: hyperaemic microvascular resistance; Rµ,rest: resting microvascular resistance; struc.: structural; WU: Wood units
Table 2. Mean values and standard deviations of measured parameters and calculated metrics of flow and resistance, stratified by the presence of CMD subtypes.
| Parameter | Overall (n=100) | No CMD (n=49) | Functional CMD (n=31) | Structural CMD (n=20) | p-value |
|---|---|---|---|---|---|
| Subtended mass, g | 55.29±18.66 | 59.64±21.69 | 53.75±13.99 | 47.00±13.83 | 0.03* |
| Total LV mass, g | 138.25±37.63 | 147.46±36.57 | 133.71±34.06 | 122.74±40.77 | 0.03* |
| Percentage of total LV mass | 40.24±8.69 | 40.22±9.57 | 40.70±7.36 | 39.56±8.71 | 0.90 |
| CFR | 2.70±0.99 | 3.44±0.81 | 2.00±0.45 | 1.97±0.56 | <0.001* |
| MRR | 3.09±1.08 | 3.96±0.76 | 2.31±0.49 | 2.16±0.63 | <0.001* |
| FFR | 0.86±0.03 | 0.86±0.03 | 0.87±0.03 | 0.86±0.03 | 0.50 |
| Qrest, ml/min | 87.20±37.03 | 71.04±18.33 | 117.18±38.68 | 80.34±41.76 | <0.001* |
| Mass-indexed Qrest, ml/min/g | 1.75±0.94 | 1.36±0.70 | 2.31±0.86 | 1.85±1.16 | <0.001* |
| Qhyper, ml/min | 215.63±70.02 | 241.09±72.87 | 222.40±46.35 | 142.76±37.42 | <0.001* |
| Mass-indexed Qhyper, ml/min/g | 4.23±1.82 | 4.56±2.20 | 4.39±1.32 | 3.20±0.90 | 0.02* |
| Rµ,rest, WU | 1,226.20±470.57 | 1,385.11±380.67 | 842.03±240.70 | 1,432.36±587.84 | <0.001* |
| Mass-indexed Rµ,hyper, WU·kg | 67.04±31.63 | 80.82±31.30 | 45.07±17.98 | 67.31±30.83 | <0.001* |
| Rµ,hyper, WU | 417.31±155.67 | 355.78±93.43 | 362.84±63.51 | 652.49±158.17 | <0.001* |
| Mass-indexed Rµ,hyper, WU·kg | 22.24±9.20 | 20.68±7.99 | 19.33±5.68 | 30.58±11.63 | <0.001* |
| HRrest | 71.04±13.45 | 66.06±11.85 | 76.58±13.93 | 74.64±12.39 | 0.001* |
| HRhyper | 73.42±48.84 | 64.07±12.75 | 88.62±84.52 | 72.78±11.67 | 0.09 |
| Pa,rest | 93.10±13.14 | 93.07±12.18 | 90.44±12.75 | 97.31±15.45 | 0.19 |
| Pa,hyper | 93.67±14.69 | 92.53±13.62 | 90.26±14.05 | 101.73±15.94 | 0.02* |
| Data are mean±standard deviation. *Indicates statistical significance. Only measurements from the LAD were included. The p-value for ANOVA is shown, with pairwise comparison p-values shown in the corresponding figure. ANOVA: analysis of variance test; BSA: body surface area; CFR: coronary flow reserve; CMD: coronary microvascular dysfunction; FFR; fractional flow reserve; HR: heart rate; hyper: hyperaemic; LAD: left anterior descending artery; LV: left ventricular; MRR: microvascular resistance reserve; rest: resting; Pa: central aortic pressure; Q: absolute coronary flow; Rµ: microvascular resistance; WU: Wood units | |||||
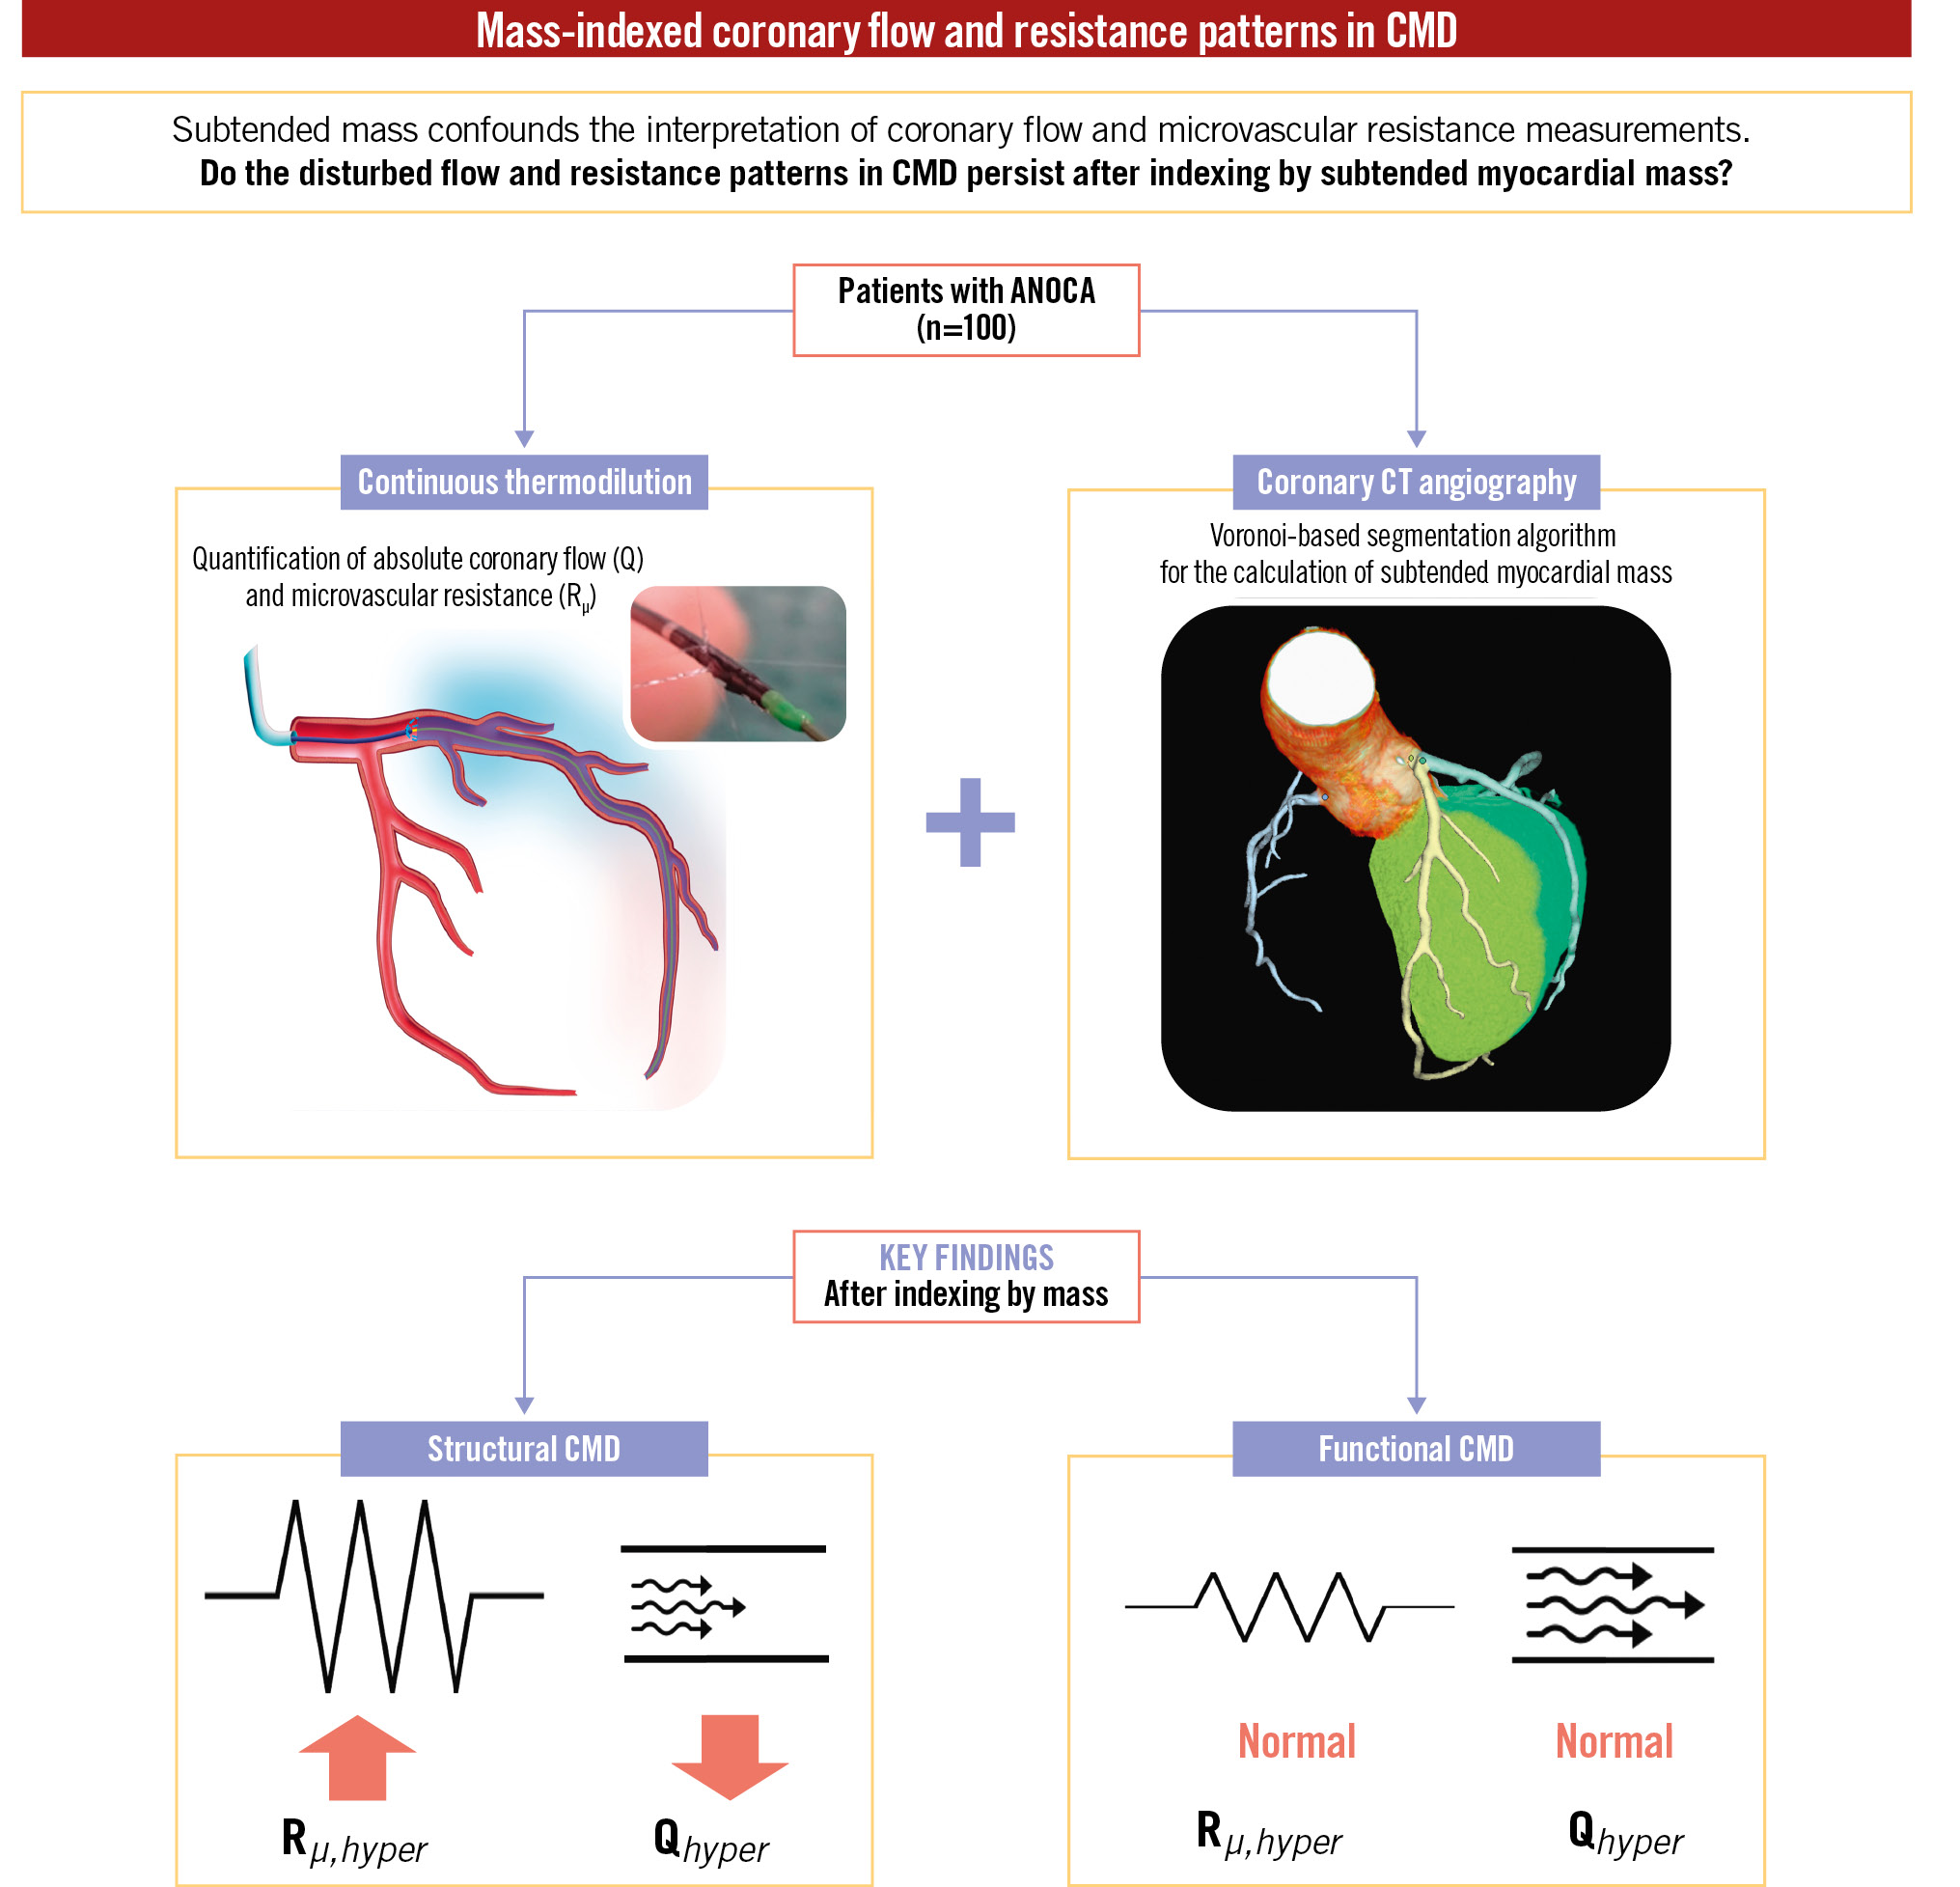
Central illustration. Summary of study design and main findings. ANOCA: angina with non-obstructive coronary arteries; CMD: coronary microvascular dysfunction; CT: computed tomography; Qhyper: hyperaemic coronary flow; Rµ,hyper: hyperaemic microvascular resistance
Discussion
The present study provides the first analysis of coronary flow and resistance patterns in CMD, both in absolute terms and after indexing by subtended myocardial mass. The principal findings of this study can be summarised as follows:
i. Patients with functional CMD had similar subtended mass and exhibited similar indexed values of Rμ,hyper and Qhyper to controls, suggesting the absence of any restriction of hyperaemic coronary flow.
ii. Patients with structural CMD, despite having significantly lower subtended myocardial mass, exhibited higher indexed Rμ,hyper and lower indexed Qhyper than both controls and patients with functional CMD.
Taken together, these findings support the notion of restricted hyperaemic coronary flow at the tissue level in structural CMD. However, the present data also highlight the lack of a clear pathophysiological mechanism for the symptoms experienced by patients with functional CMD.
The relationship between subtended myocardial mass, Q and Rµ
Whilst the relationship between subtended myocardial mass and vessel geometry (e.g., luminal diameter/area, vessel length) has long been established2122, data on the relationship between subtended mass and coronary flow have been limited to porcine studies and in vitro simulations23. The recent development of continuous intracoronary thermodilution has permitted the accurate and precise measurement of absolute coronary flow which, when combined with the concomitant measurement of Pa and Pd, also permits the calculation of absolute microvascular resistance16. Furthermore, the accuracy of the Voronoi-based segmentation algorithm for the calculation of subtended myocardial mass has already been demonstrated9. Keulards et al previously demonstrated the feasibility of combining continuous intracoronary thermodilution with CT-derived vessel-specific subtended myocardial mass for the calculation of myocardial perfusion8.
It is worth noting that positron emission tomography (PET) also permits the quantification of blood flow per gram of tissue (myocardial blood flow; MBF)24. The mean indexed Qrest in the control group (1.36 ml/min/g) corresponded with the upper limit of previously reported PET MBF measured in healthy volunteers (0.7-1.2 ml/min/g)24. In addition, the mean indexed Qhyper in the control group of 4.56 ml/min/g also corresponded with the 3- to 5-fold increase in MBF typically seen during stress with PET25. However, combining continuous intracoronary thermodilution and CCTA provides two distinct advantages. First, it permits the absolute quantification of total coronary blood (i.e., in ml/min) for a given artery. Second, combining invasive flow measurements with concomitant invasive pressure measurements permits the calculation of the quintessential metric of microvascular function, microvascular resistance (both total and indexed).
Functional CMD is associated with normal absolute and indexed Rµ,hyper and Qhyper
This study also demonstrates that the absolute flow and resistance pattern seen in functional CMD is also present after indexing by subtended myocardial mass. This finding is unsurprising given that these patients exhibited similar overall LV mass and similar quantities of myocardial mass subtended by the LAD as compared to controls. However, Rμ,hyper and Qhyper, both in absolute terms and after indexing by subtended mass, were shown to be strictly normal in these patients, suggesting a complete absence of a disease process that limits the physiological decrease of Rμ during hyperaemia. These findings raise questions about the plausibility of the functional CMD phenotype as an explanation for exertional symptoms in these patients. Whilst increased resting nitric oxide synthase activity is the likely explanation for the increased Qrest4, from a pathophysiological standpoint, it remains difficult to attribute patient symptoms to this finding. It is postulated that the reduced resting microvascular resistance and elevated resting coronary flow are related to increased nitric oxide synthase activity in functional CMD4. Yet, coronary flow is controlled by more than just nitric oxide. At any given moment, flow is carefully regulated to match current myocardial oxygen demand. A multitude of factors ultimately define myocardial oxygen demand, with heart rate, contractility, and left ventricular wall stress – i.e., mechanical factors – logically being the predominant drivers26. In the present study, a higher resting heart rate was seen in patients with functional CMD as compared to controls, with resting heart rate also shown to be an independent predictor of Qrest and functional CMD (but not structural CMD). This finding provides a potentially interesting mechanistic insight into its pathology.
In our cohort of ANOCA patients, subtended mass exhibited a significant, weak linear relationship with flow and microvascular resistance in the hyperaemic state, with no significant relationship seen in the resting state. This suggests that other factors contribute significantly to determining coronary flow, although there are some important caveats to this finding. First, the present cohort contained many patients with CMD – both functional and structural – with the resultant impairment of resting and hyperaemic indices, respectively, likely affecting correlations. Second, during hyperaemia, the presence of concomitant epicardial disease (even non-significant) has a clear impact on Qhyper which exhibits a linear relationship with FFR17. Given the definition of ANOCA includes patients with an FFR as low as 0.81, Qhyper can be reduced to as low as 81% of what would be expected in the complete absence of epicardial disease. Importantly, in the resting state, epicardial disease has no impact on Qrest unless it is extremely severe due to coronary autoregulation17. Third, this study likely highlights an underestimated phenomenon – the elusiveness of the “resting” state. Whilst the induction of maximal hyperaemia results in a consistent and repeatable decrease in Rμ,hyper, it is not possible to assess a fixed “resting” state as microvascular resistance and coronary flow are constantly adapting to match myocardial needs, making the true “resting” state fragile and transient in nature27. This is further illustrated by the increased variability of flow and resistance measurements at rest as compared with hyperaemia28. The importance of mechanical factors that are influenced by sympathetic tone in determining resting flow raises the possibility that some patients with increased Qrest may simply be manifesting increased sympathetic drive (e.g., anxiety, stress, autonomic dysfunction)29. We speculate that the functional CMD phenotype may, at least in part, be explained by this phenomenon.
Structural CMD: pattern of Q and Rµ is independent of subtended mass
Our results demonstrate that patients with structural CMD have a lower overall LV mass and a lower myocardial mass subtended by the LAD. As a consequence, the higher Rμ,hyper (and thus lower Qhyper) seen in structural CMD could theoretically simply be attributed to the lower subtended mass seen in this group. However, our data demonstrate that these findings are independent of subtended mass, suggesting that this flow/resistance pattern persists at the gram of tissue level. This finding provides support for the notion that a pathological process at the myocardial level is responsible for the increased resistance seen in these patients30. Numerous architectural changes to the microvasculature have been proposed to induce structural CMD, including microcirculatory remodelling, capillary rarefaction and microcirculatory plugging5. It is these changes that are likely responsible for the increase in Rμ,hyper that manifests as a reduced vasodilatory response4, and ultimately, the angina seen in these patients.
Limitations
First, this analysis focused on measurements in the LAD. This approach reflected current clinical practice, where it is recommended to assess CMD in this vessel16. However, whilst the inclusion of right coronary and left circumflex arteries would have enriched the dataset, we do not believe it would have changed the findings of this study.
Second, only continuous thermodilution was used to measure flow and resistance, as the use of other modalities such as bolus thermodilution and Doppler was not within the remit of this work. Whilst we recognise that continuous thermodilution is less widely available than bolus thermodilution, its superior precision and accuracy, along with its capacity to quantify both flow and resistance in absolute terms, justified its choice in this proof-of-concept study31323334.
Third, only a modest number of patients were included in this study, reflecting the novel use of both CCTA and continuous intracoronary thermodilution. However, the cohort was of sufficient size to address the scientific questions addressed by this study.
Fourth, the study population includes only patients who underwent both CCTA and the invasive microvascular assessment. Whilst we frequently employ CCTA and subsequently refer patients with highly suggestive symptoms and no evidence of significant epicardial disease for an invasive evaluation, there is an inevitable risk of selection bias in this study.
Fifth, the present study stratified patients with CMD into functional/structural CMD as proposed by Rahman et al4. Whilst this system identifies two distinct physiological CMD subtypes, other CMD endotypes likely exist beyond this system that remain to be elucidated. Overall, it is important to recognise that the diagnosis of CMD should be made by using Rμ,hyper and MRR (or CFR) in conjunction, as these parameters provide complementary information on microvascular function35.
Finally, the presence of disease processes such as diabetes, kidney disease, or hypertension could theoretically impact myocardial structure and, thus, density. However, there is currently no validated approach for adjusting the myocardial tissue density constant for the presence of such diseases. Consequently, we applied the widely accepted value of 1.05 g/cm3 for the present study121314.
Conclusions
Despite a significantly lower subtended mass, patients with structural CMD still exhibit abnormal indexed Rμ,hyper and Qhyper, supporting the notion of hyperaemic flow restriction at the tissue level. However, patients with functional CMD exhibit similar indexed Rμ,hyper and Qhyper to controls, indicating the absence of any flow restriction during hyperaemia in these patients.
Impact on daily practice
Coronary flow is intimately linked to myocardial mass, potentially confounding the interpretation of flow and resistance measurements. In the present study, despite having significantly lower subtended mass, patients with structural coronary microvascular dysfunction (CMD) had significantly higher microvascular resistance and lower coronary flow during hyperaemia after indexing by subtended myocardial mass, supporting the notion of flow restriction at the tissue level. However, patients with functional CMD had similar subtended myocardial mass to controls and exhibited no flow restriction during hyperaemia. This study provides valuable pathophysiological insights as it confirms the flow/resistance abnormality driving symptoms in structural CMD whilst highlighting the lack of a clear pathophysiological mechanism for symptoms in functional CMD.
Conflict of interest statement
T. Mahendiran is supported by a grant from the Swiss National Science Foundation (SNSF). M. Viscusi reports receiving research grants provided by the CardioPath PhD programme. A. Wilgenhof and S. Corradetti are supported by a research grant from the DigiCardioPaTh PhD programme, Sapienza University, Rome, Italy. C. Collet reports receiving research grants from Biosensors, Coroventis Research, Medis Medical Imaging, Pie Medical Imaging, CathWorks, Boston Scientific, Siemens, HeartFlow, and Abbott; and consultancy fees from HeartFlow, OpSens, Abbott, and Philips Volcano. N.H.J. Pijls received institutional research grants from Abbott; has consulting relationships with and receives fees from Abbott and Coroventis; has equity in ASML, GE HealthCare, HeartFlow, and Philips; is a member of the Scientific Advisory Board (SAB) of Heartflow; and has patents pending in the field of the coronary microcirculation and aortic valve stenosis. B. De Bruyne has a consulting relationship with Boston Scientific, Abbott, CathWorks, Siemens, and Coroventis Research; receives research grants from Abbott, Coroventis Research, CathWorks, Boston Scientific; and holds minor equities in Philips Volcano, Siemens, GE HealthCare, Edwards Lifesciences, HeartFlow, Sanofi, and Celyad. The other authors have no conflicts of interest to report.
Supplementary data
To read the full content of this article, please download the PDF.