Cory:
Unlock Your AI Assistant Now!
Abstract
BACKGROUND: Recent observations in silico and in vivo reported that, during proximal optimisation technique, drug-eluting stents (DES) elongate, challenging conventional wisdom. The interaction between plaque morphology and radial expansion is well established, but little is known about the impact of plaque morphology on elongation.
AIMS: We aimed to assess the longitudinal mechanical behaviour of contemporary DES in vivo and evaluate the relationship between post-percutaneous coronary intervention (PCI) stent elongation and lesion morphology, as assessed with optical coherence tomography (OCT).
METHODS: Patients treated with OCT-guided PCI to left main or left anterior descending artery bifurcations, between July 2017 and March 2022, from the King’s Optical coherence Database Analysis Compendium were included. Patients were excluded if there were overlapping stents, if they had undergone prior PCI, or if there was inadequate image quality. Lesions were characterised as fibrocalcific, fibrous or lipid-rich by pre-PCI OCT. Following stent post-dilatation, stent expansion and final stent length were assessed. The primary outcome was the percentage change in stent length from baseline.
RESULTS: Of 501 eligible consecutive patients from this period, 116 were included. The median age was 66 years (interquartile range [IQR] 57-76), 31% were female, and 53.4% were treated for an acute coronary syndrome. A total of 50.0% of lesions were classified as fibrocalcific, 6.9% were fibrous, and 43.1% were lipid-rich. The change in relative stent length was 4.4% (IQR 1.0-8.9), with an increase of 3.1% (IQR 0.5-6.3) in fibrocalcific lesions, 3.3% (IQR 0.5-5.9) in fibrous lesions, and 6.4% (IQR 3.1-11.1) in lipid-rich plaque (p=0.006). In multivariate regression modelling, lipid-rich plaque was an independent predictor of stent elongation (odds ratio 3.689, 95% confidence interval: 1.604-8.484).
CONCLUSIONS: Contemporary DES elongate following implantation and post-dilatation, and this is significantly mediated by plaque morphology. This is an important consideration when planning a strategy for DES implantation.
Coronary artery disease (CAD) is the most common cause of death globally and is routinely treated with drug-eluting stents (DES), in stable and acute settings12. Contemporary second- and third-generation DES are characterised by thin (or ultrathin) struts and sophisticated platform designs that provide excellent deliverability and high radial strength, with low rates of thrombosis and restenosis3. Understanding the biomechanical properties of contemporary DES in vivo is critical to ensure their appropriate and effective use, particularly in the treatment of bifurcation lesions. The expansion capacities and radial mechanical strength of contemporary DES have been extensively studied, but less is known about the longitudinal mechanical properties of contemporary platforms and how this affects in vivo behaviour45.
Conventional wisdom, based on early observations of self-expanding stents, proposed that stents shorten during overexpansion and proximal optimisation technique (POT)6. However, recent analyses from in silico models and in vivo assessment with optical coherence tomography (OCT) have challenged this paradigm. In these studies, the performance of POT was associated with proximal elongation of the DES789. Although the number of patients in these studies was small, the clinical repercussions may be highly significant – unpredictable longitudinal stent behaviour may lead to ostial stent protrusion, unintentional side branch coverage, major stent malapposition and proximal underexpansion, potentially increasing the risk of stent failure310.
Plaque morphology, which is assessed with intracoronary (IC) imaging, influences percutaneous coronary intervention (PCI) technique and may predict a stent’s mechanical behaviour in vivo. The interaction of plaque morphology and radial expansion is well described, but the relationship between plaque morphology and longitudinal mechanical behaviour in vivo is unclear11. An improved understanding of the in vivo longitudinal properties of DES, the factors that influence elongation, and how we may minimise associated adverse sequelae is required.
Accordingly, the purpose of this study was to describe the extent of stent elongation in a large real-world cohort and to evaluate the relationship between pre-PCI plaque morphology and longitudinal stent behaviour during coronary bifurcation PCI.
Methods
STUDY SETTING
The King’s Optical coherence Database Analysis Compendium (KODAC) is a single-centre, retrospective registry of 1,838 consecutive patients who underwent invasive assessment with IC OCT at King’s College Hospital between March 2013 and March 2022. King’s College Hospital is a large, tertiary cardiac centre, serving a population of approximately two million people in central London, United Kingdom. Cases in the KODAC Registry include patients with stable angina and those admitted with acute coronary syndromes, including emergency primary PCI for ST-segment elevation myocardial infarction (STEMI). Indications for OCT assessment and its utilisation remained at the treating clinician’s discretion.
STUDY POPULATION AND DATA COLLECTION
Patients treated with second- or third-generation DES for de novo atherosclerotic bifurcation lesions were included. To ensure the use of contemporary DES platforms, we restricted analysis to procedures performed between 1 July 2017 and 31 March 2022, identifying consecutive adult patients with paired pre- and post-PCI OCT assessment. To minimise any effect from vessel tortuosity or curvature, only patients treated with PCI to bifurcation lesions in the left main stem (LMS) and/or left anterior descending artery (LAD) were included. Bifurcation lesions were defined as a 50% coronary stenosis adjacent to and/or involving an adequate-sized side branch (SB; ≥2.0 mm in reference diameter), with the lesion located ≤4 mm from the point of bifurcation, as assessed by angiography. These definitions are in accordance with recent consensus from the Bifurcation Academic Research Consortium12.
Patients were excluded if one or more of the following criteria were met: (1) prior PCI had been performed in the region of interest; (2) images were of insufficient quality to allow accurate interpretation (i.e., entire stent length was not captured in a single OCT run, or successive images in the region of interest had >1 quartile obscured by artefact or thrombus); (3) overlapping stents were present (including those treated with a culotte or “inverted culotte” technique) – two-stent techniques that did not involve longitudinal stent overlap in the main branch were included (e.g., double-kissing [DK] crush or T/T and small protrusion [T/TAP])
Baseline characteristics were collected from medical records and from the British Cardiovascular Intervention Society (BCIS) audit database, including age, sex, clinical syndrome and cardiovascular risk factors13.
IMAGE ANALYSIS & PROCEDURAL DATA
OCT images were acquired using a frequency domain OCT system (Abbott) and submitted to the KODAC Registry. Lesions were categorised as fibrocalcific, fibrous, or lipid-rich, based on pre-PCI assessment with OCT. In accordance with established criteria, fibrous plaques were defined as homogeneous, signal-rich lesions. Lipid pools appear as signal-poor regions with a diffuse border and overlying signal-rich bands (fibrous caps), with high signal attenuation. Where the lipid arc extends beyond 90°, the lesion was defined as lipid-rich. Calcified plaques are signal-poor regions with sharply delineated borders and limited shadowing, with calcified nodules defined as single or multiple regions of calcium that protrude into the lumen. Thin-cap fibroatheromas were defined as lipid-rich lesions with a minimum fibrous cap thickness ≤65 μm14. A fibrous cap was identified as a signal-rich band overlying the lipid core. The minimum fibrous cap thickness was measured 3 times at its thinnest part, and the average value was recorded15.
In stenoses where more than one morphology was present, lesions were categorised based on a qualitative assessment of the predominant morphology at the site of the minimum lumen area (and frames 2 mm either side). The OCT images were independently assessed by two interventional cardiologists (M. McGarvey and L.-T. Lam), and in the case of discrepancy, a third interventional cardiologist (N. Pareek) adjudicated. Validation of the reliability of this method was provided by an independent expert in IC imaging (T.W. Johnson).
Stent inflow and outflow were defined as the proximal and distal frames where stent struts occupied ≥180° of a vessel circumference on OCT. Post-PCI stent length was the distance measured between these points on the longitudinal view. Minimum stent area (MSA) and relative stent expansion (defined as the MSA divided by the mean of the proximal and distal reference areas) was recorded16. We sought to assess the importance of proximal and distal stent expansion using criteria set out in the ILUMIEN IV: OPTIMAL PCI trial protocol. Briefly, the stent was divided in two, either into equal segments or at the site of bifurcation (i.e., side branch ≥2.0 mm diameter). The MSA in the proximal and distal segments were defined relative to the proximal and distal reference values, respectively17. Finally, we evaluated the stent expansion index (SEI), a modified form of the ILUMIEN protocol. SEI requires the identification of the MSA in each half of the divided stent, along with the proximal and distal reference values in each stent segment. Relative stent expansion was calculated in each segment, with the smaller value representing the SEI18.
The stent manufacturer and platform, index stent length and diameter, and POT balloon diameter were extracted from procedural reports. The nominal size of the POT balloon was taken as the diameter, and this was not adjusted to pressure-diameter charts.
OUTCOMES
The primary outcome measure in this study is the percentage change in stent length from baseline after performance of post-dilatation and POT. Secondary outcomes include the absolute change in stent length from baseline and markers of post-PCI stent expansion including the MSA, relative stent expansion, proximal and distal segment stent expansion, and the SEI.
STATISTICAL ANALYSIS
Baseline patient, lesion and procedural characteristics are presented as frequencies or mean±standard deviation for normally distributed variables, and as medians with interquartile range (IQR) for non-normally distributed data. The Shapiro-Wilks test of normality was applied to all continuous variables. Between-group comparisons were performed with the chi-square test for proportions; one-way analysis of variance (ANOVA) was used for continuous, normally distributed variables (with Tukey’s post hoc test for paired comparisons between groups); and the Kruskal-Wallis one-way ANOVA was performed for comparison of non-normally distributed variables.
Logistic regression analysis was used to assess if key lesion and procedural characteristics predicted a greater than median percentage stent elongation in vivo. Greater than median stent elongation was chosen as the outcome to avoid imbalance in the regression model19. Continuous variables were not categorised or dichotomised to optimise power in the regression model20. We performed exploratory univariable logistic regression to identify candidate variables that may be associated with a greater than median percentage stent elongation in this population. Results are presented as odds ratios (OR) with 95% confidence intervals (CI). Variables that were found to be statistically significant in relation to a greater than median percentage stent elongation were entered into a multivariable logistic regression model to identify independent predictors of a greater than median percentage elongation.
A p-value<0.05 was considered statistically significant, with a Bonferroni correction for the adjustment of p-value for the paired comparison of subgroups. Analyses were performed with SPSS Statistics, version 29.0.2.0 (IBM) and Prism, version 9.0 (GraphPad Software).
ETHICS & ROLE OF THE FUNDING SOURCE
This project operated under the Health and Social Care Research Ethics Committee B approval (reference 23/NI/0077) granted to the King’s College London Cardiovascular Diseases Database (KCL-CVD). The funders had no role in study design, data collection and analysis, decision to publish, or preparation of the manuscript. The study was performed according to the principles of the Declaration of Helsinki.
Results
Between 1 July 2017 and 30 March 2022, 501 consecutive patients in the KODAC Registry underwent OCT-guided PCI of the left main and/or LAD coronary arteries. A total of 116 were deemed eligible for inclusion in this study. We excluded 231 patients due to treatment with overlapping stents, 58 patients underwent DES PCI for in-stent restenosis, and 24 patients were treated with “plain old balloon” or drug-coated balloon angioplasty only. A further 46 patients were excluded, as no pre-PCI OCT assessment was performed, and in 18 patients, inadequate OCT image quality precluded accurate classification of plaque morphology or assessment of post-PCI stent length and expansion. In addition, 8 patients had lesions that did not satisfy the definition of a bifurcation and were excluded (Figure 1).
The median age of the patients was 66 years (IQR 57-76), and 31.0% (n=36/116) were female. In total, 53.4% (n=62/116) patients were treated following an acute coronary syndrome, and 23.7% (n=27/114) had a history of myocardial infarction. Type 2 diabetes mellitus was present in 33.0% (n=37/112) of patients, 58.6% (n=68/116) had hypertension, and 5.3% (n=6/113) had chronic kidney disease (Table 1). A total of 58 (50.0%) lesions were classified as fibrocalcific, 8 (6.9%) as fibrous, and 50 (43.1%) as lipid-rich. A sample of 43 baseline OCTs were assessed and categorised by an independent external OCT expert (T.W. Johnson). Assessment of the inter-rater reliability of lesion categorisation demonstrated substantial agreement, with a Cohen’s κ statistic of 0.70121.
Fibrocalcific lesions demonstrated greater maximum calcium arc (p<0.001), maximum calcium depth (p<0.001), and calcium length (p<0.001) compared to fibrous and lipid-rich plaques. In all, 53.4% (n=31/58) of fibrocalcific lesions had a calcium volume index of 4, and 37.9% (n=22/58) contained a calcified nodule. Lipid-rich lesions had thinner minimum fibrous cap thickness (p=0.002), greater maximum lipid arc (p<0.001) and greater lipid length (p<0.001) (Table 2).
Patients with fibrocalcific lesions were older and were more likely to have a history of hypercholesterolaemia and diabetes mellitus. Baseline angiographic and procedural characteristics were otherwise similar (Table 3). True bifurcation disease (i.e., Medina classification 1,1,1 or 1,0,1 or 0,1,1)12 was evident in 26.7% (n=31/116) of cases, with 31.9% (n=37/116) of lesions involving the LMS bifurcation. LAD/first diagonal bifurcations were treated in 57.8% of cases (n=67/116), with a further 10.3% of cases (n=12/116) involving the LAD/second diagonal bifurcation.
XIENCE cobalt-chromium everolimus-eluting stents (CoCr-EES [Abbott]) were used for the majority of procedures (n=78/116, 67.2%). A total of 25/116 patients (21.6%) were treated with SYNERGY platinum-chromium (PtCr)-EES (Boston Scientific), 7/116 (6.0%) with Promus PREMIER PtCr-EES (Boston Scientific), 4/116 (3.4%) with Resolute Onyx cobalt-nickel zotarolimus-eluting stents (CoNi-ZES [Medtronic]), and 2/116 patients (1.7%) were treated with Orsiro CoCr sirolimus-eluting stents (SES [Biotronik]).
The nominal baseline stent length was 28.0 mm (IQR 23.0-38.0), and the nominal baseline stent diameter was 3.0 mm (IQR 2.75-3.50). Proximal optimisation or post-dilatation was performed in all cases. The maximum median post-dilatation balloon diameter was 3.75 mm (IQR 3.5-4.0), with a median POT balloon overexpansion of 117% (IQR 113-133), relative to the nominal stent diameter.
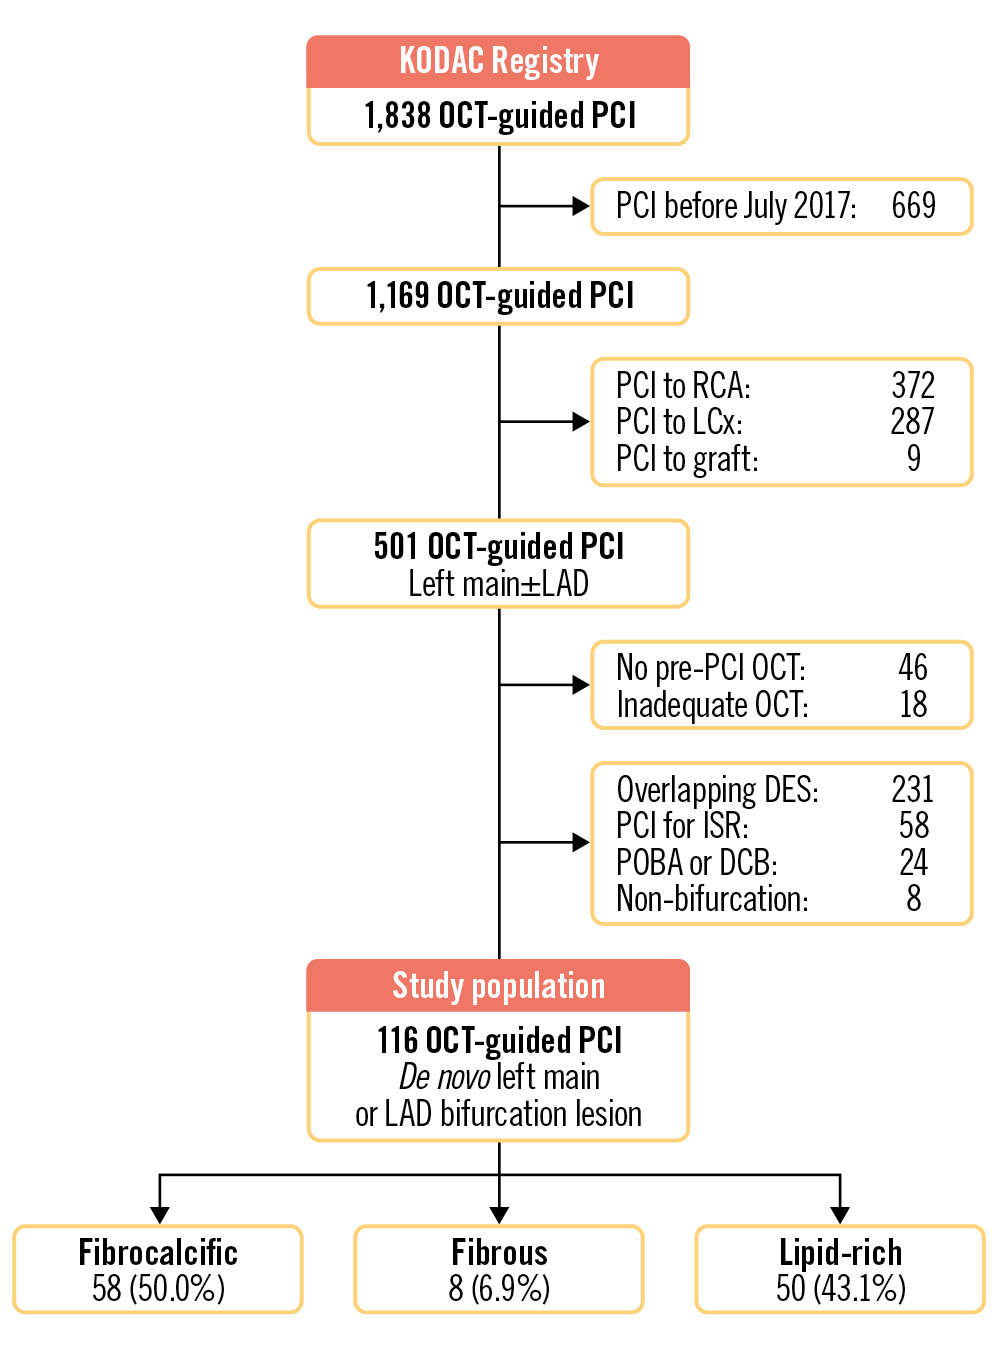
Figure 1. Flowchart of patients from the KODAC Registry included in the study. DCB: drug-coated balloon; DES: drug-eluting stent; ISR: in-stent restenosis; KODAC: King’s Optical coherence Database Analysis Compendium; LAD: left anterior descending artery; LCx: left circumflex artery; OCT: optical coherence tomography; PCI: percutaneous coronary intervention; POBA: plain old balloon angioplasty; RCA: right coronary artery
Table 1. Baseline patient characteristics.
| Total population (N=116) | Fibrocalcific plaque (N=58) | Fibrous plaque (N=8) | Lipid-rich plaque (N=50) | p-value | |
|---|---|---|---|---|---|
| Age, years | 66 (57-76) | 73 (63-79) | 65 (60-69) | 58 (50-69) | <0.001 |
| Female | 36/116 (31) | 18/58 (31) | 3/8 (37.5) | 15/50 (30) | 0.913 |
| ACS | 62/116 (53.4) | 28/58 (48.3) | 4/8 (50.0) | 30/50 (60.0) | 0.467 |
| Hypertension | 68/116 (58.6) | 38/58 (65.5) | 5/8 (62.5) | 25/50 (50.0) | 0.257 |
| Hypercholesterolaemia | 46/116 (39.7) | 29/50 (50.0) | 4/8 (50.0) | 13/50 (26.0) | 0.033 |
| Previous MI | 27/114 (23.7) | 18/56 (32.1) | 0/8 (0) | 9/50 (18.0) | 0.061 |
| Diabetes mellitus | 37/112 (33.0) | 25/57 (43.9) | 3/8 (37.5) | 9/47 (19.1) | 0.027 |
| Stroke/TIA | 3/116 (2.6) | 1/58 (1.7) | 0/8 (0) | 2/50 (4.0) | 0.677 |
| Chronic kidney disease (Creatinine >200 µmol or HDx) |
6/113 (5.3) | 3/55 (5.4) | 2/8 (25) | 1/50 (2.0) | 0.008 |
| Current smoker | 15/98 (15.3) | 5/47 (10.6) | 0/7 (0) | 10/44 (22.7) | 0.141 |
| Values are median (IQR), or n/N (%). P-values in bold indicate statistical significance. Proportions were compared using chi-square tests. Medians were compared using the Kruskal-Wallis one-way ANOVA. ACS: acute coronary syndrome; ANOVA: analysis of variance; HDx: expanded haemodialysis; IQR: interquartile range; MI: myocardial infarction; TIA: transient ischaemic attack | |||||
Table 2. Optical coherence tomography assessment of lesion characteristics.
| Total population (N=116) | Fibrocalcific plaque (N=58) | Fibrous plaque (N=8) | Lipid-rich plaque (N=50) | p-value | |
|---|---|---|---|---|---|
| Lesion dimensions | |||||
| Minimum lumen area, mm2 | 2.42 (1.90-3.02) | 2.45 (1.81-3.14) | 3.19 (2.39-3.94) | 2.26 (1.95-2.90) | 0.116 |
| Proximal reference diameter, mm | 3.90 (3.60-4.24) | 3.90 (3.53-4.20) | 3.79 (3.37-4.28) | 3.94 (3.75-4.39) | 0.269 |
| Distal reference diameter, mm | 3.11 (2.86-3.02) | 3.10 (2.80-3.50) | 2.98 (2.49-3.38) | 3.15 (2.92-3.68) | 0.216 |
| Proximal reference area: MLA ratio | 4.43 (3.34-5.83) | 3.92 (2.99-5.52) | 2.92 (2.29-5.49) | 4.65 (4.02-6.20) | 0.019 |
| Morphological characteristics | |||||
| Maximum lipid arc,° | 150.5 (96.7-150.5) | 124.0 (88.0-166.9) | 79.6 (15.0-84.6) | 200.5 (139.8-265.3) | <0.001 |
| Lipid length, mm | 6.20 (2.90-10.90) | 3.40 (2.15-6.20) | 4.20 (0.75-7.50) | 10.85 (8.38-13.25) | <0.001 |
| Minimum fibrous cap thickness, μm | 110 (85.3-150.0) | 127.5 (98.8-166.3) | 165.0 (102.5-327.5) | 101.5 (75.0-130) | 0.002 |
| Thin-cap fibroatheroma | 11/116 (9.5) | 1/58 (1.7) | 0/8 (0.0) | 10/50 (20.0) | 0.003 |
| Calcium morphology | <0.001 | ||||
| No calcium | 31/116 (26.7) | 0/58 (0.0) | 5/8 (62.5) | 26/50 (52.0) | |
| Sheet calcium only | 60/116 (51.7) | 36/58 (60.0) | 3/8 (37.5) | 21/50 (42.0) | |
| Concentric calcium | 7/116 (6.0) | 7/58 (12.1) | 0/8 (0.0) | 0/50 (0.0) | |
| Calcified nodule | 25/116 (21.6) | 22/58 (37.9) | 0/8 (0.0) | 3/50 (6.0) | |
| Maximum calcium arc,° | 111.5 (0.0-197.8) | 186 (130.3-257.4) | 0 (0.0-64.4) | 0 (0.0-99.3) | <0.001 |
| Maximum calcium depth, mm | 0.77 (0.00-1.04) | 0.99 (0.82-1.15) | 0.0 (0.0-0.44) | 0.0 (0.0-0.71) | <0.001 |
| Calcium length, mm | 4.90 (0.0-10.20) | 9.20 (6.03-16.38) | 0.0 (0.0-2.2) | 0.0 (0.0-3.78) | <0.001 |
| Calcium volume index | <0.001 | ||||
| 0 | 39/116 (33.6) | 1/58 (1.7) | 7/8 (87.5) | 31/50 (62.0) | |
| 1 | 20/116 (17.2) | 8/58 (6.9) | 1/8 (12.5) | 11/50 (22.0) | |
| 2 | 21/116 (18.1) | 16/58 (27.6) | 0/8 (0.0) | 5/50 (10.0) | |
| 3 | 2/116 (1.7) | 2/58 (3.4) | 0/8 (0.0) | 0/50 (0.0) | |
| 4 | 34/116 (29.3) | 31/58 (53.4) | 0/8 (0.0) | 3/50 (6.0) | |
| Values are median (IQR), or n/N (%). P-values in bold indicate statistical significance. Proportions were compared using chi-square tests. Medians were compared using the Kruskal-Wallis one-way ANOVA. ANOVA: analysis of variance; IQR: interquartile range; MLA: minimum lumen area | |||||
Table 3. Angiographic and procedural characteristics.
| Total population (N=116) | Fibrocalcific plaque (N=58) | Fibrous plaque (N=8) | Lipid-rich plaque (N=50) | p-value | |
|---|---|---|---|---|---|
| Angiographic characteristics | |||||
| “True” bifurcation (Medina 1,1,1/1,0,1/0,1,1) |
31/116 (26.7) | 19/58 (32.8) | 0/8 (0) | 12/50 (24.0) | 0.123 |
| Left main bifurcations | 37/116 (31.9) | 18/58 (31.0) | 1/8 (12.5) | 18/50 (36.0) | 0.408 |
| LAD/diagonal 1 | 67/116 (57.8) | 34/58 (58.6) | 6/8 (75.0) | 27/50 (54.0) | 0.527 |
| LAD/diagonal 2 | 12/116 (10.3) | 6/58 (10.3) | 1/8 (12.5) | 5/50 (10.0) | 0.977 |
| Bifurcation PCI strategy | |||||
| Crossover MV only | 77/116 (66.4) | 38/58 (65.5) | 6/8 (75.0) | 33/50 (66.0) | 0.865 |
| Proximal MV only | 5/116 (4.3) | 4/58 (6.9) | 0/8 (0.0) | 1/50 (2.0) | 0.378 |
| Distal MV only | 28/116 (24.1) | 12/58 (20.7) | 2/8 (25.0) | 14/50 (28.0) | 0.675 |
| DK crush | 3/116 (2.6) | 2/58 (3.4) | 0/8 (0) | 1/50 (2.0) | 0.798 |
| T/TAP | 3/116 (2.6) | 2/58 (3.4) | 0/8 (0) | 1/50 (2.0) | 0.798 |
| Final kissing inflation | 5/116 (4.3) | 3/58 (5.2) | 0/8 (0) | 2/50 (4.0) | 0.788 |
| Post-dilatation & POT | |||||
| POT balloon diameter, mm | 3.75 (3.50-4.00) | 3.50 (3.50-4.00) | 3.88 (3.50-4.00) | 4.00 (3.50-4.13) | 0.129 |
| Post-dilatation/POT overexpansion, % | 117 (113-133) | 117 (113-128) | 125 (104-143) | 128 (114-133) | 0.463 |
| Stent platform | |||||
| Baseline stent diameter, mm | 3.00 (2.75-3.50) | 3.00 (2.75-3.50) | 3.00 (2.75-3.50) | 3.00 (2.94-3.50) | 0.734 |
| Baseline stent length, mm | 28.0 (23.0-38.0) | 32.0 (23.0-38.0) | 29.0 (20.8-32.8) | 28.0 (21.5-38.0) | 0.457 |
| CoCr-EES | 78/116 (67.2) | 39/58 (67.2) | 4/8 (50.0) | 35/50 (70.0) | 0.535 |
| Promus PtCr-EES1 | 7/116 (6.0) | 2/58 (3.4) | 1/8 (12.5) | 4/50 (8.0) | 0.446 |
| CoNi-ZES | 4/116 (3.4) | 2/58 (3.4) | 0/8 (0) | 2/50 (4.0) | 0.847 |
| SYNERGY PtCr-EES1 | 25/116 (21.6) | 14/58 (24.1) | 2/8 (25.0) | 9/50 (18.0) | 0.719 |
| CoCr-SES | 2/116 (1.7) | 1/58 (1.7) | 1/8 (12.5) | 0/50 (0) | 0.042 |
| Values are median (IQR), or n/N (%). P-value in bold indicates statistical significance. Proportions were compared using chi-square tests. Medians were compared using the Kruskal-Wallis one-way ANOVA. 1Boston Scientific. ANOVA: analysis of variance; CoCr-EES: cobalt-chromium everolimus-eluting stent; CoCr-SES: cobalt-chromium sirolimus-eluting stent; CoNi-ZES: cobalt-nickel zotarolimus-eluting stent; DK: double kissing; LAD: left anterior descending artery; MV: main vessel; PCI: percutaneous coronary intervention; POT: proximal optimisation technique; PtCr-EES: platinum-chromium everolimus-eluting stent; T/TAP: T/T and small protrusion | |||||
OUTCOMES
Post-PCI OCT demonstrated a median relative stent elongation of 4.4% (IQR 1.0-8.9) and absolute elongation of 1.3 mm (IQR 0.3-2.2) from the nominal baseline length (Figure 2). There was a significant increase in stent length following implantation and post-dilatation, from a nominal baseline length of 28.0 mm (IQR 23.0-38.0) to 31.1 mm (IQR 23.9-38.2; p<0.001).
Post-PCI stent elongation differed significantly according to the underlying lesion morphology (p=0.006). Relative stent elongation in fibrocalcific lesions was 3.1% (IQR 0.5-6.3). Lipid-rich lesions facilitated the greatest change in relative stent length, with an increase of 6.4% (IQR 3.1-11.1) – this was significantly greater than the elongation observed in fibrocalcific lesions (p=0.006) but not in fibrous lesions (p=0.354) (Table 4).
Across all lesions, the median post-PCI MSA was 5.27 mm2 (IQR 4.9-7.6), and relative stent expansion was 69.6% (IQR 60.6-79.8). Expansion in the distal stent segment was 91.5% (IQR 84.1-99.1) and 80.0% (IQR 68.0-90.6) in the proximal stent segment. The median stent expansion index was 0.77 (IQR 0.71-0.85). When assessed according to the underlying lesion morphology, indices of stent expansion did not significantly differ (Table 4).
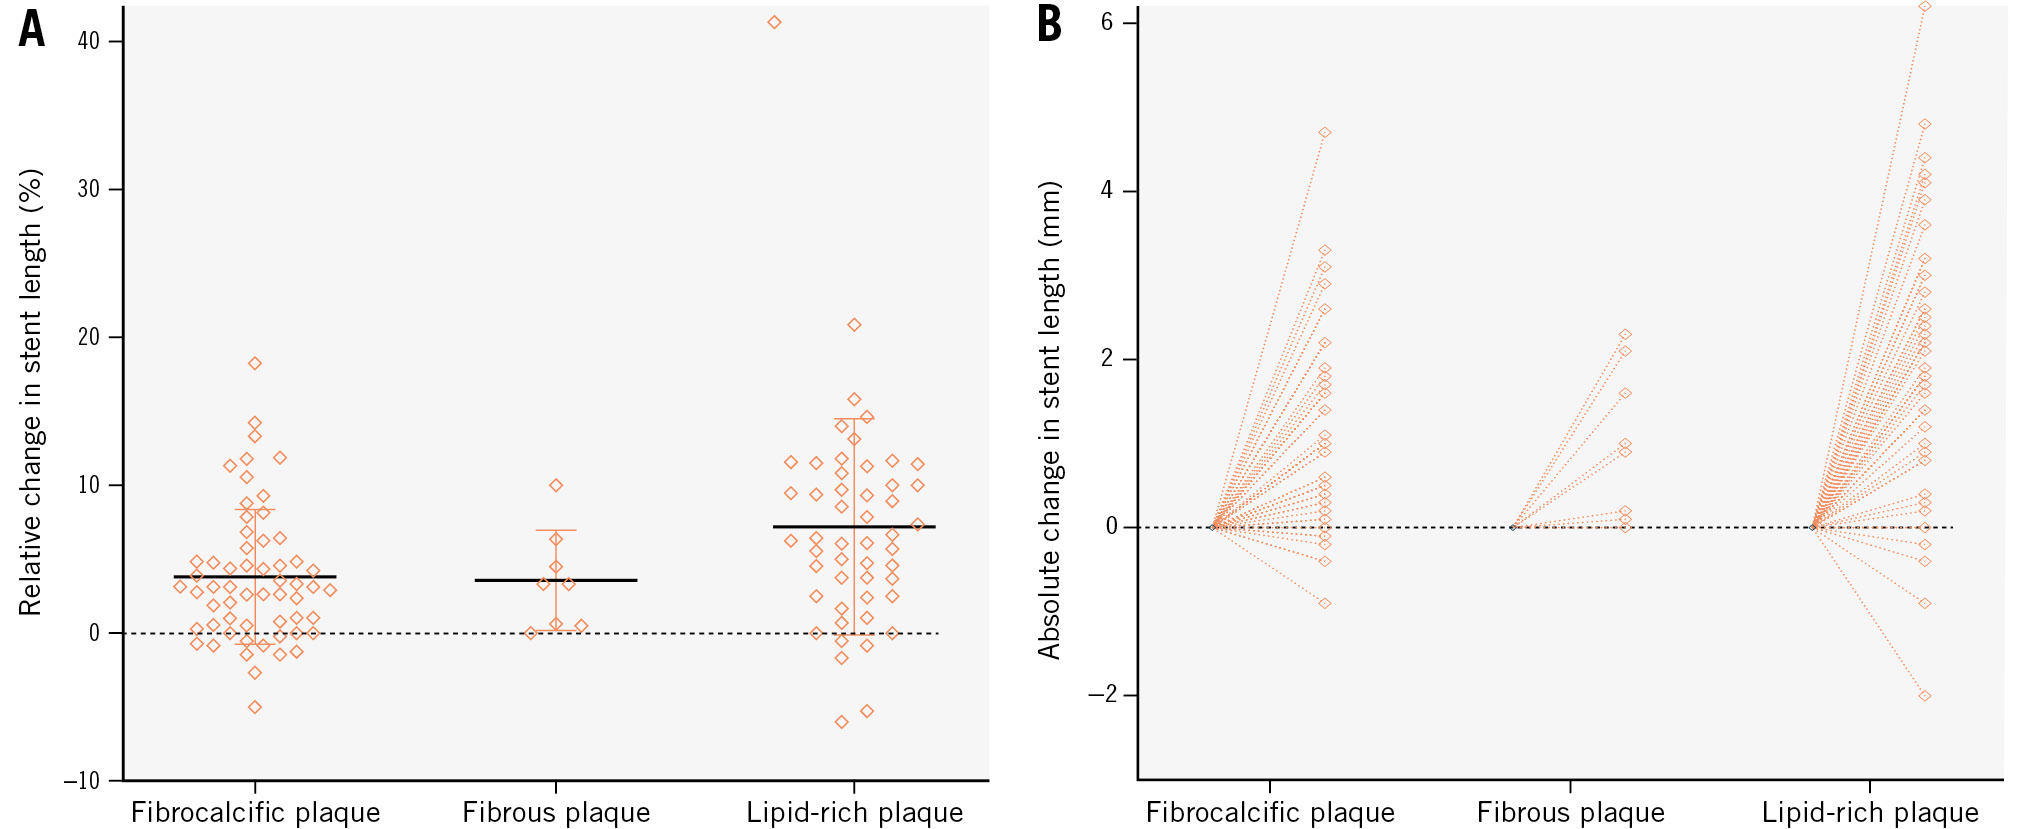
Figure 2. Change in stent length post-PCI categorised according to underlying plaque morphology. A) shows the relative (%) change in stent length; (B) shows the absolute change in stent length (mm). PCI: percutaneous coronary intervention
Table 4. Primary and secondary outcome measures.
| Total population (N=116) | Fibrocalcific plaque (N=58) | Fibrous plaque (N=8) | Lipid-rich plaque (N=50) | p-value | |
|---|---|---|---|---|---|
| Change in stent length from nominal, % | 4.4 (1.0-8.9) | 3.1 (0.5-6.3) | 3.3 (0.5-5.9) | 6.4 (3.1-11.1) | 0.006 |
| Fibrocalcific vs fibrous | 1.000a | ||||
| Fibrocalcific vs lipid-rich | 0.006a | ||||
| Fibrous vs lipid-rich | 0.354a | ||||
| Absolute change in stent length, mm | 1.3 (0.3-2.2) | 1.0 (0.2-1.8) | 1.0 (0.1-2.0) | 1.8 (0.9-2.7) | 0.011 |
| Fibrocalcific vs fibrous | 1.000a | ||||
| Fibrocalcific vs lipid-rich | 0.010a | ||||
| Fibrous vs lipid-rich | 0.434a | ||||
| Stent expansion indices | |||||
| Minimum stent area, mm2 | 5.27 (4.9-7.6) | 5.5 (4.5-7.7) | 5.2 (4.3-6.7) | 6.2 (4.9-7.6) | 0.403 |
| Relative stent expansion, % | 69.6 (60.6-79.8) | 70.1 (62.5-83.5) | 73.2 (49.1-80.2) | 69.4 (59.8-78.9) | 0.316 |
| “Acceptable” stent expansion (≥80% relative expansion) |
28/115 (24.3) | 15/58 (25.9) | 2/8 (25.0) | 11/49 (22.4) | 0.919 |
| Proximal stent expansion, % | 80.0 (68.0-90.6) | 81.3 (66.0-91.7) | 79.0 (62.2-96.3) | 79.9 (69.4-90.0) | 0.985 |
| Distal stent expansion, % | 91.5 (84.1-99.1) | 90.9 (85.6-98.7) | 93.7 (84.7-97.9) | 91.8 (80.7-99.1) | 0.827 |
| Stent expansion index | 0.77 (0.71-0.85) | 0.77 (0.71-0.85) | 0.80 (0.70-0.83) | 0.78 (0.72-0.85) | 0.912 |
| Values are median (IQR), or n/N (%). Non-normally distributed variables are presented as median (IQR), and were compared using the Kruskal-Wallis one-way ANOVA. P-values in bold indicate statistical significance. aPaired comparisons with adjusted p-value using the Bonferroni correction. ANOVA: analysis of variance; IQR: interquartile range | |||||
REGRESSION ANALYSIS
Table 5 contains key lesion and procedural variables that were selected for logistic regression analysis to identify characteristics that predict a greater than median stent elongation. The MSA achieved in the proximal segment and the category of lesion morphology were significantly associated with a greater than median relative stent elongation from univariable analysis. When incorporated into a multivariable model, the category of plaque morphology, specifically the presence of a lipid-rich plaque, remained significantly predictive of a greater than median percentage stent elongation, with an OR of 3.689 (95% CI: 1.604-8.484) relative to fibrocalcific plaque (p=0.002). The MSA achieved in the proximal segment ceased to be significantly predictive of longitudinal stent behaviour, suggesting that any effect was, at least in part, mediated by the associated plaque morphology.
Table 5. Regression analysis to identify predictors of a greater than median increase in stent length from the nominal baseline length.
| Univariable odds ratio (95% CI) |
p-value | Multivariable odds ratio (95% CI) | p-value | |
|---|---|---|---|---|
| Lesion characteristics | ||||
| Left main bifurcation | 0.774 (0.360-1.723) | 0.526 | ||
| Any major bifurcation (SB diameter ≥2.75 mm) | 1.129 (0.533-2.391) | 0.751 | ||
| Minimum lumen area, mm2 | 0.931 (0.620-1.400) | 0.733 | ||
| Plaque morphology category (vs fibrocalcific) | 0.002 | 0.007 | ||
| Fibrous plaque | 0.741 (0.136-4.031) | 0.728 | 1.121 (0.238-5.269) | 0.885 |
| Lipid-rich plaque | 3.951 (1.772-8.808) | <0.001 | 3.689 (1.604-8.484) | 0.002 |
| Procedural characteristics | ||||
| Final kissing balloon inflation | 5.250 (0.568-48.496) | 0.144 | ||
| Post-dilatation/POT balloon overexpansion, % | 1.017 (0.989-1.046) | 0.230 | ||
| Achieved MSA | 1.074 (0.917-1.258) | 0.378 | ||
| Proximal segment only | 1.197 (1.021-1.402) | 0.026 | 1.168 (0.989-1.379) | 0.068 |
| Distal segment only | 1.067 (0.923-1.234) | 0.378 | ||
| Achieved relative stent expansion | 0.992 (0.975-1.008) | 0.328 | ||
| Proximal segment only | 1.002 (0.980-1.025) | 0.833 | ||
| Distal segment only | 0.988 (0.959-1.018) | 0.445 | ||
| Achieved SEI | 1.007 (0.973-1.042) | 0.698 | ||
| Proximal segment only | 1.009 (0.981-1.038) | 0.521 | ||
| Distal segment only | 1.001 (0.966-1.036) | 0.965 | ||
| P-values in bold indicate statistical significance. CI: confidence interval; MSA: minimum stent area; POT: proximal optimisation technique; SB: side branch; SEI: stent expansion index | ||||
Discussion
In this study, we present the largest analysis of in vivo longitudinal stent behaviour, as assessed by intracoronary OCT, and the first study to assess the impact of morphological characteristics of coronary plaque on DES elongation following implantation and optimisation during PCI to bifurcation lesions. We show that, following PCI, the relative stent length increased by 4.4% (IQR 1.0-8.9) across all lesions, with an absolute increase of 1.3 mm (IQR 0.3-2.2). Our study indicates that plaque morphology may be an important mediator of the degree of stent elongation, which is a novel finding and of significant clinical importance.
DES are increasingly used in the treatment of advanced and complex patterns of coronary artery disease, characterised by multivessel interventions, longer lesion length and more challenging lesion morphologies, such as fibrotic plaque or heavy calcification22. To mitigate these challenges, stent platforms have evolved to provide high radial mechanical strength and reliable deliverability. However, the impact of these changes on the longitudinal biomechanical properties of contemporary stent platforms is less clear, with reduced longitudinal strength raising the risk of deformation and post-expansion elongation, both of which have significant potential procedural implications.
Early observations with contemporary DES suggested that improved deliverability may have come at the expense of longitudinal strength, with reports of stent compression and significant shortening both in silico and in vivo2324. However, in 210 successive patients treated with 233 second-generation DES, a relative stent elongation of 5.24% (IQR 2.55-8.29) from baseline was reported, as assessed by intravascular ultrasound (IVUS). This equated to a median absolute increase in stent length of 0.90 mm (IQR 0.48-1.39), which was deemed not to be clinically important25.
In the treatment of bifurcation lesions, proximal optimisation involves the overexpansion of the stent in the main branch proximal to the carina, in order to ensure adequate expansion and apposition26. Recent observations, both in silico and in vivo in 36 patients assessed with intracoronary OCT, demonstrated significant stent elongation following POT89. Toth et al demonstrated a mean absolute stent elongation of 2.22±1.35 mm, and a relative elongation of 9.53±7.24%. In vivo there was no relationship between the tertile of overexpansion and the degree of elongation9.
In our study, we observed significant stent elongation following optimisation of PCI in vivo, with the degree of absolute and relative stent elongation in keeping with previous reports925. Improved performance of second- and third-generation DES in complex patterns of disease have resulted in contemporary trends for implanting longer lengths of stents. With a 48 mm long stent platform, a relative elongation of 6.4% (as seen with lipid-rich plaque) would result in absolute stent elongation of up to 3.1 mm. In this era of “precision PCI”, an unanticipated stent elongation of this magnitude could potentially result in clinically meaningful and unacceptable consequences, including major underexpansion and malapposition of the stent inflow, unintended protrusion of the stent from the coronary ostia, or unexpected coverage of proximal side branch ostia (Central illustration).
The mechanisms behind stent elongation are unclear and may reflect the modifications in stent structure of contemporary platforms that prioritise deliverability over longitudinal strength, including thinner struts, and fewer connectors between struts523. Previous studies proposed that stent elongation is most pronounced when an arc of malapposed stent struts exceeds 180° and the shoulders of the post-dilatation balloon abut the carina during POT. As the balloon expands, it is proposed that the shoulders of the balloon expand into the distal vessel segment ostium, and the balloon is consequently forced backwards, placing a longitudinal traction on malapposed stent struts. In silico, this may cause elongation of between 5-10%79.
An important novel finding in our cohort is that the degree of stent elongation is, at least in part, mediated by the underlying plaque morphology. Our observations demonstrate that lipid-rich plaque facilitates stent elongation of 6.4% (IQR 3.1-11.1). In fibrocalcific disease, however, the inherent vascular rigidity that is known to attenuate radial stent expansion may also apply a longitudinal traction that resists stent elongation.
In this study, we report various measures of absolute and relative stent expansion. Despite compelling in silico data relating DES overexpansion to elongation, these candidate variables were not predictive of elongation in our “real-world” cohort. These findings are in agreement with the in vivo findings of Toth et al and suggest that plaque morphology, determined by OCT, may be of greater importance in predicting elongation in vivo9.
This study has several potentially important clinical implications. This study appears to confirm a tendency of contemporary DES to elongate during post-dilatation, a finding with relevance across the field of PCI. When treating ostial lesions, the precise placement of stent struts is essential, and an appreciation of underlying plaque morphology may be necessary to ensure optimal stent coverage and avoid protrusion of the stent from the coronary ostia. Of equal importance are bifurcation lesions or lesions in the midportion of the vessel where, even with judicious stent placement, backwards elongation may result in struts unintentionally covering a side branch ostium, obstructing future access and acting as a potential nidus for thrombus formation10. An appreciation of plaque morphology, assessed with intracoronary imaging, may now be viewed as a key step during PCI planning to anticipate in vivo stent behaviour and inform stent sizing and selection.
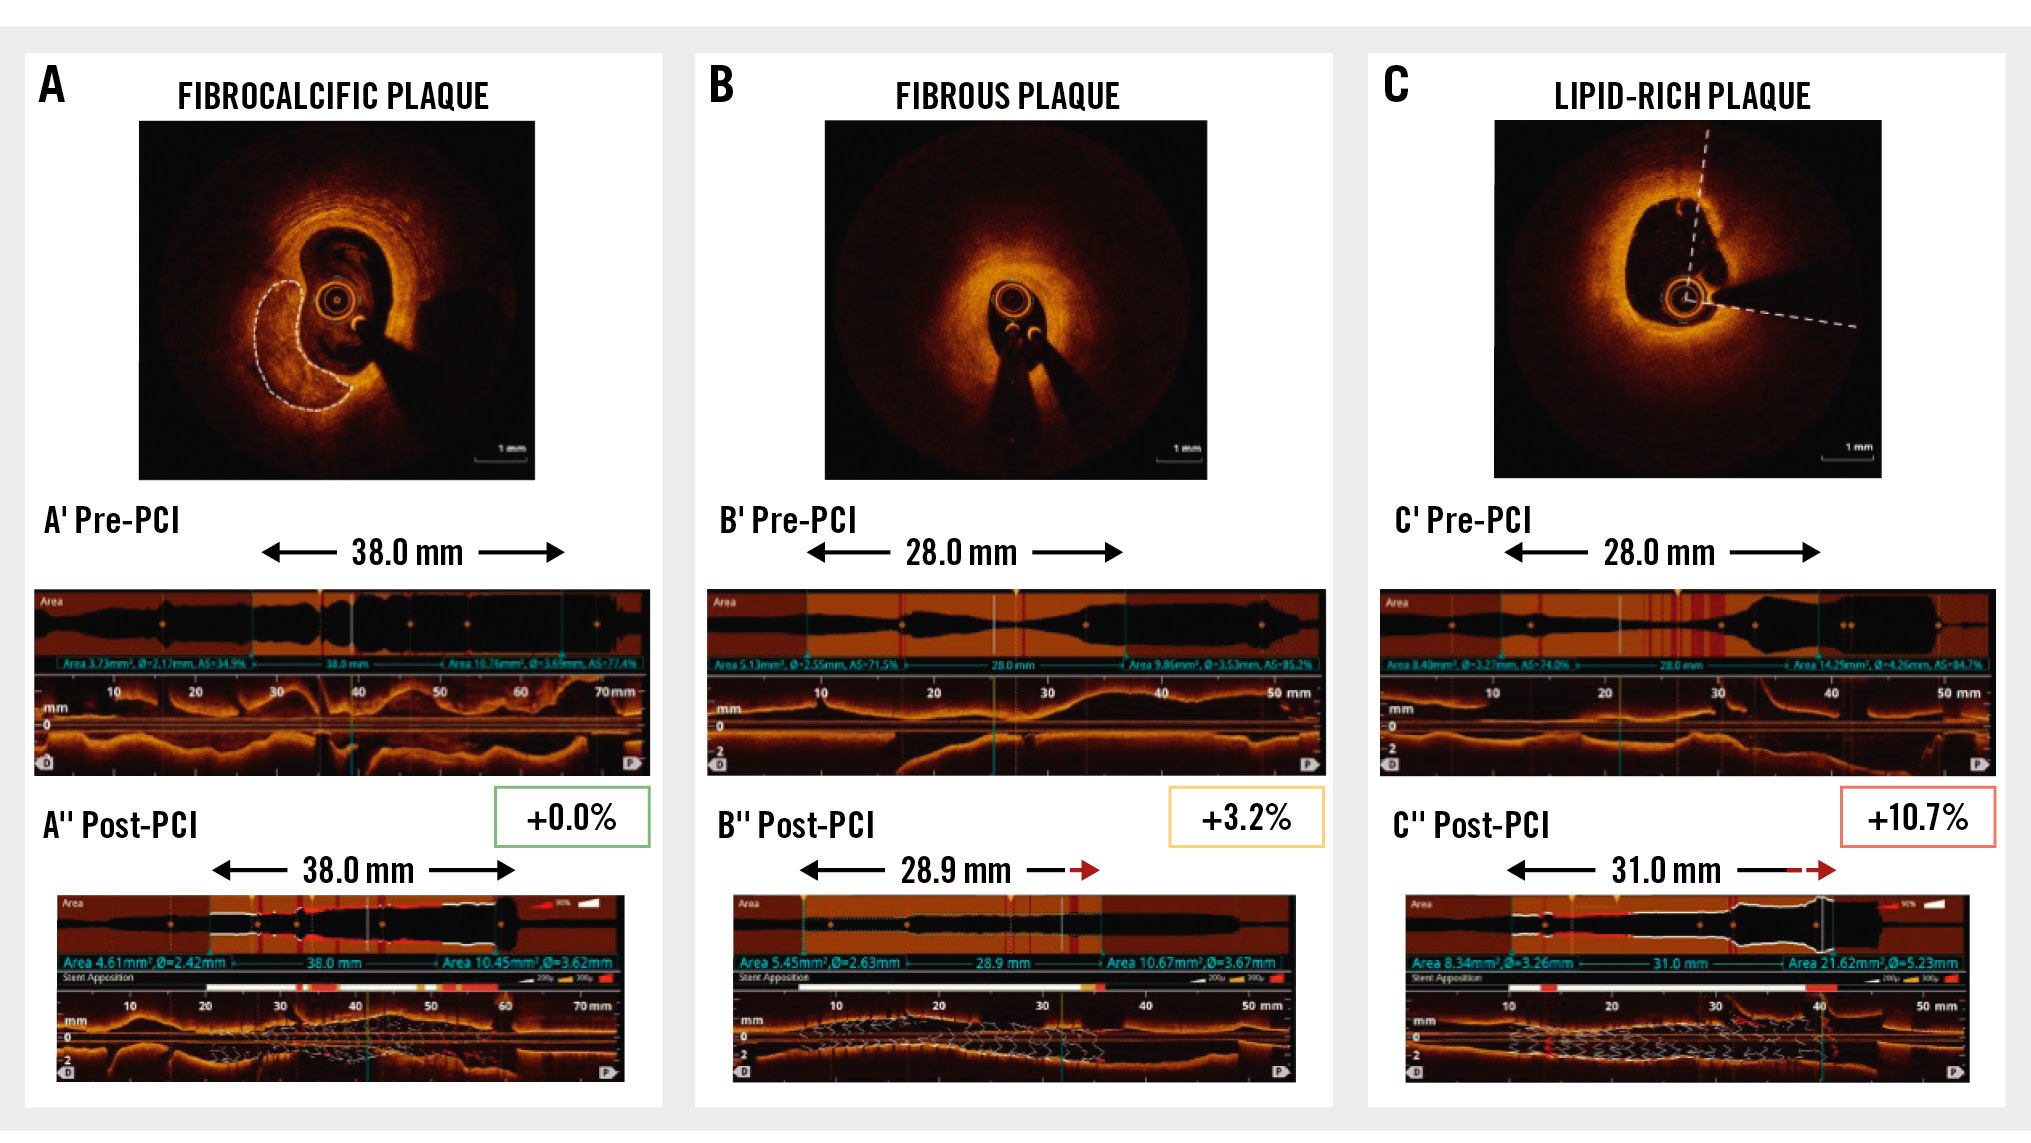
Central illustration. Drug-eluting stents elongate during implantation – the magnitude of elongation is determined by the underlying plaque morphology. Representative examples are shown for each plaque morphology: (A) fibrocalcific plaque, (B) fibrous plaque, and (C) lipid-rich plaque at baseline, with the pre-PCI identification of landing zones and required stent length (A’, B’, C’), and final stent length following implantation and post-dilatation (A’’, B’’, C’’). Stent elongation by 3 mm in a lipid-rich plaque in the proximal LAD (C’’). Following post-dilatation, malapposed proximal struts lie across the ostium of the left circumflex. LAD: left anterior descending artery; PCI: percutaneous coronary intervention
Limitations
This is a single-centre, retrospective study using intracoronary OCT to assess post-PCI stent length in vivo. While this enabled the collection of a rich dataset and a standardised protocol for OCT image analysis, it does introduce the possibility of bias.
We performed a qualitative analysis of lesion morphology, based on the predominant morphological characteristics at the site of minimum lumen area. Such an approach facilitates categorisation and comparison that can be practically applied in the catheterisation laboratory. OCT analysis demonstrated appropriate and significant differences in maximum lipid arc, lipid length, and calcium volume across groups. When validated by an independent OCT expert, our classification method proved reproducible with substantial agreement (Cohen’s κ statistic of 0.71).
Despite this, we recognise that such an approach does not fully represent the heterogeneity of coronary atherosclerotic plaque. An analysis integrating a fully quantitative assessment of plaque composition may add further insight.
The choice of DES and interventional device was at the discretion of the treating clinician, with CoCr-EES used in over 60% of the cohort. CoCr-EES are amongst the most extensively validated of contemporary DES platforms, acting as the comparator arm in several randomised controlled trials27. We chose to limit the period of our study to between July 2017 and March 2022 in order to focus on second- and third-generation DES only, reflecting contemporary practice. This led to the exclusion of a number of patients, but, given the shared mechanical properties of second- and third-generation DES platforms, it is likely that our findings are generalisable45.
It is recognised that the use of IC imaging to guide PCI influences technique, resulting in the selection of longer stent lengths, and larger-diameter post-dilatation/POT balloons28. Stent overexpansion during post-dilatation/POT was not a predictor of stent elongation in our study, but in silico tests (which do not simulate the role of plaque morphology) suggest that elongation increases in proportion to balloon overexpansion9. It remains possible that the observed stent elongation in this study is an artefact associated with the use of IC imaging and the subsequent selection of larger post-dilatation and POT balloons.
Due to the retrospective nature of our study, we are unable to reliably report the type of balloon used during post-dilatation (i.e., non-compliant vs compliant), the pressure applied during balloon inflation, or the sequence or number of balloon inflations. This has particular importance given recent in silico observations that a “modified” POT, initially optimising the stent inflow, may attenuate elongation29.
Patients were included in the study cohort if there was a baseline OCT assessment (prior to stent implantation) and a further assessment following stent placement and post-dilatation. In a minority of cases, there was further stent post-dilatation and optimisation, but a final OCT was not recorded.
Future prospective studies should include protocolised OCT assessment at each stage of the PCI procedure, including baseline assessment of morphology, with an assessment immediately following stent implant at nominal pressure, and a final assessment after completion of post-dilatation and POT. Performance of an OCT assessment prior to post-dilatation would allow an assessment of whether elongation occurred during implantation or during post-dilatation – using fiducial landmarks to assess if the elongation is symmetrical across the stent length or asymmetrical, predominantly affecting portions undergoing greater relative overexpansion. Such prospective analysis would also facilitate the evaluation of the clinical significance of this phenomenon.
Finally, the use of IC imaging to assess changes in stent length in vivo may itself introduce error. Our technique for the measurement of stent length has not been validated with histology studies, which remain the “gold standard”. Artefacts due to cardiac motion, the cyclic change of bifurcation angles during systole/diastole30, or wire bias due to the natural curvature of coronary arteries are possible. This may result in artefactual lengthening (or shortening) of the apparent stent length, depending on the vessel geometry and reflection of the near-infrared light signal. We attempted to minimise any potential impact of this by selecting only interventions in the left main and left anterior descending arteries, which usually have less tortuosity or curvature. Whilst we believe this allowed us to focus on the longitudinal behaviour of the stent and the impact of POT, future studies should assess whether our observations are conserved across all bifurcation and non-bifurcation lesions.
Conclusions
Contemporary drug-eluting stents elongate during implantation and post-dilatation, an effect which is mediated by plaque morphology. This is an important consideration when assessing plaque morphology, planning strategy, selecting interventional devices and assessing results immediately following DES optimisation.
Impact on daily practice
Iterative developments in drug-eluting stent (DES) technology have produced devices that are highly deliverable, with excellent radial strength and expansion capacities. This has come at the expense of longitudinal strength. We demonstrate that contemporary DES can elongate by up to 11.1% in lipid-rich plaque. This may result in ostial stent protrusion, accidental “jailing” of clinically important side branch ostia, stent underexpansion and major malapposition. Clinicians must consider these intrinsic features of contemporary DES platforms and their interaction with plaque morphology to ensure precise and durable results for patients treated by percutaneous coronary intervention. Device technology must evolve to improve the predictability of longitudinal performance.
Funding
This work was part-funded by King’s College Hospital R&D Grant and was supported by the Department of Health via a National Institute for Health Research Biomedical Research Centre award to Guy’s & St Thomas’ NHS Foundation Trust in partnership with King’s College London and King’s College Hospital NHS Foundation Trust.
Conflict of interest statement
J.M. Hill has received honoraria, speaker fees and research grant support from Abbott, Abiomed, Boston Scientific, and Shockwave Medical; and has held equity in Shockwave Medical. T.W. Johnson has received personal fees from Abbott, Boston Scientific, Medtronic, and Terumo. N. Pareek has received speaker fees from Abbott. A.M. Shah is supported by the British Heart Foundation. The other authors have no conflicts of interest to declare.