Cory:
Unlock Your AI Assistant Now!
Abstract
Background: Pericoronary adipose tissue (PCAT) attenuation, measured using coronary computed tomography angiography (cCTA), is a potential marker of coronary inflammation.
Aims: We aimed to examine the association between coronary inflammation, as assessed by measuring PCAT attenuation before percutaneous coronary intervention (PCI), and clinical outcomes of PCI using current-generation drug-eluting stents (DES).
Methods: We retrospectively studied consecutive patients who underwent cCTA before PCI with current-generation DES. Adverse plaque characteristics, calcified plaque (CP) burden, and PCAT attenuation of the proximal right coronary artery (PCATRCA) were assessed using cCTA. The primary outcome was a patient-oriented composite endpoint (PoCE), including cardiovascular death, non-fatal myocardial infarction, any revascularisation, and stroke.
Results: During a median follow-up of 1,540 days, 77 of 490 patients experienced PoCE. Patients with PoCE had higher PCATRCA (−76.3±6.4 Hounsfield units [HU] vs −82.5±8.1 HU; p<0.001). Multivariable analysis showed that the presence of adverse plaque, greater CP burden and higher PCATRCA were independently associated with PoCE (hazard ratio [HR] 2.05, 95% confidence interval [CI]: 1.26-3.34; p=0.004; HR 1.04, 95% CI: 1.02-1.07; p=0.002; and HR 2.20, 95% CI: 1.63-2.97; p<0.001, respectively). PoCE incidence was 3.9 times higher in patients with high PCATRCA (≥−79.9 HU) than those with low PCATRCA (<−79.9 HU). Adding PCATRCA to traditional cardiovascular risk factors and cCTA findings (adverse plaque and CP burdens) improved the predictive and reclassification abilities for PoCE.
Conclusions: High PCATRCA was independently associated with PoCE after PCI using current-generation DES. Combining PCATRCA with traditional cardiovascular risk factors and cCTA findings may enhance risk assessment for PoCE after PCI.
Current-generation drug-eluting stents (DES) have dramatically reduced target lesion revascularisation (TLR) and stent thrombosis in patients with coronary artery disease (CAD). Despite notable advancements in medical management and device technology, patients undergoing percutaneous coronary intervention (PCI) remain at subsequent cardiovascular risk12. Although aggressive management of conventional cardiovascular risk factors is effective, it only addresses part of the overall cardiovascular risk, and residual risk persists even with optimal medical therapy.
Recent studies have highlighted the role of coronary inflammation in atherosclerotic progression and vulnerable plaque rupture, leading to subsequent cardiovascular events in patients with CAD3. Clinical trials, such as the Canakinumab Anti-inflammatory Thrombosis Outcomes Study (CANTOS) and the Low Dose Colchicine 2 trial, have further substantiated that reducing systemic inflammation through anti-inflammatory medications significantly decreases recurrent cardiovascular events456. This underscores the relevance of evaluating coronary artery inflammation as a residual risk factor, providing an opportunity to enhance cardiovascular risk stratification in patients with CAD.
Recent advances in coronary computed tomography angiography (cCTA) have enabled the non-invasive quantification of coronary inflammation by analysing changes in pericoronary adipose tissue (PCAT) attenuation7. PCAT attenuation is a novel marker of coronary inflammation on cCTA, capturing changes in adipocyte size and lipid accumulation caused by inflammatory mediators from the vascular wall. Previous reports have demonstrated an association between increased PCAT attenuation and future adverse events in patients with CAD89. However, the prognostic impact of coronary inflammation, assessed using PCAT attenuation, in patients undergoing PCI with current-generation DES remains unexplored. This study aimed to investigate the relationship between pre-PCI PCAT attenuation and clinical outcomes after PCI with current-generation DES.
Methods
Study design
In this retrospective, multicentre, observational cohort study, we enrolled consecutive patients at four institutions between January 2016 and December 2020; an external cohort of additional patients was enrolled between January 2021 and December 2021. The inclusion criteria were (1) patients who had undergone PCI using current-generation DES for de novo native coronary stenotic lesions, (2) patients who had undergone cCTA within the 120 days preceding PCI, and (3) patients who were aged ≥20 years. The exclusion criteria were (1) patients diagnosed as having ST-segment elevation myocardial infarction, (2) patients with coronary artery bypass grafted lesions, (3) patients with chronic total occlusion, (4) patients with left main coronary artery lesions, (5) patients undergoing intervention of more than one native coronary vessel during a single PCI procedure, and (6) patients with insufficient computed tomography (CT) data quality. The study protocol complied with the Declaration of Helsinki and was approved by the ethics committee of Kobe University Hospital. Informed consent was obtained as an opt-out form on the website of the Division of Cardiovascular Medicine at Kobe University Graduate School of Medicine. The study was registered in the University Hospital Medical Information Network Clinical Trial Registry (UMIN000051353).
cCTA image acquisition and analysis of plaque characteristics
cCTA images were obtained in accordance with the Society of Cardiovascular Computed Tomography guidelines10. Acquisition details are described in Supplementary Appendix 1. Reconstructed images were transferred to a processing workstation (SYNAPSE VINCENT [FUJIFILM Corporation]) and analysed by two independent investigators who were blinded to the patients’ clinical characteristics, except for information regarding the PCI target lesion. The centreline and vessel contours were automatically detected and manually corrected, if necessary.
The lesions that underwent PCI were deemed target lesions. In cases with multiple lesions, the target lesion was defined as the most severe stenotic lesion. Non-target lesions were defined as the other (non-PCI) lesions with percentage diameter stenosis (%DS) >30% on cCTA. The reference and minimal lumen diameters, lesion length, minimal lumen area, and %DS were measured using axial and multiplanar reconstruction images.
Plaque burdens were measured for the following subtypes in the entire coronary artery, target lesions, and non-target lesions: total plaque, low-attenuation plaque (LAP), non-calcified plaque (NCP), and calcified plaque (CP)11 When there were multiple non-target lesions, the average value was used for analysis.
Adverse plaque characteristics (APCs), such as positive remodelling, low-attenuation plaque, spotty calcification, and the napkin-ring sign, were assessed for PCI target and non-target lesions12. In cases with multiple lesions, the lesions with the highest number of APCs, including both target and non-target lesions, were used for patient-level analysis. The number of APCs per lesion was calculated, and adverse plaques were defined as those with two or more APCs. Details of cCTA image analysis are described in Supplementary Appendix 1.
PCAT analysis
PCAT attenuation was measured using dedicated cCTA analysis software (SYNAPSE VINCENT). Within the predefined volume of interest, voxels with tissue attenuation ranging from –190 Hounsfield units (HU) to –30 HU were considered adipose tissues, and PCAT attenuation was defined as the mean attenuation within such contamination-free volumes of interest. These measurements were performed for each patient around the proximal right coronary artery (RCA; PCATRCA), proximal target vessels (PCATVessel), and the specific target lesions (PCATLesion) (Figure 1). PCAT attenuation measurements at the patient level are represented by PCATRCA 89. PCAT analysis details are described in Supplementary Appendix 1.
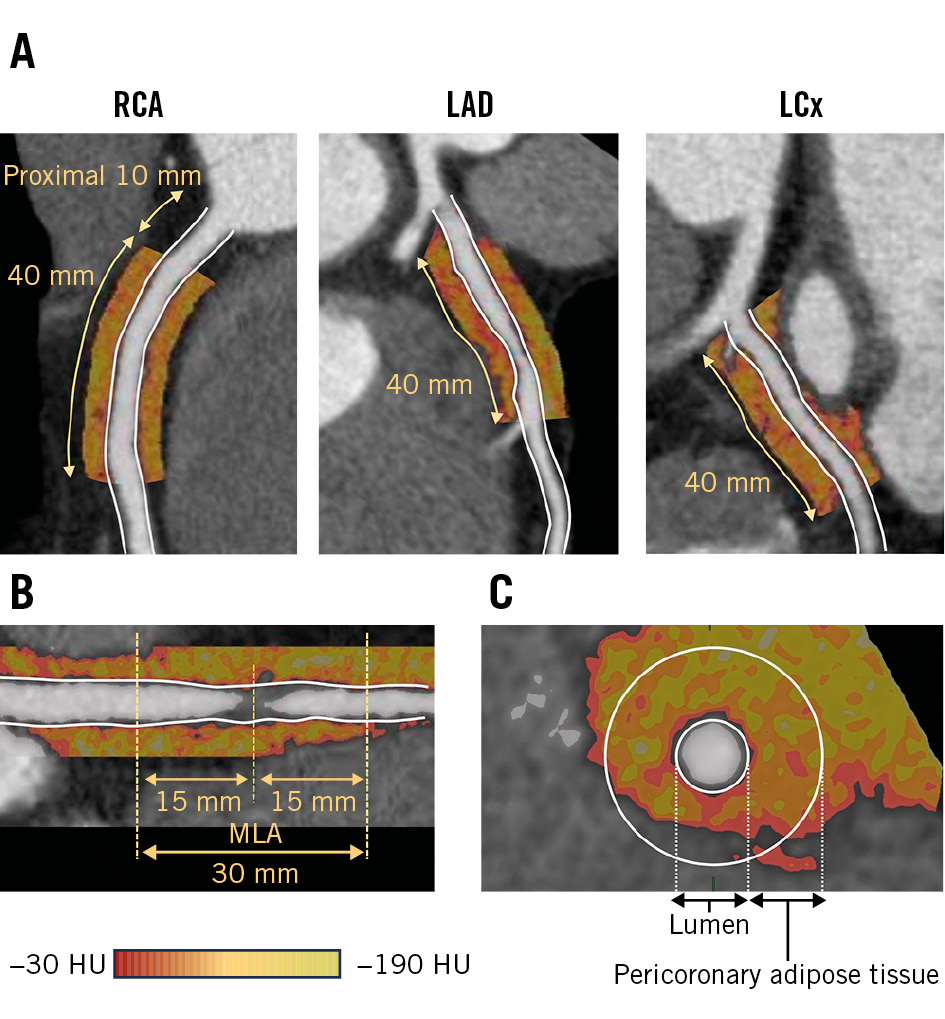
Figure 1. PCAT analysis. Pericoronary adipose tissue (PCAT) attenuation measurements are performed at (A) the proximal target vessels (PCATVessel) and (B) the target lesions (PCATLesion). C) PCAT is defined as the adipose tissue within a radial distance equal to the vessel diameter. HU: Hounsfield unit; LAD: left anterior descending artery; LCx: left circumflex artery; MLA: minimal lumen area; RCA: right coronary artery
Outcomes
The primary outcome of the study was a patient-oriented composite endpoint (PoCE), defined as a composite of cardiovascular death, non-fatal myocardial infarction (MI), any revascularisation, and stroke. Based on the Academic Research Consortium (ARC)-2 definition13, we investigated other clinical outcomes such as major adverse cardiovascular events (MACE), target vessel failure (TVF), target lesion failure (TLF), all-cause death, cardiovascular death, any MI, non-fatal MI, any revascularisation, target vessel revascularisation (TVR), TLR, heart failure hospitalisation, and periprocedural myocardial infarction (PMI). Clinical outcomes were ascertained using hospital records and follow-up data from outpatient visits. Further details of the outcomes and statistical analyses are provided in Supplementary Appendix 1.
External cohort
We determined the optimal cutoff value of PCATRCA for predicting PoCE after PCI using receiver operating characteristic (ROC) curve analysis. To externally validate this cutoff value, an external cohort of patients from the same institution was identified. These patients met the same inclusion and exclusion criteria as the current study. External cohort details are described in Supplementary Appendix 1.
Results
Study population
In total, 702 patients underwent cCTA before PCI using current-generation DES for de novo native lesions during the study period. After applying various exclusion criteria, 490 patients were included in the analysis. During a median follow-up of 1,540 (interquartile range: 1,070-1,990) days, 77 (15.7%) experienced PoCE (PoCE group) (Supplementary Figure 1). Ten patients experienced cardiovascular death, 8 experienced non-fatal MI, 52 underwent any type of revascularisation, and 16 experienced strokes.
Comparison of baseline characteristics between the PoCE and non-PoCE groups
Table 1 shows baseline patient, lesion, and procedural characteristics. The PoCE group had significantly higher frequencies of haemodialysis and multivessel disease, lower left ventricular ejection fraction, higher brain natriuretic peptide values, and less frequent statin use at discharge than the non-PoCE group. High sensitivity C-reactive protein (hs-CRP) was comparable between the groups.
Table 2 and Supplementary Table 1 summarise the pre-PCI cCTA findings. In the patient-level analysis, total plaque, LAP, NCP, and CP burdens were significantly higher and napkin-ring signs and adverse plaques were significantly more prevalent in the PoCE group than in the non-PoCE group. In the target lesion-level analysis, CP burden tended to be higher in the PoCE group. In the non-target lesion-level analysis, total plaque, LAP, NCP, and CP burdens were significantly higher and spotty calcification, napkin-ring signs and adverse plaques were significantly more prevalent in the PoCE group. Additionally, PCAT parameters, including PCATRCA, PCATVessel, and PCATLesion, were significantly higher in the PoCE group than those in the non-PoCE group (all p<0.001). Inter- and intraobserver intraclass correlation coefficient values for PCAT attenuation were excellent (0.982 and 0.972, respectively). In a sensitivity analysis of 363 stable patients with CAD, PCATRCA, PCATVessel, and PCATLesion were also significantly higher in the PoCE group (all p<0.001) (Supplementary Table 2).
Table 1. Baseline patient, lesion, and procedural characteristics.
| Variables | All patients (n=490) | PoCE (n=77) | Non-PoCE (n=413) | p-value |
|---|---|---|---|---|
| Baseline patient characteristics | ||||
| Age, years | 69.6±9.9 | 70.7±9.6 | 69.5±9.9 | 0.314 |
| Male sex | 368 (75.1) | 63 (81.8) | 305 (73.8) | 0.153 |
| Hypertension | 363 (74.1) | 53 (68.8) | 310 (75.1) | 0.259 |
| Dyslipidaemia | 360 (73.5) | 51 (66.2) | 309 (74.8) | 0.123 |
| Diabetes mellitus | 221 (45.1) | 40 (51.9) | 181 (43.8) | 0.213 |
| Smoker | 299 (61.0) | 51 (66.2) | 248 (60.0) | 0.373 |
| Chronic kidney disease | 151 (30.8) | 28 (36.4) | 123 (29.8) | 0.282 |
| Haemodialysis | 12 (2.4) | 5 (6.5) | 7 (1.7) | 0.027 |
| Prior PCI | 83 (16.9) | 14 (18.2) | 69 (16.7) | 0.742 |
| Prior MI | 41 (8.4) | 6 (7.8) | 35 (8.5) | 0.999 |
| Acute coronary syndrome | 127 (25.9) | 17 (22.1) | 110 (26.6) | 0.479 |
| Laboratory data | ||||
| BNP, pg/mL | 32.4 (14.2, 83.2) | 65.0 (15.0, 128.9) | 30.6 (14.2, 65.80) | 0.005 |
| Estimated GFR, mL/min/1.73 m2 | 66.0 (57.0, 76.2) | 66.0 (55.2, 76.0) | 66.0 (57.3, 77.0) | 0.480 |
| Low-density lipoprotein cholesterol, mg/dL | 113.0 (92.3, 137.7) | 109.0 (86.4, 125.0) | 115.0 (94.0, 138.0) | 0.097 |
| HbA1c, % | 6.1 (5.8, 7.0) | 6.2 (5.8, 7.2) | 6.1 (5.8, 7.0) | 0.411 |
| WBC count, ×103/μL | 6.1 (5.1, 7.4) | 6.2 (5.1, 7.4) | 6.1 (5.1, 7.4) | 0.881 |
| hs-CRP, mg/L | 0.8 (0.4, 2.0) | 1.3 (0.4, 3.6) | 0.8 (0.4, 1.9) | 0.204 |
| LVEF, % | 60.0 (55.0, 64.9) | 58.5 (51.0, 63.0) | 61.0 (55.0, 65.0) | 0.007 |
| Medications at cCTA | ||||
| Statins | 259 (52.9) | 39 (50.6) | 220 (53.3) | 0.710 |
| Beta blockers | 110 (22.4) | 16 (20.8) | 94 (22.8) | 0.768 |
| RAS inhibitors | 220 (44.9) | 39 (50.6) | 181 (43.8) | 0.318 |
| Calcium channel blockers | 204 (41.6) | 31 (40.3) | 173 (41.9) | 0.803 |
| Oral anticoagulants | 33 (6.7) | 9 (11.7) | 24 (5.8) | 0.079 |
| Medications at discharge | ||||
| Statins | 439 (89.6) | 61 (79.2) | 378 (91.5) | 0.003 |
| Beta blockers | 193 (39.4) | 32 (41.6) | 161 (39.0) | 0.704 |
| RAS inhibitors | 283 (57.8) | 50 (64.9) | 233 (56.4) | 0.170 |
| Calcium channel blockers | 234 (47.8) | 35 (45.5) | 199 (48.2) | 0.710 |
| Oral anticoagulants | 36 (7.3) | 10 (13.0) | 26 (6.3) | 0.054 |
| Lesion characteristics | ||||
| Target vessel: LAD/LCx/RCA, % | 51.8/14.7/33.5 | 41.6/14.3/44.2 | 53.8/14.8/31.5 | 0.086 |
| Lesion location: proximal/mid/distal, % | 31.2/56.1/12.7 | 36.4/48.2/15.6 | 10.3/57.6/12.1 | 0.278 |
| Multivessel disease | 238 (48.6) | 47 (61.0) | 191 (46.2) | 0.018 |
| Patients undergoing FFR§ | 116 (32.0) | 17 (28.3) | 99 (32.7) | 0.548 |
| FFR value | 0.70±0.08 | 0.68±0.09 | 0.70±0.08 | 0.497 |
| Procedural characteristics | ||||
| Number of stents | 1.17±0.39 | 1.23±0.43 | 1.16±0.38 | 0.125 |
| Stent diameter, mm | 3.12±0.50 | 3.19±0.50 | 3.11±0.50 | 0.195 |
| Stent length, mm | 28.4±13.6 | 28.5±15.9 | 28.4±13.1 | 0.967 |
| Imaging device: IVUS/OCT | 486 (99.2) | 76 (98.7) | 410 (99.3) | 0.460 |
| IVUS | 319 (65.1) | 47 (61.0) | 272 (65.9) | 0.436 |
| OCT | 167 (34.1) | 29 (37.7) | 138 (44.1) | 0.430 |
| Atherectomy* | 50 (10.2) | 40 (9.7) | 10 (13.0) | 0.411 |
| Values are expressed as mean±standard deviation, median (25th, 75th percentiles) or n (%), unless otherwise stated. §The proportion of patients who underwent FFR was calculated based on the CCS patient population (n=368). *Atherectomy includes rotational atherectomy and orbital atherectomy. BNP: brain natriuretic peptide; CCS: chronic coronary syndrome; cCTA: coronary computed tomography angiography; FFR: fractional flow reserve; GFR: glomerular filtration rate; hs-CRP: high-sensitivity C-reactive protein; IVUS: intravascular ultrasound; LAD: left anterior descending artery; LCx: left circumflex artery; LVEF: left ventricular ejection fraction; MI: myocardial infarction; OCT: optical coherence tomography; PCI: percutaneous coronary intervention; PoCE: patient-oriented composite endpoint; RAS: renin-angiotensin system; RCA: right coronary artery; WBC: white blood cell | ||||
Table 2. cCTA findings at the patient level.
| Variables | All patients (n=490) | PoCE (n=77) | non-PoCE (n=413) | p-value |
|---|---|---|---|---|
| Quantitative cCTA analysis | ||||
| Total plaque burden, % | 40.3 (35.2, 44.9) | 44.8 (40.1, 48.9) | 39.4 (34.5, 43.8) | <0.001 |
| LAP burden, % | 6.66 (3.97, 8.61) | 6.98 (5.81, 9.06) | 6.47 (3.94, 8.44) | 0.013 |
| NCP burden, % | 36.8 (30.8, 42.0) | 40.8 (35.4, 45.4) | 36.1 (30.5, 41.4) | <0.001 |
| CP burden, % | 1.61 (0.38, 4.23) | 2.86 (0.96, 6.37) | 1.40 (0.34, 3.99) | <0.001 |
| Coronary artery calcium score, Agatston units (n=368) | 398 (119, 1,120) | 378 (112, 1,010) | 635 (243, 1,620) | 0.002 |
| ≥400, % | 181 (49.2) | 41 (62.1) | 140 (46.4) | 0.021 |
| Qualitative cCTA findings* | ||||
| Positive remodelling | 221 (45.1) | 39 (50.6) | 182 (44.1) | 0.319 |
| Low-attenuation plaque | 201 (41.0) | 36 (46.8) | 165 (40.0) | 0.313 |
| Spotty calcification | 142 (29.0) | 29 (37.7) | 113 (27.4) | 0.076 |
| Napkin-ring sign | 74 (15.1) | 19 (24.7) | 55 (13.3) | 0.015 |
| Adverse plaque | 241 (49.2) | 51 (66.2) | 190 (46.0) | 0.001 |
| PCAT attenuation analysis | ||||
| PCATRCA, HU | −81.5±8.1 | −76.3±6.4 | −82.5±8.1 | <0.001 |
| PCATVessel, HU | −81.1±8.1 | −76.7±7.5 | −82.0±7.8 | <0.001 |
| PCATLesion, HU | −81.0±8.9 | −76.5±7.9 | −81.8±8.9 | <0.001 |
| Values are expressed as mean±standard deviation, median (25th, 75th percentiles) or n (%). *Qualitative cCTA findings at the patient-level analysis are assessed in the lesions with the highest numbers of APCs among all lesions. APC: adverse plaque characteristic; cCTA: coronary computed tomography angiography; CP: calcified plaque; HU: Hounsfield unit; LAP: low-attenuation plaque; MLA: minimal lumen area; NCP: non-calcified plaque; PCAT: pericoronary adipose tissue; PCI: percutaneous coronary intervention; PoCE: patient-oriented composite endpoint; RCA: right coronary artery | ||||
Factors associated with PoCE
The results of the univariable and multivariable Cox regression analyses examining cardiovascular risk factors and cCTA findings associated with PoCE are summarised in Table 3 and Supplementary Table 3. At the patient level, the following were independently associated with PoCE occurrence: statin use at discharge; total plaque, LAP, NCP, and CP burdens; the presence of adverse plaque; and PCATRCA. At the target lesion level, the multivariable model showed that CP burden, the presence of adverse plaque, and PCATRCA were independently associated with PoCE occurrence. At the non-target lesion level, PCATRCA and total plaque, NCP, and CP burdens were independently associated with PoCE occurrence.
ROC analysis showed that the cutoff value of PCATRCA for identifying patients with subsequent PoCE was –79.9 HU (Supplementary Figure 2A). PoCE incidence was 3.9 times higher in patients with high PCATRCA (≥–79.9 HU: n=208) than in those with low PCATRCA (<–79.9 HU: n=282; 26.5% vs 7.8%, hazard ratio [HR] 3.85, 95% confidence interval [CI]: 2.33-6.35; p<0.001) (Supplementary Figure 3). Additionally, the incidences of MACE, TVF, TLF, all-cause death, cardiovascular death, any MI, any revascularisation, TVR, TLR, and heart failure hospitalisation were significantly higher in patients with high PCATRCA (≥–79.9 HU) than in those with low PCATRCA (<–79.9 HU) (Table 4). Of the 205 patients who had sufficient data for PMI evaluation, 39.0% (80/205) had PMI. Furthermore, consistent results were observed in the external cohort using the same cutoff value (Supplementary Table 4, Supplementary Figure 4).
ROC analysis of the CP burden showed that the cutoff value of this parameter for identifying patients with subsequent PoCE was 2.1% (Supplementary Figure 2B). Patients with adverse plaque had a 2.1 times higher incidence of PoCE compared to those with no adverse plaque, and those with high CP burden had a 2.4 times higher incidence of PoCE compared to patients with low CP burden (Supplementary Figure 5A, Supplementary Figure 5B).
Patients with high PCATRCA and adverse plaque had a significantly higher PoCE incidence than those with low PCATRCA and no adverse plaque (HR 6.40, 95% CI: 3.10-13.22; p<0.001) (Figure 2A), and those with high PCATRCA and high CP burden had a significantly higher PoCE incidence than those with low PCATRCA and low CP burden (HR 7.83, 95% CI: 3.90-15.73; p<0.001) (Figure 2B).
Table 3. Cox regression analysis of factors associated with PoCE at the patient level.
| Variables | Univariable analysis | Multivariable model | ||
|---|---|---|---|---|
| HR (95% CI) | p-value | HR (95% CI) | p-value | |
| Baseline patient characteristics | ||||
| Age | 1.02 (0.99-1.04) | 0.180 | ||
| Male sex | 1.54 (0.86-2.75) | 0.145 | 1.23 (0.68-2.23) | 0.490 |
| Hypertension | 0.73 (0.45-1.19) | 0.208 | ||
| Dyslipidaemia | 0.65 (0.40-1.04) | 0.069 | ||
| Diabetes mellitus | 1.36 (0.87-2.13) | 0.175 | ||
| Smoker | 1.29 (0.80-2.07) | 0.293 | ||
| hs-CRP (per 1 mg/L increase) | 1.01 (0.98-1.02) | 0.644 | ||
| LVEF | 0.97 (0.95-1.00) | 0.019 | 0.99 (0.97-1.01) | 0.260 |
| Statin use at discharge | 0.38 (0.22-0.66) | 0.001 | 0.45 (0.25-0.79) | 0.005 |
| cCTA findings | ||||
| Quantitative cCTA analysis | ||||
| Total plaque burden* | 2.14 (1.66-2.77) | <0.001 | ||
| LAP burden* | 1.15 (1.05-1.27) | 0.004 | 1.10 (1.01-1.20) | 0.035 |
| NCP burden* | 1.52 (1.23-1.87) | <0.001 | ||
| CP burden* | 1.04 (1.01-1.06) | 0.002 | 1.04 (1.02-1.07) | 0.002 |
| Qualitative cCTA findings | ||||
| Positive remodelling | 1.27 (0.82-1.99) | 0.287 | ||
| Low-attenuation plaque | 1.29 (0.83-2.02) | 0.261 | ||
| Spotty calcification | 1.93 (1.15-3.23) | 0.013 | ||
| Napkin-ring sign | 1.52 (0.96-2.41) | 0.074 | ||
| Adverse plaque | 2.14 (1.33-3.43) | 0.002 | 2.05 (1.26-3.34) | 0.004 |
| PCAT attenuation analysis | ||||
| PCATRCA (per 10 HU increase) | 2.31 (1.74-3.05) | <0.001 | 2.20 (1.63-2.97) | <0.001 |
| PCATLesion (per 10 HU increase) | 2.40 (1.79-3.23) | <0.001 | ||
| PCATVessel (per 10 HU increase) | 2.40 (1.79-3.23) | <0.001 | ||
| *Per 1.2-fold increase. cCTA: coronary computed tomography angiography; CI: confidence interval; CP: calcified plaque; HR: hazard ratio; hs-CRP: high-sensitivity C-reactive protein; HU: Hounsfield unit; LAP: low-attenuation plaque; LVEF: left ventricular ejection fraction; NCP: non-calcified plaque; PCAT: pericoronary adipose tissue; PoCE: patient-oriented composite endpoint; RCA: right coronary artery | ||||
Table 4. Comparison of the clinical outcomes between the high and low PCATRCA groups throughout the study.
| Endpoint | High PCATRCA (≥−79.9 HU) (n=208) | Low PCATRCA (<−79.9 HU) (n=282) | HR (95% CI) | p-value |
|---|---|---|---|---|
| PoCE | 26.5 (56) | 7.8 (21) | 3.85 (2.33-6.35) | <0.001 |
| MACE | 33.8 (72) | 9.7 (28) | 3.74 (2.42-5.79) | <0.001 |
| Target vessel failure | 12.1 (24) | 2.3 (7) | 4.90 (2.11-11.37) | <0.001 |
| Target lesion failure | 9.1 (18) | 2.6 (4) | 6.42 (2.17-18.97) | <0.001 |
| All-cause death | 10.5 (20) | 2.3 (6) | 4.65 (1.87-11.57) | <0.001 |
| Cardiovascular death | 4.8 (9) | NA (1) | 12.62 (1.60-99.61) | 0.016 |
| Any MI | 3.7 (7) | 0.1 (2) | 4.81 (1.00-23.16) | 0.049 |
| Non-fatal MI | 3.2 (6) | 0.1 (2) | 4.13 (0.83-20.45) | 0.083 |
| Any revascularisation | 17.4 (36) | 6.0 (16) | 3.25 (1.80-5.85) | <0.001 |
| Target vessel revascularisation | 7.4 (15) | 1.9 (6) | 3.54 (1.38-9.14) | 0.009 |
| Target lesion revascularisation | 4.4 (9) | 1.2 (3) | 4.26 (1.15-15.76) | 0.030 |
| Heart failure hospitalisation | 6.4 (13) | 2.7 (7) | 2.54 (1.01-6.38) | 0.047 |
| Stroke | 5.1 (11) | 1.8 (6) | 2.45 (0.91-6.63) | 0.078 |
| Event rates are Kaplan-Meier estimates, presented as % (n of events). CI: confidence interval; HR: hazard ratio; HU: Hounsfield unit; MACE: major adverse cardiovascular events; MI: myocardial infarction; PCAT: pericoronary adipose tissue; PoCE: patient-oriented composite endpoint; RCA: right coronary artery | ||||
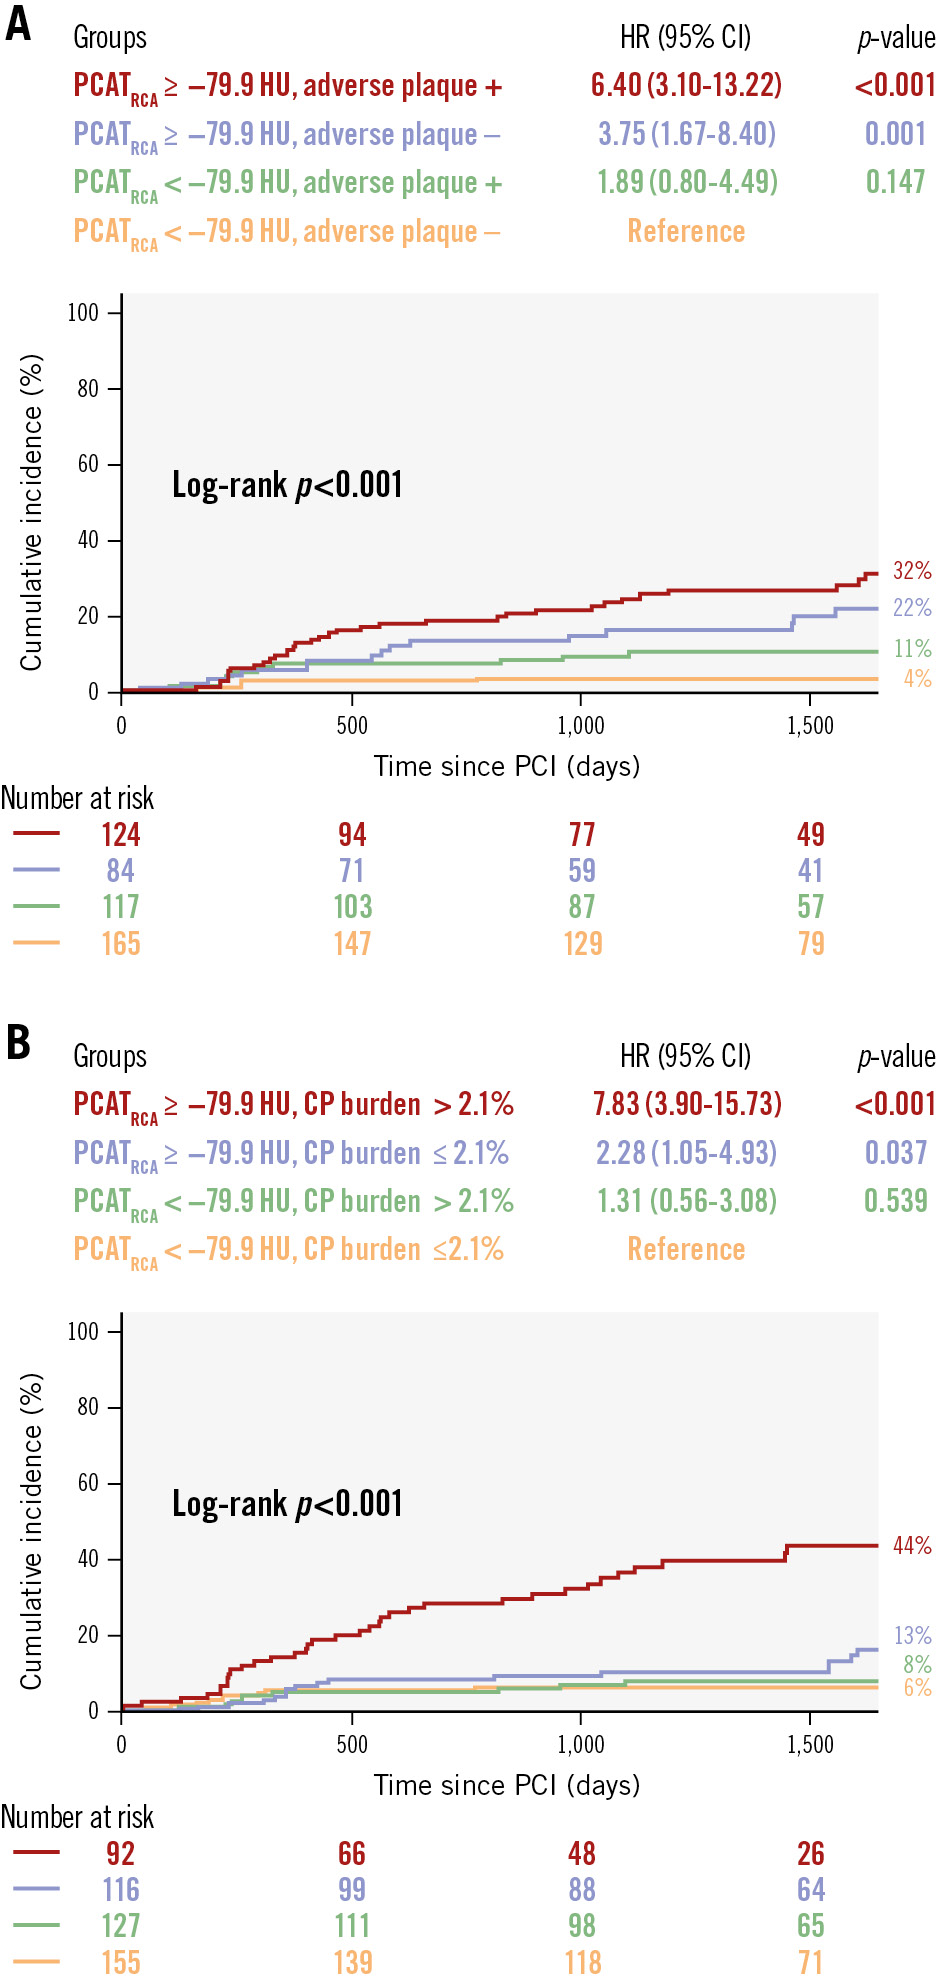
Figure 2. Kaplan-Meier curves for PoCE in different patient subgroups. Kaplan-Meier curves show the cumulative incidence of PoCE in subgroups based on (A) PCATRCA and adverse plaque and (B) PCATRCA and CP burden. Patients with high PCATRCA and adverse plaque or high CP burden have a significantly higher PoCE incidence compared to those with low PCATRCA and no adverse plaque or low CP burden. CI: confidence interval; CP: calcified plaque; HR: hazard ratio; HU: Hounsfield unit; PCAT: pericoronary adipose tissue; PCI: percutaneous coronary intervention; PoCE: patient-oriented composite endpoint; RCA: right coronary artery
Discriminatory diagnostic ability by adding factors for PoCE
The Central illustration shows the Harrell’s c-index, category-free net reclassification index (NRI), and integrated discrimination improvement (IDI) values for the three models. Compared with model 1 (cardiovascular risk factors), model 2 (model 1 plus adverse plaque and CP burden) showed significantly higher discriminatory (c-index: 0.651 vs 0.725; p=0.010) and reclassification (NRI: 0.473; p<0.001; relative IDI: 0.044; p<0.001) abilities to identify patients with subsequent PoCE. Compared with model 2, model 3 (model 2 plus PCATRCA) showed significantly higher discriminatory (c-index: 0.725 vs 0.802; p=0.005) and reclassification (NRI: 0.632; p<0.001; relative IDI: 0.069; p<0.001) abilities.
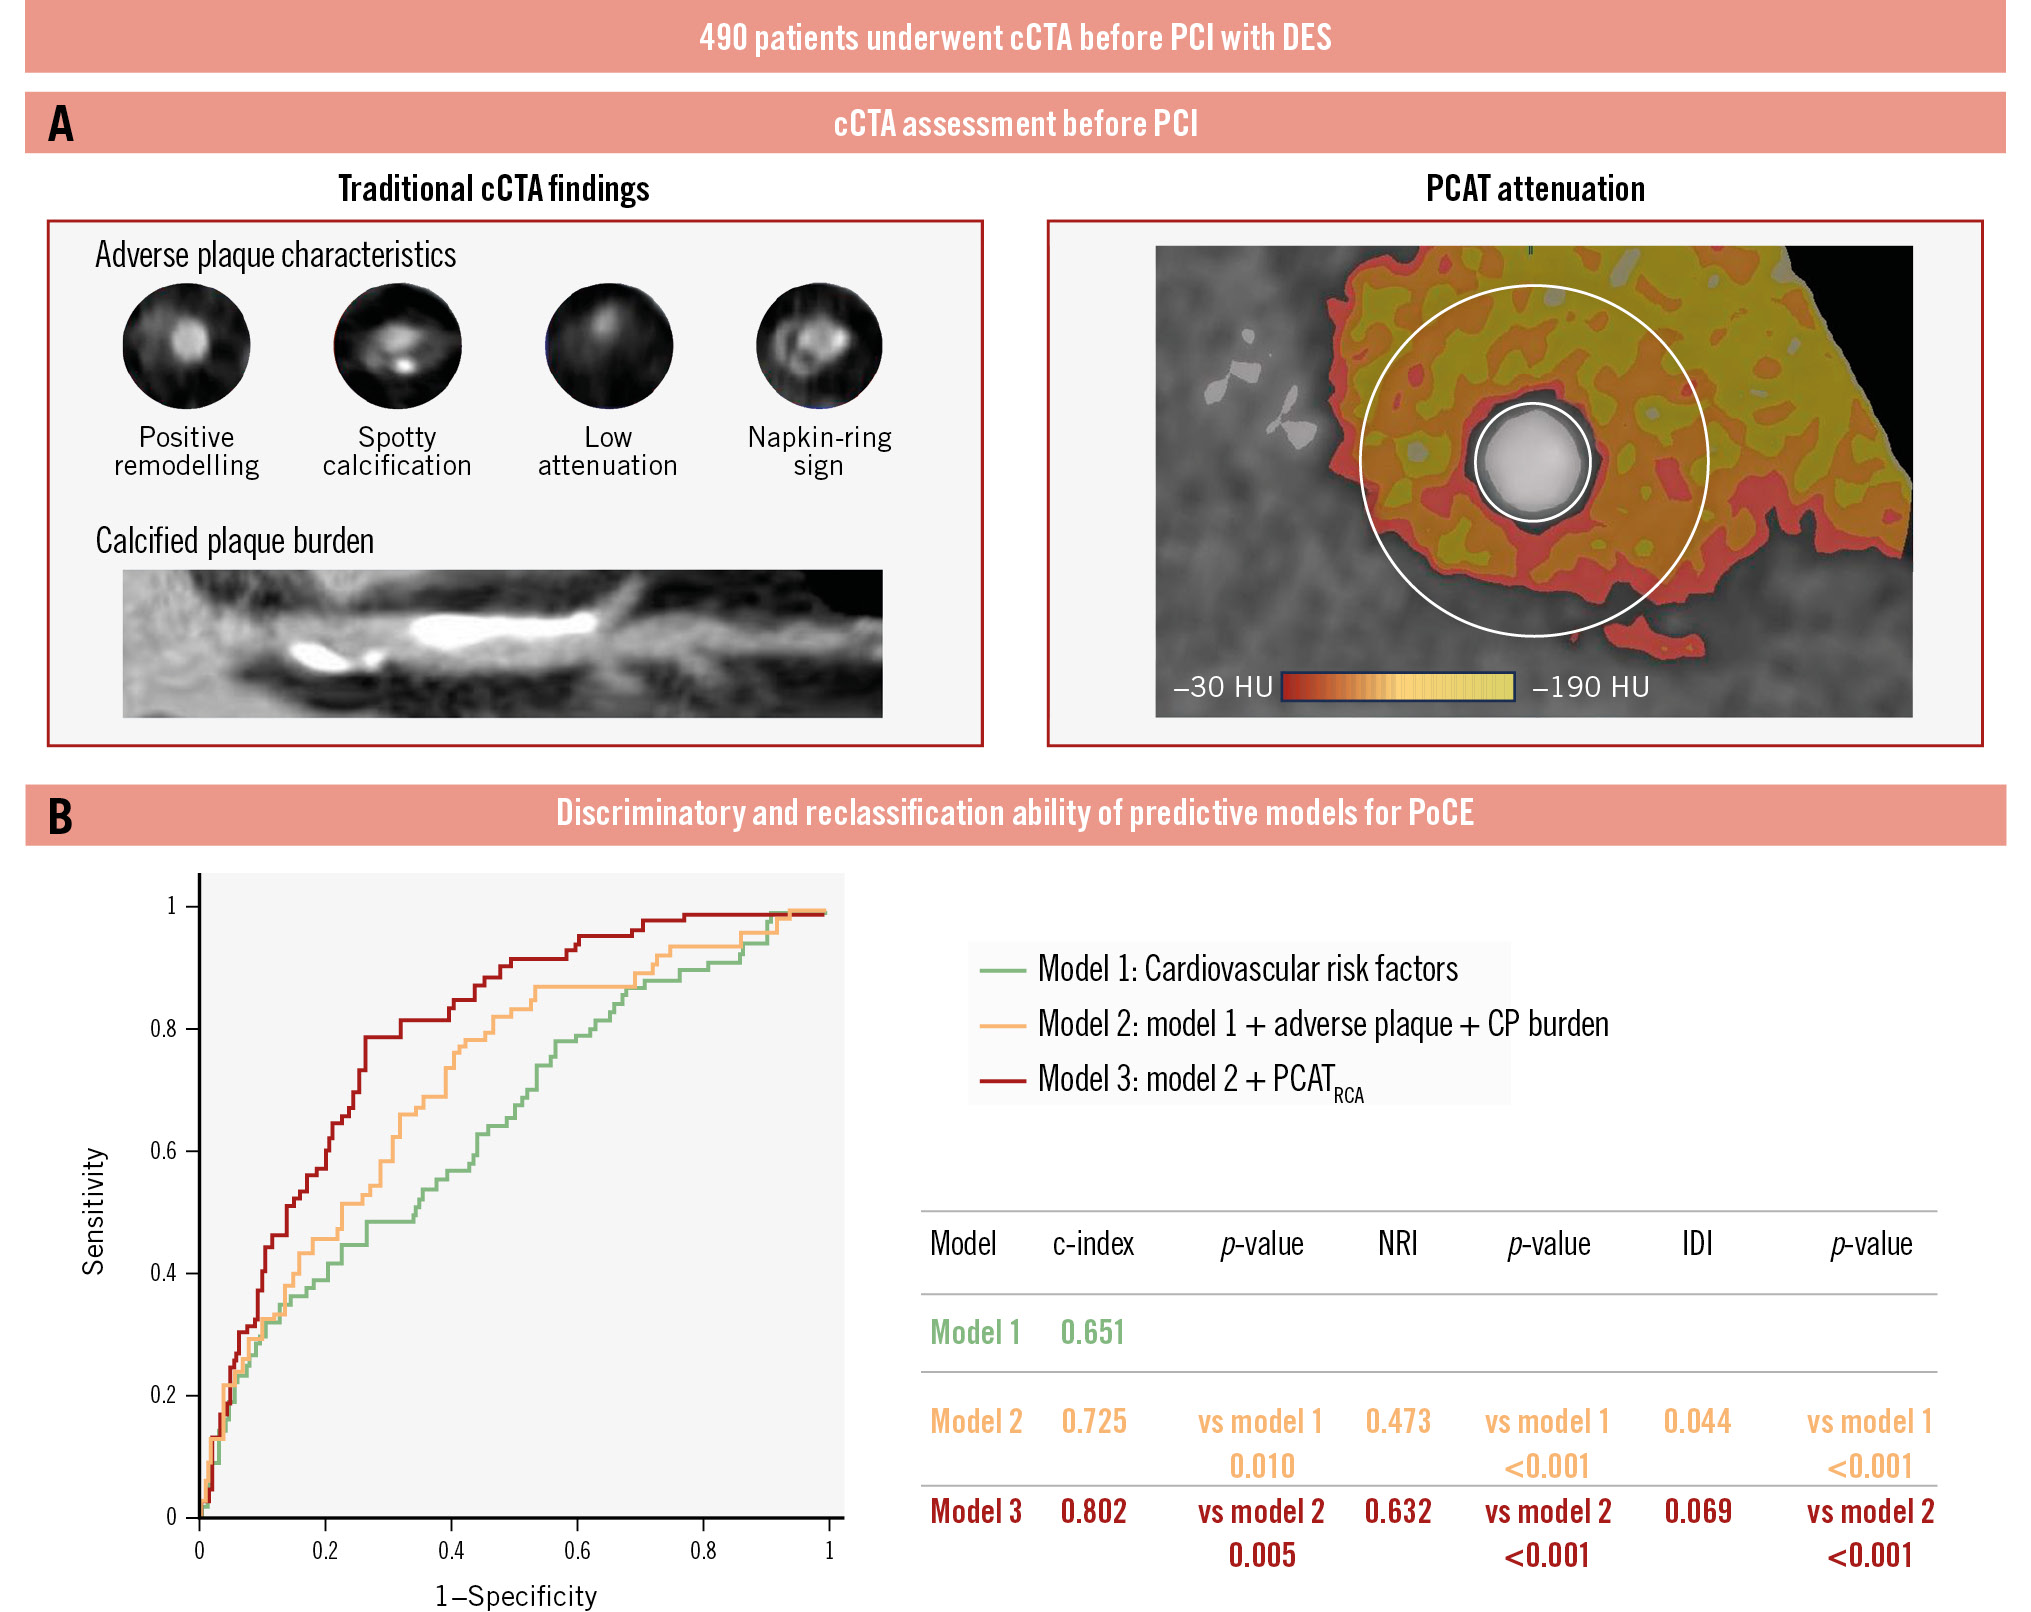
Central illustration. Discriminatory and reclassification abilities of predictive models for PoCE. A)The coronary computed tomography angiography (cCTA) assessment before percutaneous coronary intervention (PCI) included evaluation of traditional cCTA findings, adverse plaque characteristics and calcified plaque burden, and PCAT attenuation. B) Three analytical models were constructed: model 1, cardiovascular risk factors (green line); model 2, model 1+adverse plaque and CP burden (orange line); and model 3, model 2+PCATRCA (red line). Adding PCAT attenuation to traditional cardiovascular risk factors and preprocedural cCTA findings, such as adverse plaque and CP burden, improves predictive abilities for identifying the patient-oriented composite endpoint (PoCE) after PCI. c-index: concordance statistics; CP: calcified plaque; DES: drug-eluting stent; HU: Hounsfield unit; IDI: relative integrated discrimination improvement; NRI: category-free net reclassification index; PCAT: pericoronary adipose tissue; RCA: right coronary artery
Factors associated with PoCE in patients stratified by high and low PCATRCA
Supplementary Table 5 summarises the results of univariable and multivariable Cox regression analyses examining patient characteristics and medications associated with PoCE in patients with high and low PCATRCA. In the high PCATRCA group, the multivariable model showed that only non-statin use at discharge was independently associated with PoCE occurrence. Adjusted for patient characteristics (age, sex, smoking, and estimated glomerular filtration rate) and medications at discharge (beta blockers, renin-angiotensin system inhibitors, calcium channel blockers, and oral anticoagulants), the cumulative incidence of PoCE was 2.2 times lower in patients taking statins at discharge (22.7% vs 46.0%, HR 0.46, 95% CI: 0.24-0.88; p=0.018) (Supplementary Figure 6A). Conversely, in the low PCATRCA group, the multivariable model showed that neither statin nor other medication use was independently associated with PoCE after PCI. The cumulative incidence of PoCE did not significantly differ between patients taking or not taking statins at discharge (5.7% vs 6.9%, HR 0.94, 95% CI: 0.19-4.61; p=0.941) (Supplementary Figure 6B).
Relationship between cCTA findings, TVR, and TLR
The comparisons between the TVR and non-TVR groups are shown in Supplementary Table 6. PCATRCA, PCATVessel, and CP burden were independently associated with TVR (Supplementary Table 7). The area under the ROC curve (area under the curve [AUC]) values of PCATRCA, PCATVessel, and CP burden for the identification of TVR were 0.711, 0.681, and 0.677, respectively, with no differences in diagnostic performance (Supplementary Figure 7A).
Comparisons between the TLR and non-TLR groups are presented in Supplementary Table 8. PCATRCA, PCATLesion, and CP burden were independently associated with TLR (Supplementary Table 9). The AUC values of PCATRCA, PCATLesion, and CP burden for identifying TLR were 0.720, 0.706, and 0.703, respectively, with no differences in diagnostic performance (Supplementary Figure 7B).
Discussion
To the best of our knowledge, this is the first study to investigate the relationship between PCAT attenuation measured on pre-PCI cCTA and subsequent adverse clinical outcomes in patients who underwent PCI using current-generation DES. The main findings can be summarised as follows: (1) patients who experienced post-PCI PoCE had a significantly higher level of vascular inflammation, as indicated by increased pre-PCI PCAT attenuation; (2) in addition to medications at discharge and cCTA findings such as higher LAP and CP burdens, increased pre-PCI PCAT attenuation was independently associated with PoCE occurrence, TVR, and TLR in patients undergoing PCI; (3) adding PCAT attenuation to traditional cardiovascular risk factors and cCTA findings improved the ability to identify post-PCI PoCE; (4) in the high PCATRCA group, but not in the low PCATRCA group, non-statin use at discharge was independently associated with PoCE occurrence; and (5) increased PCATVessel and PCATLesion were independently associated with TVR and TLR occurrence, respectively, but the predictive accuracy of these measurements was similar to that of PCATRCA. This study is the first real-world cohort with a long-term follow-up that clarifies the clinical relevance of PCAT attenuation measured on pre-PCI cCTA in identifying patients undergoing PCI using current-generation DES with subsequent PoCE.
Relationship between pre-PCI PCAT assessment and post-PCI clinical outcomes
Currently, PCI is the gold-standard treatment for patients with CAD. While current-generation DES have improved long-term outcomes by reducing TLR and stent thrombosis, adverse events still occur. Coronary inflammation has emerged as a key residual risk factor for cardiovascular events3 and a potential target for preventive therapy. In a previous randomised study comparing eicosapentaenoic acid (EPA) plus statin with statin-only therapy, we demonstrated that EPA stabilises thin-cap fibroatheromas better than statin-only therapy through greater suppression of vascular inflammation, assessed by hs-CRP and pentraxin-314. Furthermore, the CANTOS placebo-controlled, randomised study demonstrated that canakinumab, a novel interleukin-1β inhibitor, significantly reduces the risk of recurrent cardiovascular events in patients with a history of MI and an elevated baseline hs-CRP4. These data highlight the potential utility of coronary inflammation assessments in the management of patients with CAD undergoing PCI.
Recently cCTA has emerged as a non-invasive method to evaluate PCAT attenuation, which potentially represents the inflammatory status of adjacent coronary arteries9. The ORFAN trial analysed 3,393 patients undergoing cCTA and showed that an increased fat attenuation index (FAI)-Score, which is a coronary inflammation marker like PCAT attenuation, in all three coronary arteries additively increased the risk of cardiac mortality or MACE15. In a recent post hoc analysis of the CRISP-CT study, Oikonomou et al demonstrated that the FAI was a strong predictor of all-cause and cardiac mortality over established cardiovascular risk factors and cCTA findings in 3,912 patients undergoing cCTA8. The FAI is calculated based on PCAT attenuation. Similarly to the FAI, crude PCAT attenuation has been validated in prior studies through histological and gene expression analyses89. We hypothesised that there might be a significant association between pre-PCI PCAT attenuation and post-PCI clinical outcomes and that clarifying this association would contribute to identifying patients who would benefit from therapies targeting plaque inflammation as secondary prevention of CAD.
In this study, using PCATRCA as a patient-level coronary inflammation marker based on prior evidence1617, we found that increased PCATRCA was independently associated with PoCE occurrence after PCI using current-generation DES. Specifically, the incidence of PoCE was 3.9 times higher in patients with high PCATRCA than in those with low PCATRCA. Additionally, high PCATRCA was significantly associated with adverse patient-level outcomes such as MACE, all-cause death, cardiovascular death, any MI, any revascularisation, and heart failure hospitalisation, as well as adverse vessel- and lesion-level outcomes such as TVF, TLF, TVR, and TLR. Regarding adverse clinical outcomes, 51.9% of patients with PoCE (40/77) required revascularisation due to significant non-target lesion progression. Although the mechanisms underlying high PCAT attenuation and subsequent adverse clinical outcomes remain uncertain, we speculate that the enhanced pan-coronary inflammatory status, as indicated by high PCATRCA, contributes to progressive plaque development and instability not only in target lesions but also in non-target lesions. Goeller et al analysed 111 stable patients who underwent sequential cCTA and demonstrated that baseline PCAT attenuation was independently associated with NCP progression, which was not suppressed by low-density lipid cholesterol reduction during follow-up16.
In the present study, baseline hs-CRP levels were lower than in previous reports1819. The median preprocedural hs-CRP level was 0.80 mg/L. According to a previous study, a large-scale prospective PCI registry in the USA in which 53% of patients had stable CAD, high inflammatory status is defined as baseline hs-CRP >2 mg/L, with 53% of that study’s CAD patients meeting this criterion20. However, only 23.8% of our cohort met this high hs-CRP threshold. Thus, our lower baseline hs-CRP cohort may explain the lack of difference in hs-CRP levels between the PoCE and non-PoCE groups. However, even among the current cohort with relatively lower hs-CRP levels, PCAT attenuation demonstrated an improvement in the prediction of PoCE features, suggesting it may serve as a more specific and targeted biomarker for risk stratification and predicting clinical outcomes.
Our subgroup analysis showed that non-statin use was independently associated with PoCE in patients with high PCATRCA, but not in those with low PCATRCA. This suggests that statins may be more effective in patients with higher coronary inflammation, and measuring PCATRCA could help identify those who would benefit most from anti-inflammatory treatment. This should be confirmed by further studies with larger sample sizes.
Incremental value of inflammation to adverse and calcified plaques
Previous studies have shown the prognostic value of adverse plaque features and coronary calcification via cCTA in patients who had undergone PCI2122. Our study supports this, finding that adverse plaque and CP burden were independently associated with post-PCI PoCE. Combining cardiovascular risk factors with adverse plaque and CP burden improved prediction, but the discriminative power (c-index 0.725) remained insufficient for clinical use. We also found that PCATRCA independently predicted PoCE and added incremental value over models with traditional risk factors and cCTA findings. This suggests that combining PCAT attenuation with cCTA findings may improve PoCE risk stratification. Oikonomou et al demonstrated that adverse plaque features with low inflammation, assessed using PCAT attenuation, were not associated with increased cardiovascular risk, whereas in the presence of inflammation, adverse plaque features identified a particularly high-risk group of patients23. These findings support our hypothesis.
Previous studies have shown that coronary inflammation leads to microcalcification, which accumulates into a large mass and becomes a spotty calcification that is more likely to be associated with plaque rupture, while reduced inflammation results in macrocalcification that stabilises plaques and limits inflammation24. Therefore, assessing coronary calcification alone is not sufficient to identify high-risk plaques, highlighting the importance of assessing intrinsic coronary artery inflammation. Considering these findings, the assessment of adverse or calcified plaques alone is insufficient for precise risk assessment of the target plaque, as most plaques identified at a single timepoint assessment heal naturally and do not always lead to clinical events. Indeed, in our study, patients with adverse plaque and high CP burden had a higher PoCE incidence if they also had high PCATRCA (32% and 44%, respectively) compared to those with low PCATRCA (11% and 8%, respectively). Therefore, adverse or calcified plaques alone do not identify high-risk patients. By incorporating PCATRCA, higher-risk subgroups were identified more effectively, suggesting that measuring PCAT attenuation enhances risk stratification for post-PCI outcomes.
Relationship between vessel- or lesion-level PCAT attenuation and TVR or TLR
In this study, we examined the relationship between target vessel- or lesion-level coronary inflammation and clinical events such as TVR and TLR. Multivariable analyses showed that increased PCATVessel and PCATLesion were independently associated with TVR and TLR. Surprisingly, despite the hypothesis that PCATVessel and PCATLesion would reflect more specific local inflammation, their predictive abilities were similar to those of PCATRCA.
Currently, PCATRCA is regarded as a global coronary inflammation biomarker, valuable for predicting cardiac mortality. Goeller et al found that longitudinal changes in PCATRCA were associated with changes in NCP burden across the entire coronary tree16. Lin et al studied cCTA in patients with MI, stable CAD, and no CAD, and showed that PCATRCA was progressively higher in patients with MI, then stable CAD, then no CAD, and could therefore help differentiate between CAD stages. Notably, these findings were unaffected by lesion distribution (RCA vs non-RCA), suggesting that PCATRCA reflects overall coronary rather than just lesion-specific inflammation17. In general, the proximal RCA has the highest volume of surrounding adipose tissue and lacks confounding non-fatty structures (side branches, coronary veins, or myocardium). Additionally, the luminal diameter is stable. Thus, measuring PCATRCA is the most standardised and reproducible patient-level approach to evaluate pan-coronary inflammation8. In light of these findings, the diagnostic performance of PCATRCA for predicting TVR and TLR is comparable to that of PCATVessel and PCATLesion, making it a comprehensive indicator of coronary artery inflammation and future adverse clinical events in patients undergoing PCI.
Limitations
First, the inclusion and exclusion criteria led to differences in baseline characteristics, including higher clinical risk profiles among excluded patients (Supplementary Table 10), which may limit the generalisability of the findings. The levels of hs-CRP were relatively lower in the current study than in previous reports. Thus, the retrospective design introduces potential selection bias. Second, a relatively large number of patients (80/702) were excluded owing to insufficient CT image quality. Third, although the PoCE is a composite outcome whose associated factors might differ for each outcome, we might not have adequately assessed each clinical outcome due to the limited sample size. Fourth, we used crude PCAT attenuation, derived directly from CT values, instead of the artificial intelligence-adjusted FAI metric. While crude PCAT attenuation may be influenced by body composition and CT scanner differences, no significant scanner-related variability was observed in our cohort (Supplementary Table 11). PCAT attenuation has been widely validated for assessing coronary inflammation in patients with high-risk lesions or major events, supporting its reliability as a measurement tool1617 Finally, we did not directly measure coronary inflammation; however, recent studies have shown that PCAT attenuation is associated with biopsy-proven vascular inflammation9. This supports the potential of PCAT attenuation as a surrogate marker for coronary inflammation. Future studies are needed to explore whether the residual cardiovascular risk detected by PCAT attenuation can be reduced using targeted anti-inflammatory interventions.
Conclusions
This study demonstrates that PCAT attenuation is an independent factor associated with PoCE after PCI using current-generation DES. Adding PCAT attenuation to traditional cCTA findings and cardiovascular risk factors enables better discrimination of patients experiencing PoCE after PCI with current-generation DES.
Impact on daily practice
Coronary inflammation is recognised as a significant residual risk factor for cardiovascular events, with pericoronary adipose tissue (PCAT) attenuation on coronary computed tomography angiography (cCTA) being a novel marker linked to higher risks of cardiac mortality and major adverse events. This study demonstrates that PCAT attenuation is independently associated with the patient-oriented composite endpoint after percutaneous coronary intervention with current-generation drug-eluting stents, and its inclusion alongside traditional cCTA findings and cardiovascular risk factors enhances patient risk discrimination. Measuring PCAT attenuation may be useful for identifying patients who would benefit the most from anti-inflammatory drugs.
Conflict of interest statement
The authors have no conflicts of interest to declare that are relevant to the content of this article.
Supplementary data
To read the full content of this article, please download the PDF.