Cory:
Unlock Your AI Assistant Now!
Abstract
Background: Quantitative flow ratio (QFR) is a guideline-recommended angiography-based estimation of fractional flow reserve (FFR) for functional lesion evaluation. The FAVOR III Europe trial raised concerns regarding the safety and efficacy of QFR compared with FFR. Whether the poor clinical outcomes in the trial were attributable to software limitations or suboptimal in-procedure QFR analysis is unknown.
Aims: We aimed to compare in-procedure and core laboratory QFR, and to evaluate the quality of in-procedure QFR analyses.
Methods: The 1,008 patients randomised to QFR in FAVOR III Europe were assessed for eligibility. Core laboratory QFR analyses were performed by two blinded observers. The quality of in-procedure QFR analyses were evaluated during patient enrolment. Quality scores from 1 (very poor) to 5 (very good) were assigned based on adherence to the standard operating procedure (SOP).
Results: Of 1,233 vessels with in-procedure QFR, 1,191 (96.6%) were analysable in the core laboratory and were included in the paired analysis. The median in-procedure QFR was 0.81 (interquartile range [IQR] 0.71-0.90) and core laboratory QFR was 0.84 (IQR 0.73-0.91). The mean difference was 0.02 (95% limits of agreement: –0.26 to 0.29). Spearman’s rank correlation coefficient was 0.58, and diagnostic agreement was 72%. Most in-procedure QFR analyses demonstrated very good (19%), good (45%), or acceptable (28%) SOP adherence, while 8% were rated as poor or very poor. Suboptimal angiographic quality, poor in-procedure QFR analysis quality, high SYNTAX score, and diabetes were predictors of increased variability.
Conclusions: In FAVOR III Europe, agreement between in-procedure and core laboratory QFR was modest. Measurement variability increased with reduced angiographic quality, poor in-procedure QFR analysis quality, and more advanced coronary artery disease.
Functional lesion evaluation is recommended for guiding treatment decisions in patients with chronic coronary syndrome (CCS) and intermediate coronary artery stenosis12. Fractional flow reserve (FFR) is considered the reference standard for invasive functional assessment of coronary artery stenosis severity3456, but FFR requires costly pressure wires and medically induced hyperaemia, limiting its utilisation789. To overcome these limitations, angiography-derived computation methods for functional lesion evaluation were developed, and several systems are now commercially available for clinical use101112.
Quantitative flow ratio (QFR) is an angiography-based computation method for the estimation of absolute FFR measures. Two angiographic projections of the vessel of interest are required to estimate FFR using three-dimensional (3D) quantitative coronary angiography and emulated flow velocity. In-procedure QFR is feasible with a shorter time to diagnosis than with FFR13. Early studies indicated good diagnostic agreement with FFR141516, and the randomised FAVOR III China trial showed improved clinical outcomes with a QFR-based strategy compared with standard angiographic guidance in patients with an indication for percutaneous coronary intervention (PCI)1718. These findings supported the European Society of Cardiology (ESC) Class I, Level of Evidence A and Level of Evidence B recommendations for QFR in guiding coronary revascularisation in patients with CCS1. The FAVOR III Europe trial subsequently found that QFR, when implemented in a multicentre clinical setting, led to increased revascularisation rates and did not meet non-inferiority to FFR in terms of major adverse cardiac events (MACE) at 1 year19. It is unclear to which degree the poor performance was related to limitations with the computation of QFR by the software or to usability issues during in-procedure application by the QFR observers in the trial20. The aim of this predefined FAVOR III Europe substudy was to (1) compare in-procedure QFR with a centralised core laboratory QFR analysis and2 report on the quality of in-procedure QFR analyses.
Methods
Study design
The design of the FAVOR III Europe trial has been described in detail in previous publications1921. In summary, the FAVOR III Europe trial was an investigator-initiated, randomised, multicentre, open-label, controlled trial conducted at 34 European centres. The trial aimed to assess whether QFR-guided revascularisation would meet non-inferiority to FFR-guided revascularisation in terms of 12-month MACE. The trial was approved by The Central Jutland Committees on Health Research Ethics and by the national or local ethics committees for all participating sites. All patients provided written informed consent, and the trial was compliant with the principles of the Declaration of Helsinki.
The present study is a predefined substudy conducted to compare in-procedure QFR study analyses with QFR analysis performed by the centralised trial core laboratory and to report the quality of in-procedure QFR analysis.
Study population
Vessels that underwent functional evaluation from patients randomised to QFR-guided revascularisation in the FAVOR III Europe trial were assessed for eligibility. Paired analysis of in-procedure versus core laboratory QFR included study vessels with (1) an in-procedure QFR value and (2) at least two baseline angiographic images by which core laboratory QFR could be computed. Additional information on the study population is available in Supplementary Appendix 1.
QFR analysis software
Both in-procedure and core laboratory QFR analyses were performed using the Medis Suite application, QAngio XA 3D QFR analysis solution, version 2.0 (Medis Medical Imaging Systems). The QFR analysis process entails a series of steps including the selection of two suitable angiographic series, identification of end-diastolic frames, selection of proximal and distal analysis delimiters, correction of automatic lumen contours, selection of reference function strategy, and Thrombolysis in Myocardial Infarction flow count.
In-procedure QFR analysis
In-procedure QFR measurements were performed by trained QFR observers having completed vendor certification and subsequent study training on QFR analysis. Contrast-flow QFR was used as the final QFR value for clinical decision-making and was the value included in the main paired analysis of the present study. It is referred to as QFR throughout this paper. The agreement between in-procedure and core laboratory fixed-flow QFR (fQFR) is reported in the Supplementary data.
Quality scoring of in-procedure QFR analysis
Quality scoring of in-procedure QFR analyses was performed during the enrolment period of the FAVOR III Europe trial by four QFR observers at the angiographic core laboratory at Aarhus University Hospital, Denmark. Quality scoring was performed as part of the continuous feedback process and was only possible for patients with available QFR source data. For each step of the analysis, the degree of adherence to the standard operating procedure (SOP) was assessed and rated on a scale from 1 to 5: 1 (very poor), 2 (poor), 3 (acceptable), 4 (good), and 5 (very good). Based on these ratings, an overall quality score was assigned to each analysis. Further details on the rating scales are available in Supplementary Appendix 2.
Core laboratory QFR analysis and blinding
Core laboratory analysis was undertaken by two trained QFR observers (Department of Clinical Medicine, Aarhus University, Aarhus, Denmark) in accordance with the FAVOR III Europe QFR SOP21. To ensure effective blinding to in-procedure QFR results as well as treatment decisions, all angiographies were pseudonymised, and only diagnostic coronary imaging runs were available during the core laboratory reanalysis process. Furthermore, core laboratory observers were only provided with the study lesion location (segment number), with no information on the proximal or distal delimiters applied during the in-procedure QFR analysis. Proximal and distal delimiters were selected by the core laboratory observers in accordance with the FAVOR III Europe SOP, which was also applied by the site observers during the trial. The aim was to delimit long segments for analysis to ensure a reliable contrast frame count. Angiographic image quality was assessed by the two core laboratory observers during the core laboratory analyses. Based on their judgement of the QFR software’s ability to automatically detect vessel contours, the core laboratory observers assigned a quality score from 1 to 4 (1: no automatic detection; 2: poor automatic detection; 3: acceptable automatic detection; 4: good automatic detection). In cases of uncertainty, scoring was performed by consensus of a third QFR observer. Furthermore, for each core laboratory QFR analysis, the two selected projections were assessed for specific angiographic limitations to QFR analysis, including panning, overlap of target vessel, inadequate contrast filling, and vessel foreshortening.
The core laboratory observers aimed to perform QFR analysis on all study vessels. However, cases which were deemed unsuitable by consensus between at least two core laboratory observers, because of the high severity of the aforementioned angiographic limitations, were excluded.
Evaluation of intra-core laboratory reproducibility
To evaluate intra-core laboratory reproducibility, a third core laboratory QFR observer, blinded to both in-procedure and initial core laboratory results, repeated the analyses in a random subset of 100 study vessels.
Associations with clinical outcomes
The association between in-procedure QFR analysis quality and 1-year MACE was evaluated for the QFR population with available quality scores. In cases with multiple analysed stenoses, the analysis with the lowest score was used for this evaluation. MACE included all-cause death, myocardial infarction, and unplanned revascularisation19.
Statistical analysis
The main paired analysis compared in-procedure and core laboratory QFR. Agreement between in-procedure QFR and core laboratory QFR measurements was assessed using Bland-Altman plots, illustrating the mean difference (bias) and the 95% limits of agreement. Spearman’s rank correlation coefficient (rho) was calculated to assess the association between in-procedure and core laboratory QFR results. Both the Bland-Altman plots and Spearman’s correlation coefficient were analysed at the patient level, using the largest absolute difference per patient between two paired measurements. Similar calculations at the lesion level are included in the Supplementary Data, as the dependence between observations was deemed negligible in paired analyses. Furthermore, the following supplementary paired analyses are included in the Supplementary Data: (1) in-procedure fQFR vs core laboratory fQFR; (2) in-procedure QFR vs core laboratory QFR, including vessels excluded from the main paired analysis because of severe angiographic limitations; and (3) core laboratory QFR vs core laboratory fQFR. Diagnostic agreement was defined as the proportion of lesions for which in-procedure and core laboratory QFR results were in agreement according to a cutoff value of ≤0.80. To evaluate predictors of increased difference between in-procedure and core laboratory QFR results, a mixed logistic regression analysis with random effects was performed to account for variability within and between patients. The following variables were included in the univariable analysis: age, clinical presentation at baseline (chronic or acute coronary syndrome), body mass index (BMI), diabetes, SYNTAX score, angiographic image quality, and in-procedure QFR analysis quality score. The multivariable model included factors with a p-value of <0.10 in the univariable analysis.
Core laboratory interobserver variation was assessed in the same manner as the paired analysis of in-procedure versus core laboratory QFR, using a random sample of 100 lesions.
Kaplan-Meier survival curves are presented together with hazard ratios (HRs) and 95% confidence intervals (CIs) based on Cox regression analysis to evaluate associations between the in-procedure QFR analysis quality and MACE.
The normality of the data was assessed using the Shapiro-Wilk test. In-procedure and core laboratory QFR values were compared using a paired t-test when normally distributed, or a Wilcoxon signed-rank test when not normally distributed. The proportions of significant vessels identified by in-procedure versus core laboratory QFR were compared using McNemar’s test.
Statistical significance was defined as a two-sided p-value<0.05. All statistical analyses were performed using Stata, version 18.0 (StataCorp).
Results
Study population
The 1,008 patients (1,281 vessels) randomised to the QFR group in the main FAVOR III Europe trial were assessed for eligibility (Figure 1). In these patients, 39 vessels did not have an in-procedure QFR value, and 9 were identified as duplicate electronic case report form reportings of QFR analyses. A further 42 vessels could not be analysed in the core laboratory due to severe angiographic limitations precluding reliable QFR analysis (n=21), availability of one single angiographic image (n=12), zero available angiographic images (n=5), angiographic projections with less than 20 degrees of separation (n=3), and myocardial bridging (n=1). A total of 950 patients (1,191 study vessels) were included in the paired analysis.
Baseline patient and lesion characteristics are listed in Table 1. The median age was 67.0 (interquartile range [IQR] 60.4, 74.7) years, and the median BMI was 27.2 (IQR 24.7, 30.4) kg/m². Most patients were male (742 [78.1%]), and 617 (65.0%) presented with chronic coronary syndrome. The left anterior descending coronary artery (LAD) accounted for 573 of the 1,191 study vessels (48.1%).
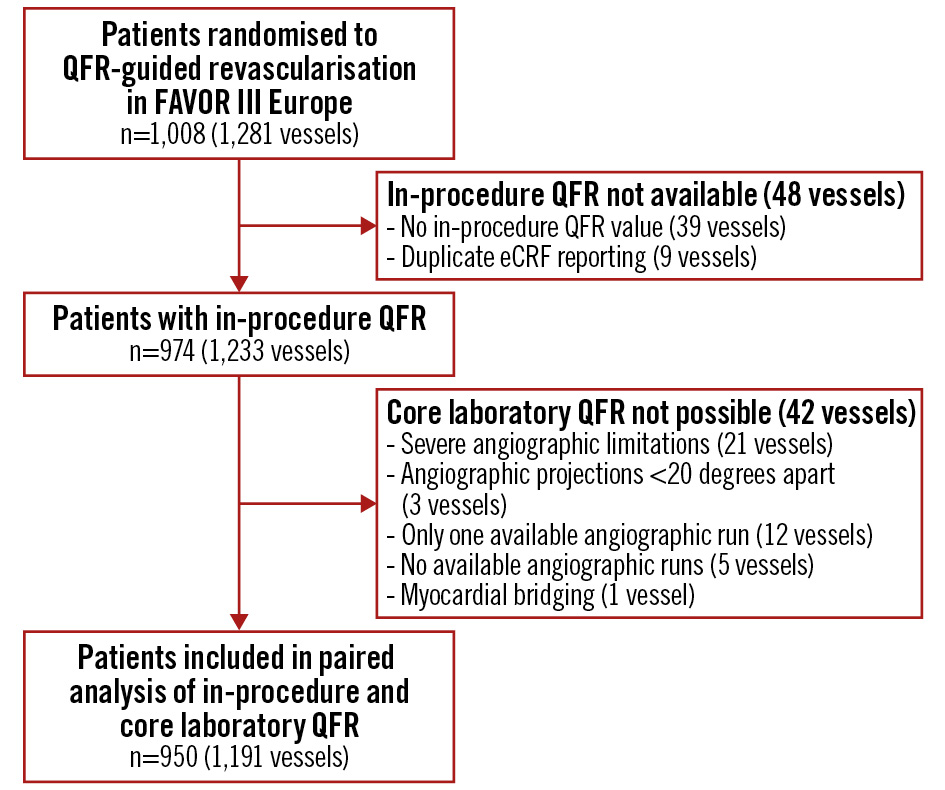
Figure 1. Patient flowchart. A total of 1,008 patients (1,281 vessels) were randomised to a QFR-guided strategy in the FAVOR III Europe trial. Of these, 974 patients (1,233 vessels) had available in-procedure QFR values. Core laboratory QFR was not feasible in 24 patients (42 vessels). A total of 950 patients (1,191 study vessels) were included in the paired analysis. eCRF: electronic case report form; QFR: quantitative flow ratio
Table 1. Baseline patient and lesion characteristics.
| Demographics | |
|---|---|
| Age, years | 67.0 (60.4, 74.7) |
| Female | 208/950 (21.9) |
| BMI, kg/m² | 27.2 (24.7, 30.4) |
| History of PCI | 464/947 (49.0) |
| Number of diseased vessels | |
| 1 | 511/950 (53.8) |
| 2 | 347/950 (36.5) |
| 3 | 92/950 (9.7) |
| Chronic coronary syndrome | 617/950 (65.0) |
| Risk factors | |
| Diabetes | 241/949 (25.4) |
| Statin treatment | 684/948 (72.2) |
| Active smoking | 234/909 (25.7) |
| Family history of ischaemic heart disease | 276/913 (30.2) |
| Antihypertensive treatment | 741/950 (78.0) |
| Lesion characteristics | |
| Location of study lesion | |
| LAD | 573/1,191 (48.1) |
| Diagonal branch | 25/1,191 (2.1) |
| RCA | 335/1,191 (28.1) |
| LCx | 159/1,191 (13.4) |
| OM | 90/1,191 (7.6) |
| IB | 9/1,191 (0.8) |
| Values are n/N (%) or median (IQR). Smokers reported are current smokers only. BMI: body mass index; IB: intermediate branch; IQR: interquartile range; LAD: left anterior descending coronary artery; LCx: left circumflex coronary artery; OM: obtuse marginal; PCI: percutaneous coronary intervention; RCA: right coronary artery | |
Agreement between in-procedure and core laboratory QFR
The results of in-procedure and core laboratory QFR analyses are presented in Table 2. The median in-procedure QFR was 0.81 (IQR 0.71, 0.90), while the median core laboratory QFR was 0.84 (IQR 0.73, 0.91; p<0.0001). The distributions of in-procedure and core laboratory QFR values are shown in Supplementary Figure 1. More contour correction points were used per analysis in the core laboratory (37 [IQR 23, 56]) as compared with the in-procedure QFR analyses (10 [IQR 5, 17]). The automatic reference function was used in 65.7% of in-procedure QFR analyses and 71.3% of core laboratory QFR analyses.
The Spearman’s rank correlation coefficient (rho) for the agreement between in-procedure and core laboratory QFR was 0.58 (Figure 2). The mean difference (bias) between in-procedure QFR and core laboratory QFR was 0.02±0.14, and the 95% limits of agreement were –0.26 to 0.29 (Central illustration).
A total of 571/1,191 analyses (48%) had positive values (≤0.80) according to in-procedure QFR as compared with 484/1,191 vessels (41%) by core laboratory QFR (p<0.0001). The diagnostic agreement between in-procedure and core laboratory QFR measurements was 72%. Overall, in-procedure QFR led to PCI in 211 vessels (18%) with a negative core laboratory QFR and to deferral of revascularisation in 124 vessels (10%) with a positive core laboratory QFR (Central illustration). The distribution of significant lesions in the coronary arteries with in-procedure and core laboratory QFR is presented in Supplementary Table 1. The greatest discrepancies were observed in the left circumflex coronary artery (LCx) and its obtuse marginal (OM) branches, where 41% of vessels had a positive in-procedure QFR compared with only 25% in the core laboratory analysis.
Lesion-level agreement between in-procedure and core laboratory QFR was consistent with the patient-level findings (Supplementary Appendix 3, Supplementary Figure 2), and exploratory analysis demonstrated similar agreement between in-procedure and core laboratory fixed-flow QFR (Supplementary Appendix 4, Supplementary Figure 3, Supplementary Figure 4). Results on the correlation between contrast-flow QFR and fQFR in the core laboratory analyses are available in Supplementary Appendix 5, Supplementary Figure 5, and Supplementary Figure 6.
The results of the exploratory analysis, which included the 21 vessels excluded from the main paired analysis due to severe angiographic limitations precluding reliable QFR analysis, were consistent with the main findings (Supplementary Appendix 6, Supplementary Figure 7, Supplementary Figure 8).
Table 2. Characterisation of in-procedure and core laboratory QFR analyses.
| In-procedure QFR | Core laboratory QFR | |
|---|---|---|
| Angiographic limitations | ||
| Lesion with vessel overlap | - | 385/1,191 (32.3) |
| Panning | 50/1,191 (4.2) | |
| Poor contrast filling | 403/1,191 (33.8) | |
| Foreshortening of target vessel | 302/1,191 (25.4) | |
| Angiographic image quality score | ||
| 0 – no automatic contour detection | - | 20/1,191 (1.7) |
| 1 – poor automatic contour detection | 289/1,191 (24.3) | |
| 2 – acceptable automatic contour detection | 652/1,191 (54.7) | |
| 3 – good automatic contour detection | 230/1,191 (19.3) | |
| Use of contour correction points | 10 (5, 17) | 37 (23, 56) |
| Use of reference function | ||
| Automatic | 711/1,083 (65.7) | 849/1,191(71.3) |
| Normals | 329/1,083 (30.4) | 238/1,191 (20.0) |
| Fixed proximal reference size | 43/1,083 (4.0) | 104/1,191 (8.7) |
| QFR results | 0.81 (0.71, 0.90) | 0.84 (0.73, 0.91) |
| Values are n/N (%) or median (IQR). Angiographic image quality score and angiographic limitations were evaluated by the core laboratory observers in relation to core laboratory QFR analysis. IQR: interquartile range; QFR: quantitative flow ratio | ||
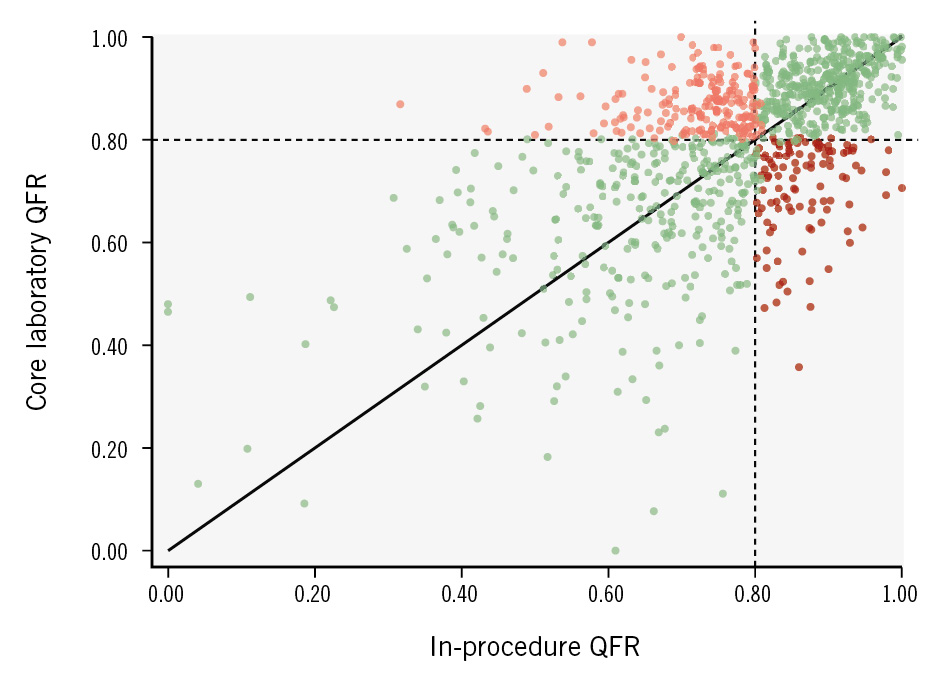
Figure 2. Association between in-procedure QFR and core laboratory QFR. The scatter plot illustrates the association between in-procedure and core laboratory QFR analyses. This patient-level analysis includes the observation with the largest numerical difference per patient in cases with more than one paired QFR assessment. Darker areas indicate higher point density. All vessels showing diagnostic agreement between in-procedure and core laboratory QFR are marked in green, while all vessels showing disagreement are marked in red: pale red: in-procedure QFR ≤0.80 and core laboratory QFR >0.80; dark red: in-procedure QFR >0.80 and core laboratory QFR ≤0.80. QFR: quantitative flow ratio
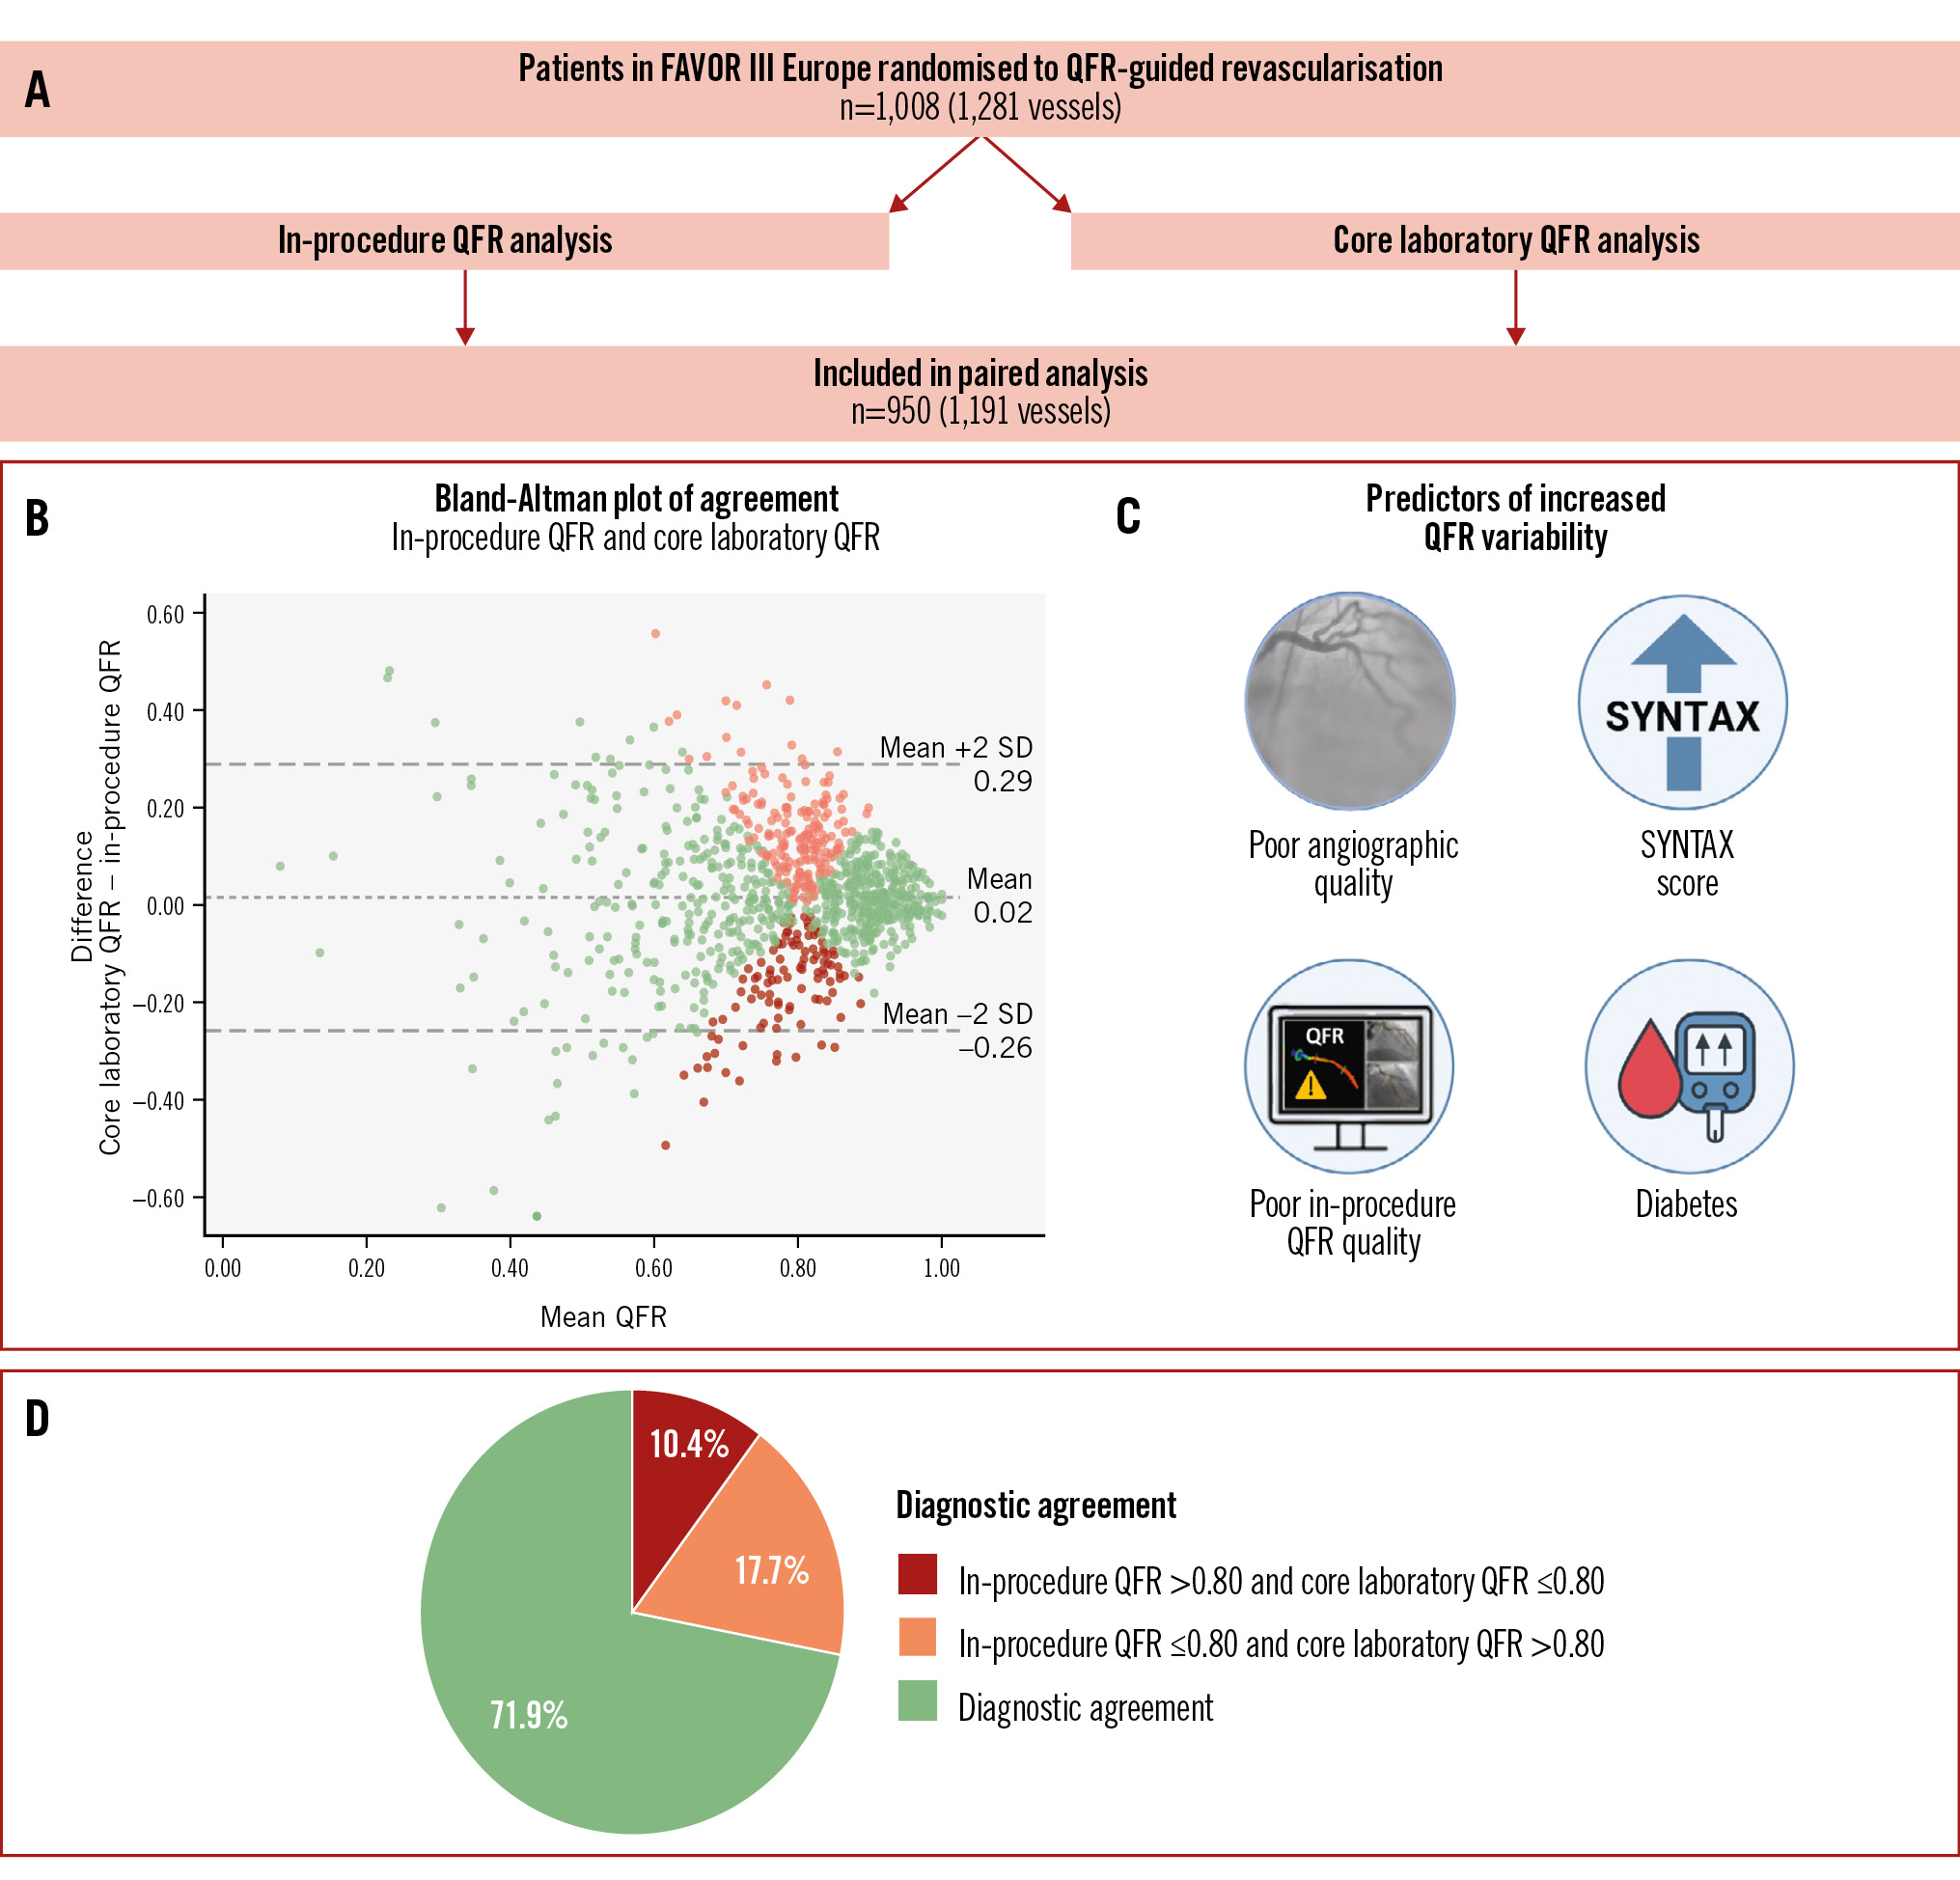
Central illustration. A FAVOR III Europe substudy: the REPEAT-QFR study. A) Patients in the QFR group of the FAVOR III Europe trial were included, and the study vessels were analysed in the core laboratory. A total of 950 patients (1,191 vessels) were included in the paired analyses. The following results are illustrated: (B) Bland-Altman plot with a bias of 0.02 between in-procedure and core laboratory QFR and 95% limits of agreement from –0.26 to 0.29. Vessels showing diagnostic agreement between in-procedure and core laboratory QFR are marked in green, while vessels showing disagreement are marked in red: pale red: in-procedure QFR ≤0.80 and core laboratory QFR >0.80; dark red: in-procedure QFR >0.80 and core laboratory QFR ≤0.80. Darker areas indicate higher point density. C) Significant predictors of increased QFR variability were the presence of diabetes, poor angiographic quality, poor in-procedure QFR analysis quality, and a higher SYNTAX score. D) The diagnostic agreement between in-procedure and core laboratory QFR was 71.9%. Lesions which were functionally significant in the procedure but not in the core laboratory amounted to 17.7% of all lesions, while 10.4% of lesions were significant in the core laboratory but not in the procedure. The Central illustration was created with Biorender.com. QFR: quantitative flow ratio; SD: standard deviation
Predictors of variability
The median numerical difference between in-procedure and core laboratory QFR was 0.07 (IQR 0.03-0.13). Table 3 depicts the univariable and multivariable predictors of a numerical QFR difference>0.07 between the in-procedure and core laboratory analyses.
A low image quality score, a low in-procedure QFR analysis quality score, a higher SYNTAX score, and diabetes were independent predictors of increased variability.
Table 3. Predictors of variability.
| Univariable predictors of absolute difference >0.07 (median) between site and core laboratory QFR analyses | Multivariable analysis | ||
|---|---|---|---|
| p-value | Odds ratio | p-value | |
| Diabetes (no diabetes as reference) | 0.03 | 1.31 | 0.06 |
| Anatomical SYNTAX score (per unit) | <0.001 | 1.05 | <0.001 |
| Angiographic image quality (per unit) | 0.01 | 0.83 | 0.04 |
| Quality of in-procedure QFR analysis (per unit) | 0.01 | 0.86 | 0.04 |
| The following variables were tested in univariable models and included in the multivariable model if they were statistically significant: age, clinical presentation at baseline (chronic or acute coronary syndrome), BMI, diabetes, enrolling site, enrolling country, lesion location, image quality, number of suitable runs for core laboratory analysis (0, 1, or ≥2), recommended projection angles acquired (0, 1, or 2), and overall quality score for in-procedure QFR analysis. BMI: body mass index; QFR: quantitative flow ratio | |||
Core laboratory interobserver agreement
Of the random sample of 100 vessels in 97 patients, 98 vessels in 95 patients were analysable in the core laboratory and were included in the core laboratory interobserver analysis. Baseline characteristics for the random sample used to assess core laboratory interobserver agreement are available in Supplementary Table 2. The Spearman’s rank correlation coefficient (rho) for agreement between the first and second core laboratory QFR was 0.81 (Supplementary Figure 9A). The mean difference (bias) between the first and second core laboratory QFR was –0.03±0.08, and the 95% limits of agreement were –0.19 to 0.14 (Supplementary Figure 9B).
In-procedure QFR analysis quality and MACE
Quality scoring was possible for 1,133 of the 1,272 in-procedure QFR analyses (89.1%). The quality ratings are presented in Figure 3. Almost two-thirds of in-procedure analyses received an overall score of “good” or “very good”. The 8.4% of patients with at least one QFR analysis with an overall quality score of “very poor” or “poor” showed a trend towards higher MACE rates (Figure 4).
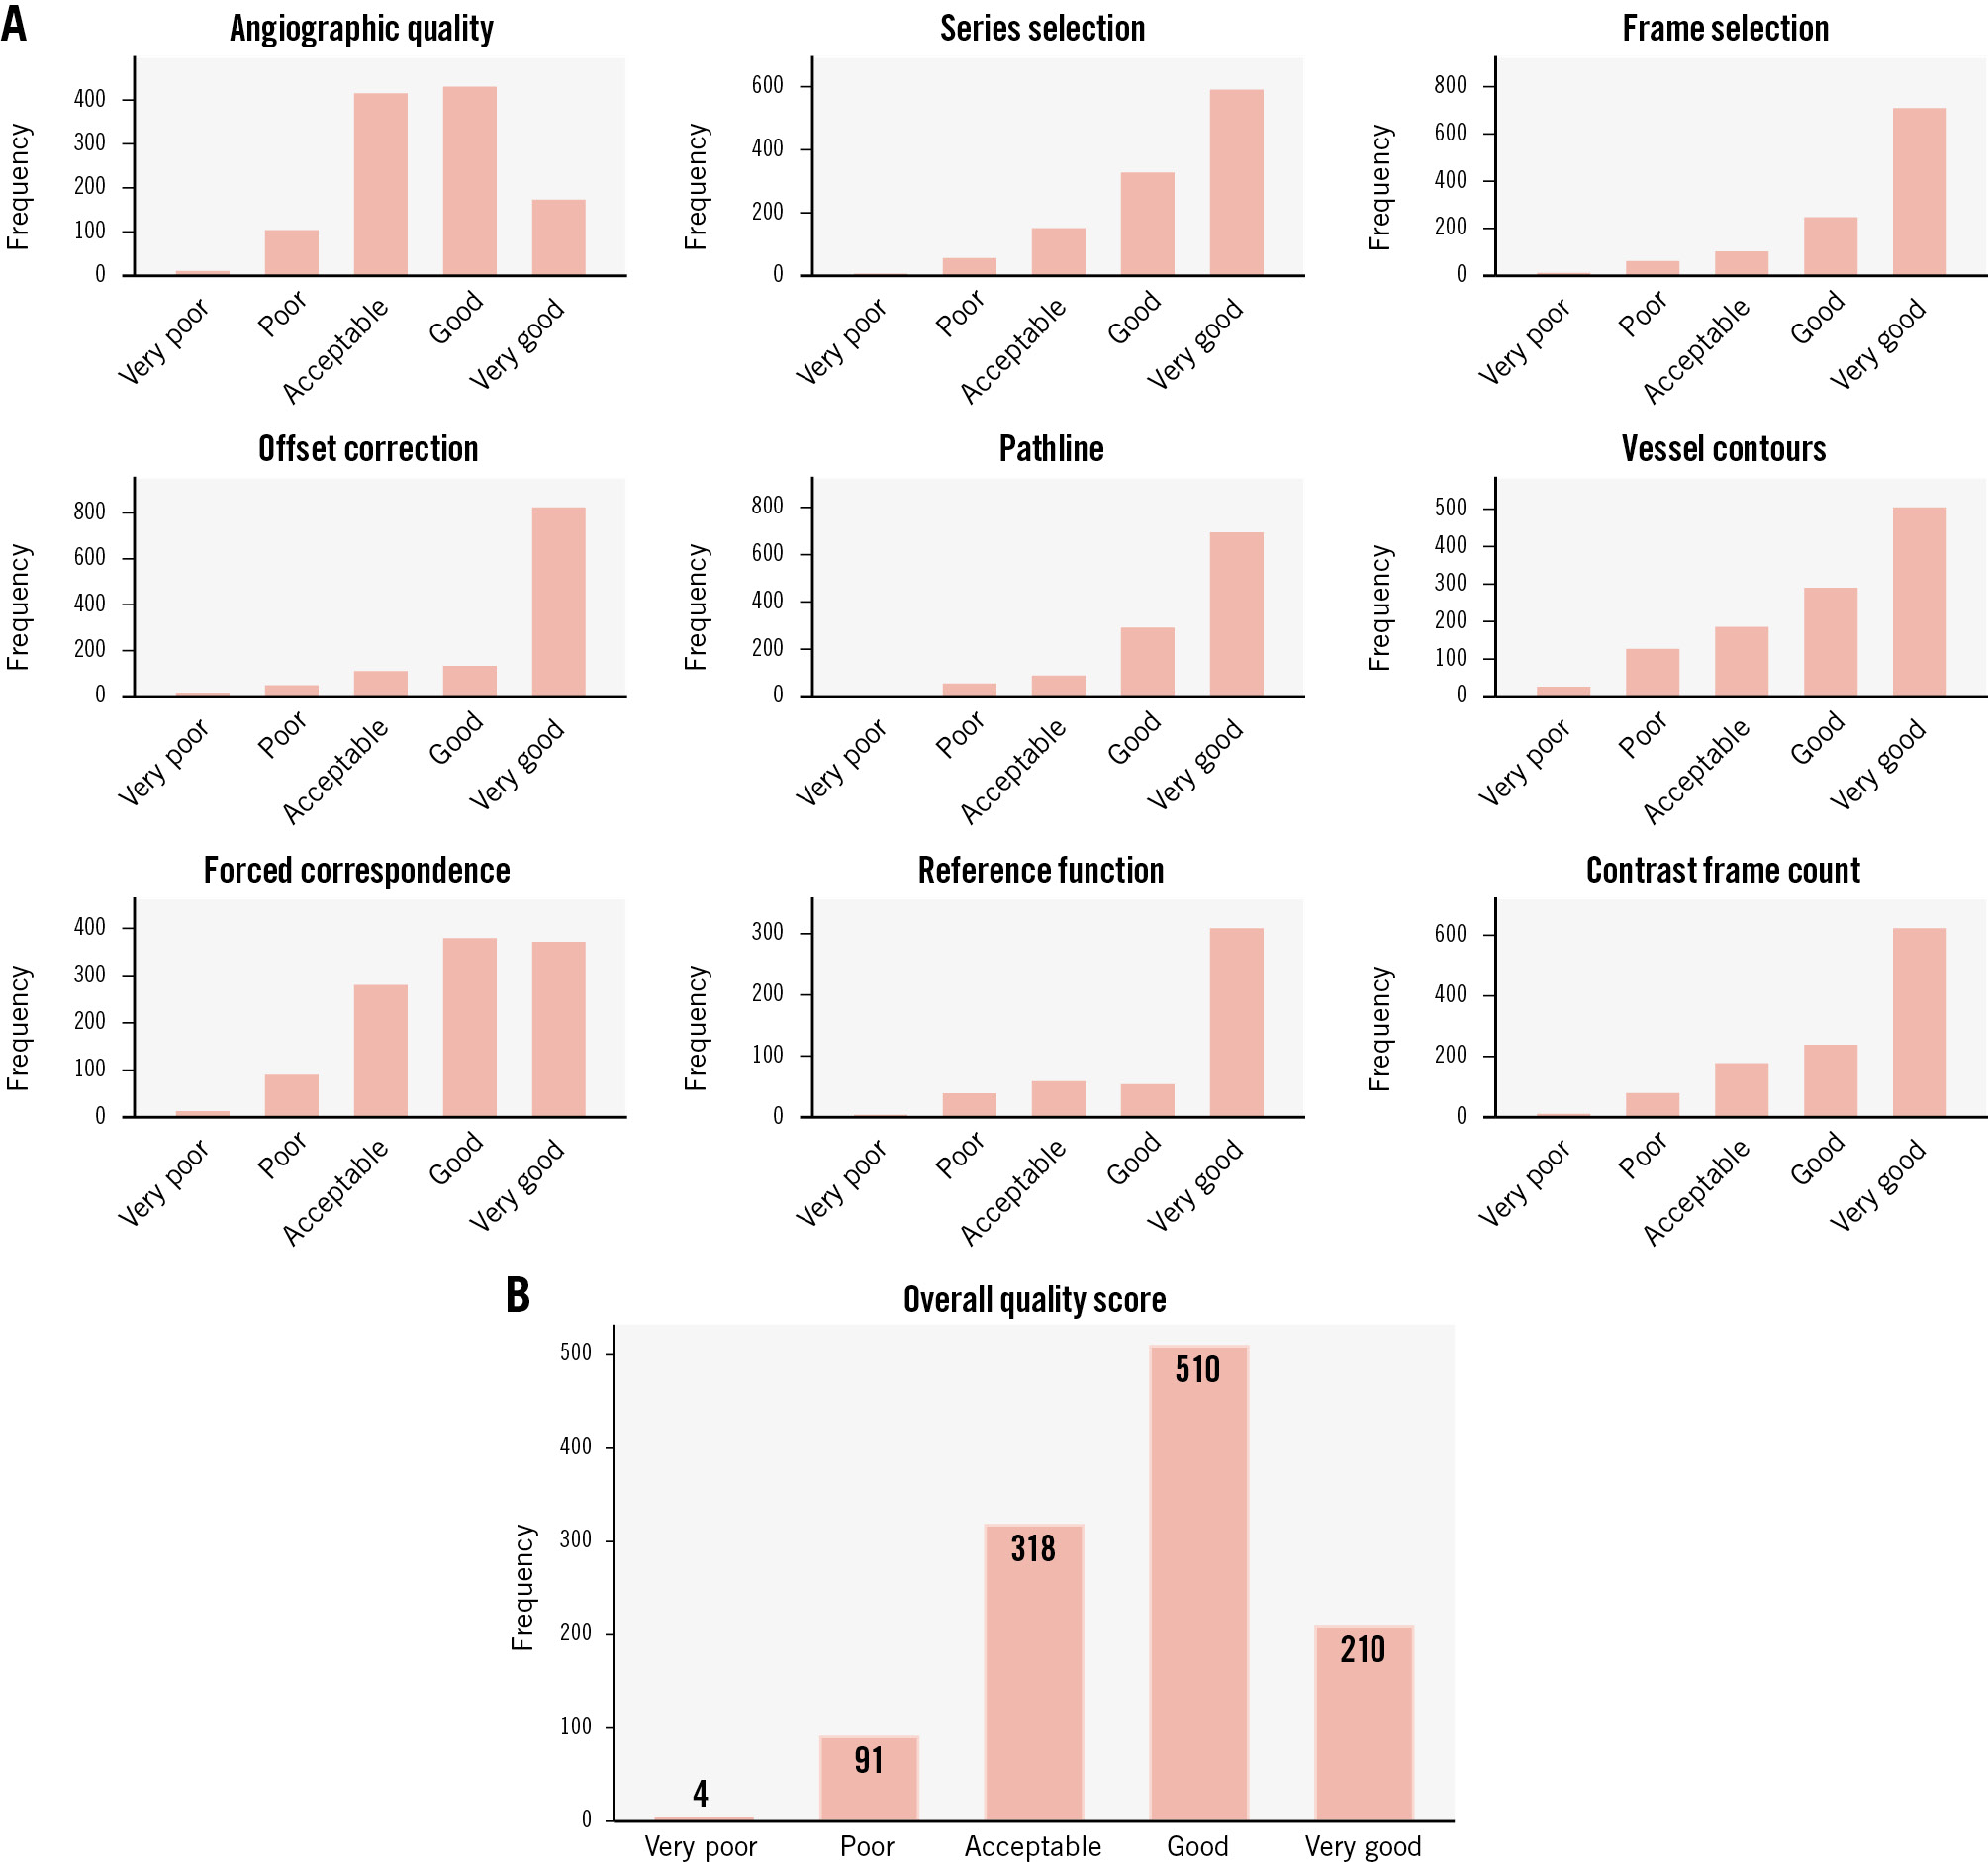
Figure 3. Overall quality score of in-procedure QFR. Lesion-level analysis. The bar graphs display the distribution of quality scores for each step of the QFR analysis (A) and the overall quality score (B) as assigned by the core laboratory during the continuous feedback of QFR analyses in FAVOR III Europe. The quality scores were based on adherence to the standard operating procedure. Quality scores are presented as lesion-level frequencies. A total of 1,133 study lesions (89.1%) had QFR analysis source data available; these were evaluated by the core laboratory during the enrolment period of the FAVOR III Europe trial. Quality metrics were scored as follows: 1 (very poor); 2 (poor); 3 (acceptable); 4 (good); 5 (very good). QFR: quantitative flow ratio
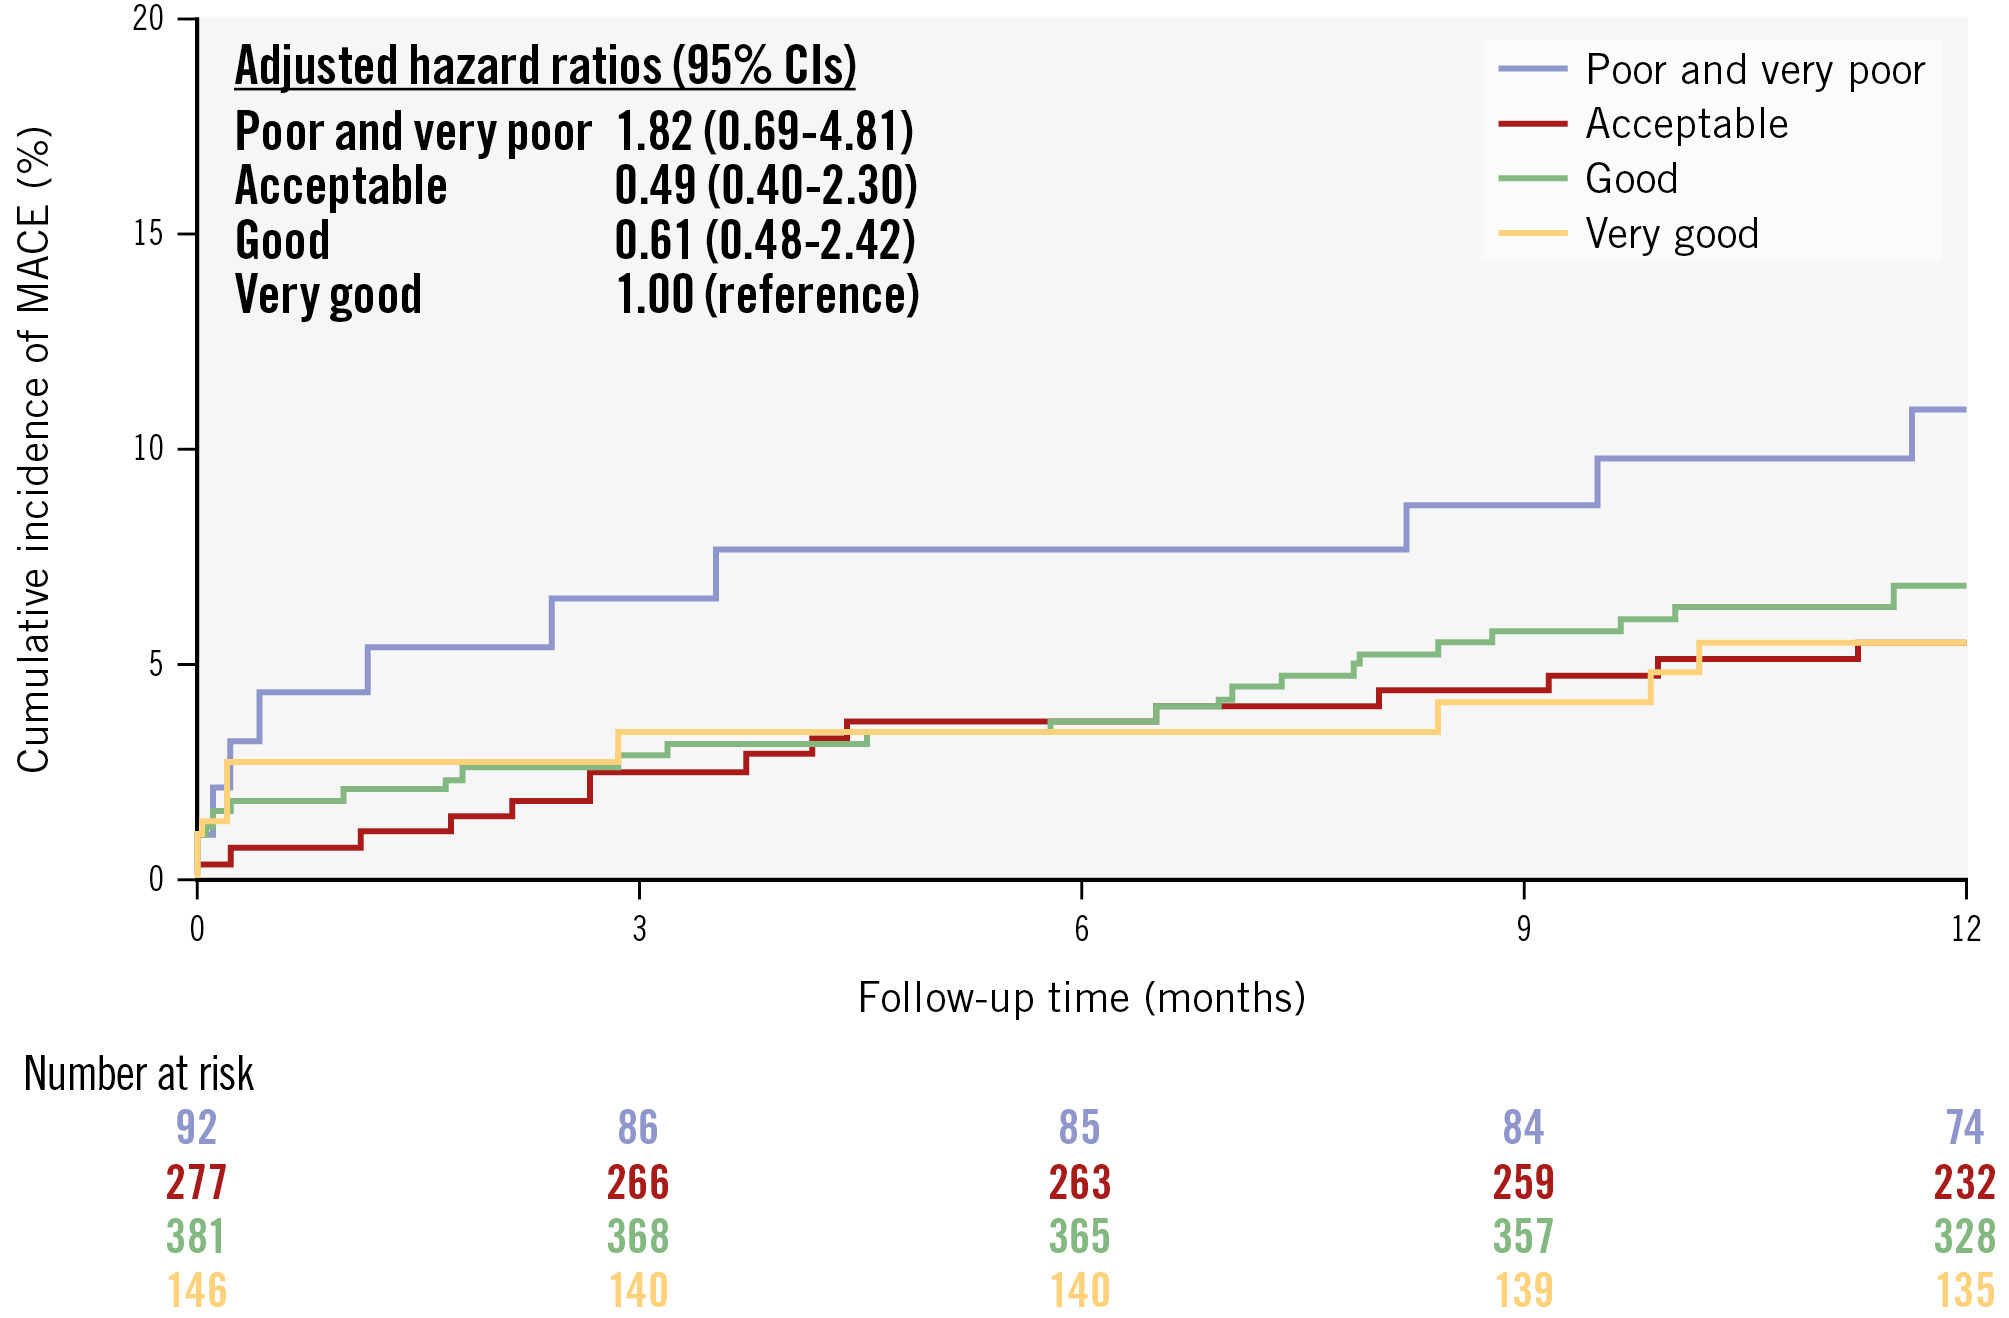
Figure 4. Cumulative incidence of MACE stratified by in-procedure QFR analysis quality. A total of 1,133 study lesions in 896 patients (88.9%) had QFR source data available, allowing for core laboratory evaluation during the enrolment period of the FAVOR III Europe trial. An overall quality score was assigned to each QFR analysis on a scale from 1 (very poor) to 5 (very good). For each patient, the lowest QFR analysis quality score was used in the analysis. The rate of 1-year MACE – including all-cause death, myocardial infarction, and unplanned revascularisation – was stratified by in-procedure QFR analysis quality. Due to the low number of patients in the two lowest quality categories, these were combined into a single group, which was assigned as the reference group. The hazard ratio was adjusted for angiographic image quality, SYNTAX score, and diabetes. The adjusted hazard ratios are reported together with a 95% confidence interval (CI). MACE: major adverse cardiac events; QFR: quantitative flow ratio
Discussion
This predefined substudy of the FAVOR III Europe trial had the following main findings: (1) a high proportion of cases had one or more major limitations in angiographic quality; (2) the correlation between in-procedure and core laboratory QFR was modest with a diagnostic agreement of 72%; (3) the variability of in-procedure versus core laboratory QFR increased with low in-procedure QFR analysis quality, poor angiographic quality, higher SYNTAX score, and with the presence of diabetes; and (4) cases with poor or very poor in-procedure QFR analysis quality showed a trend towards higher rates of MACE.
Evaluation of QFR
Despite prospective validation studies1315 and large clinical outcome registries2223 with promising results, the randomised FAVOR III Europe trial could not confirm the clinical equivalence between QFR and FFR19. The worse-than-expected clinical outcomes following a QFR-guided diagnostic strategy could have multiple explanations. In the FAVOR III Europe trial, QFR analysis was performed in-procedure by multiple QFR observers across 34 sites. Despite mandatory training of all QFR observers and continuous feedback, a substantial proportion of QFR analyses did not follow the SOP, potentially impacting outcomes. Most outcome studies on QFR have been non-randomised, retrospective studies with post hoc core laboratory QFR analysis of selected cases not reflecting the variation in quality of acquisitions in real-world clinical practice242526. Moreover, in the prospective studies with paired assessment, QFR and FFR were measured simultaneously with some risk of unblinding of the QFR observer to either the FFR value or treatment decisions1527.
QFR reproducibility
The carefully blinded QREP study showed that low reproducibility of QFR was an important limitation in QFR version 2.0, although the effect on outcomes was unknown20. Several steps in the QFR analysis require user interaction. The FAVOR III Europe investigators aimed to minimise reproducibility issues by ensuring a high level of site observer training and promoting adherence to the SOP through continuous direct feedback on in-procedure QFR analyses. However, our findings indicate usability problems with QFR performed in-procedure.
A major difference between core laboratory and in-procedure QFR analyses was the significantly higher number of contour correction points applied in the core laboratory analyses. During study procedures, QFR observers may have been under time pressure to complete the analysis, with both the patient and catheterisation laboratory staff awaiting treatment decisions. By contrast, the SOP emphasises the importance of accurate vessel contouring, and without time constraints in the core laboratory, correction points could be applied as needed.
The challenges of reproducibility stem not only from the in-procedure QFR analysis quality, but also from suboptimal angiographic image quality, both of which are predictors for greater differences between in-procedure and core laboratory QFR measurements. Although the treating physicians received instructions on optimal angiographic acquisitions, many angiographies did not meet the requirements for a reliable QFR analysis. Despite aiming to perform core laboratory QFR analysis on all study vessels, 21 vessels were excluded because of severe angiographic limitations precluding reliable QFR analysis. To ensure that our validation reflected the actual application of QFR in the trial, these analyses were performed post hoc and included in an exploratory analysis, yielding results consistent with the main paired analysis (Supplementary Appendix 6, Supplementary Figure 7, Supplementary Figure 8).
With suboptimal image quality, the difficulty of the analysis increases and hence usability decreases. Despite a comprehensive SOP, critical steps in QFR analysis rely partly on subjective interpretation and judgement. This is reflected in the considerable variation found in our core laboratory interobserver analysis (Supplementary Figure 9), which was performed by observers within the same core laboratory, with a highly aligned analysis approach including close adherence to the SOP.
The cause for the increased variability of QFR in diabetic patients is largely unknown but may be explained by the slightly lower QFR values observed in this subgroup, as both the present substudy and previous research have reported greater variability of QFR at lower values1620. Previous studies have shown a decreased correlation between QFR and FFR in patients with microvascular disease, leading to a lower positive predictive value and possibly explaining the lower QFR values in diabetic patients2829.
Higher SYNTAX score values indicate more complex coronary artery disease, involving both multivessel and multilesion pathologies. With increasing lesion complexity, the QFR analysis requires more user interaction. The more demanding and user-dependent QFR analysis in complex lesions appears to reduce interobserver reproducibility. In the paired analysis, using the largest absolute difference per patient increases the likelihood that patients with multiple study lesions – who typically also have higher SYNTAX scores – will exhibit at least one vessel with a QFR discrepancy exceeding the median. This may add to the observed inverse association between SYNTAX score and QFR reproducibility.
The results of our paired analysis suggest that, when applied in clinical practice, the reliability of QFR is limited by suboptimal angiographic image acquisition and modest reproducibility. Such challenges are expected to increase with wide-scale adoption outside the controlled setting of a randomised trial.
Distribution of in-procedure and core laboratory QFR
We cannot determine whether in-procedure QFR or core laboratory QFR was in better agreement with a true wire-based FFR. However, the median core laboratory QFR was higher than the in-procedure QFR and more closely resembled the FFR distribution observed in the FAVOR III Europe trial19. Overall, the proportion of functionally significant vessels was 48% according to in-procedure QFR and 41% according to core laboratory QFR, of patients included in the paired analysis, while only 38% of vessels were functionally significant in the FAVOR III Europe FFR group19. The rate of excess revascularisation with core laboratory QFR as compared with FFR would have been 8% as opposed to the 21% observed in the FAVOR III Europe trial. Given the potential scale of use of QFR, an 8% higher revascularisation rate is likely considerable both in terms of patient safety and cost efficacy. Core laboratory QFR analyses of the FAVOR III Europe FFR group are currently ongoing to provide a direct comparison of core laboratory QFR and FFR.
In the main trial, in-procedure QFR led to a significant increase in LCx revascularisation with QFR as compared with FFR19. This vessel-specific difference for LCx would have been smaller with core laboratory QFR, yet still present, as 25% of LCx lesions were found to require revascularisation according to core laboratory QFR as compared with 15% in the FFR group19. A potential explanation for the higher proportion of significant LCx lesions with in-procedure QFR compared with core laboratory QFR is the bias introduced by visual estimation of stenosis severity. Functional significance is often overestimated by visual assessment of LCx lesions30. In the in-procedure setting, awareness that the QFR results would have clinical implications might prompt analysis adjustments towards lower QFR values. The difference between core laboratory QFR and FFR may rather reflect vessel-specific anatomical and haemodynamic factors3132 not fully accounted for in the QFR algorithm.
As the present substudy was conducted subsequent to the FAVOR III Europe findings, a potential bias of core laboratory QFR observers towards a reduced rate of functional significant lesions cannot be excluded. However, with careful blinding and instructions on strict adherence to the SOP, it appears less likely. The in-procedure QFR observers may have been influenced by both clinical information about the patient and their own visual estimation of stenosis severity, knowing that the QFR results would have clinical implications. In contrast, the core laboratory QFR observers may have been less prone to adjusting the analyses in either direction, given the absence of clinical consequence. This may have contributed to the observed difference in median in-procedure and core laboratory QFR.
Correlation between QFR analysis quality and clinical outcome
The observed association between the quality of QFR analysis and clinical outcome might point towards the importance of improving usability and reproducibility of QFR. In addition to the training in QFR analysis protocol, training in performing optimal angiographic acquisitions and in detecting cases not suitable for QFR appears to be of particular importance. Whether better quality QFR analysis would have been obtained with more training remains unknown. Furthermore, a causal relationship cannot be established, and we cannot rule out residual confounding.
The future of angiography-based physiology
Despite being implemented in the ESC guidelines, the evaluated version of QFR (version 2.0) seems to have several limitations when implemented in clinical practice. The reproducibility is modest, and good angiographic image quality is crucial. The implementation of guidance or warnings from the software in cases with poor angiographic quality could be a valuable addition to the software. Likewise, further refinement of the automatic reference function, including error recognition and automated correction, could reduce the need for manual reference function adjustments, which were frequently required in the present study for both in-procedure and core laboratory analyses (Table 2), with a potentially substantial impact on QFR results.
Newer versions with a higher degree of automation are now available, potentially improving reproducibility, although prospective in-procedure validation is pending.
Other angiography-based methods for functional lesion evaluation are commercially available10111233 and some are being investigated in large randomised controlled trials (ClinicalTrials.gov: NCT05893498, NCT04931771, and NCT04575207). These methods are based on different algorithms implemented in different software solutions, and a class effect appears unlikely based on a blinded comparison of five different methods for angiography-based estimation of FFR. Ninomiya and colleagues found similar correlations with FFR across the different methods, yet with lower areas under the curves (AUCs) than previously reported (AUC 0.73-0.75), and scatterplots indicate major point discrepancies between methods11. In light of the negative results of the FAVOR III Europe trial, the necessity of adequately powered randomised trials was emphasised, and they should be a requirement for any method before achieving society recommendations for clinical use. The findings of the present substudy further call into question the strong ESC recommendations for QFR1, which was based on a single randomised controlled trial in a non-European population and with a non-functional comparator18.
The identified limitations to reproducibility – and thus potentially to a safe widespread clinical adoption – may extend to any angiography-based computation method. The applicability of results from observational studies that exclude cases with suboptimal angiographic images, which frequently contribute to discrepancies with FFR3435, is questionable, as such studies do not reflect the true performance of the method in clinical practice.
Limitations
The core laboratory QFR analyses were performed by two different observers. Efforts were made to minimise the differences by implementing similar extensive training and emphasising strong adherence to the SOP. Still, interobserver variability is expected to be comparable to the intra-core laboratory variability analysis because of the inherent uncertainties in interpretation causing variation in critical steps of the analysis.
To preserve blinding, angiographic runs with visible wires were excluded. This might have inadvertently removed runs that could have been used for QFR analyses, potentially complicating or preventing the execution of the analysis.
Conclusions
In FAVOR III Europe, the agreement between in-procedure and core laboratory QFR was modest and diagnostic agreement was low. Measurement variability increased with reduced angiographic quality, poor in-procedure QFR analysis quality, and more advanced coronary artery disease.
Impact on daily practice
The poor clinical outcomes and modest reproducibility of in-procedure quantitative flow ratio (QFR) raise concerns about its reliability in routine clinical practice. With a modest diagnostic accuracy of 72% and a bias to overestimate lesion severity, the use of QFR results in inappropriate stenting. Our findings underscore the requirements for optimal angiographic quality and good QFR analysis quality, which both appear difficult to consistently obtain in clinical practice. The results indicate that the usability, reproducibility, and precision of QFR needs to be improved. This may challenge the early implementation of QFR in the European Society of Cardiology guidelines. In real-world clinical practice, accuracy and reproducibility issues are unlikely to be fully addressed by training alone. This underscores the need for cautious implementation of QFR version 2.0 and a critical appraisal of its limitations.
Acknowledgements
We thank physicians and hospital staff for enrolling patients in the FAVOR III Europe trial, and patients for accepting enrolment. Furthermore, we thank our data managers, Martin Amadeus Rahbek and Jakob Hjort, Aarhus University, Denmark, for their important contributions.
Conflict of interest statement
S.K. Kristensen: institutional research grant and free licences for QAngio XA-3D QFR solution (v2.0) for research purposes from Medis Medical Imaging. M.B. Holm: institutional research grant and free licences for QAngio XA-3D QFR solution (v2.0) for research purposes from Medis Medical Imaging. T. Råmunddal: consultant and proctoring honoraria from Boston Scientific, EPS Vascular, and Cardirad. V. Guiducci: free licences for the QAngio XA-3D QFR solution for research purposes from Medis Medical Imaging. B.E. Stähli: supported by the H.H. Sheikh Khalifa bin Hamad Al-Thani Research Programme; has received research grants to the institution from Boston Scientific, the B. Braun Foundation, the German Center for Cardiovascular Research (DZHK), the German Heart Research Foundation, Edwards Lifesciences, the Iten-Kohaut Foundation, and the OPO Foundation; and has received consulting and speaker fees from Abbott, Abiomed, and Boston Scientific. A. Erriquez: educational grants from Philips, Abbott, and MLCTO; support for course participation from CoreAalst; and speaker fees from Eukon and Medis Medical Imaging. L. Koltowski: speaker fees from Abbott and Philips. J. Escaned: personal fees as speaker and/or advisory board member from Abbott, Boston Scientific, Medis Medical Imaging, and Philips. E.H. Christiansen: institutional research grants from Abbott, Biosensors, Meril Life Sciences, and Medis Medical Imaging; speaker fees from Abbott and EPS Vascular. N.R. Holm: employment at Novo Nordisk; institutional research grants from Abbott, B. Braun, Biosensors, Boston Scientific, and Medis Medical Imaging; and speaker fees from Abbott and EPS. B.K. Andersen: institutional research grant and free licences for QAngio XA-3D QFR solution (v2.0) for research purposes from Medis Medical Imaging. The other authors have no conflicts of interest to declare.
Supplementary data
To read the full content of this article, please download the PDF.