Cory:
Unlock Your AI Assistant Now!
Abstract
BACKGROUND: Thin-cap fibroatheroma (TCFA) lesions are associated with a high risk of future major adverse cardiovascular events. However, the impact of other optical coherence tomography-detected vulnerability features (OCT-VFs) and their interplay with TCFA in predicting adverse events remains unknown.
AIMS: We aimed to evaluate the individual as well as the combined prognostic impact of OCT-VFs in predicting the incidence of the lesion-oriented composite endpoint (LOCE) in non-ischaemic lesions in patients with diabetes mellitus (DM).
METHODS: COMBINE OCT-FFR (ClinicalTrials.gov: NCT02989740) was a prospective, double-blind, international, natural history study that included DM patients with ≥1 non-culprit lesions with a fractional flow reserve>0.80 undergoing systematic OCT assessment. OCT-VFs included the following: TCFA, reduced minimal lumen area (r-MLA), healed plaque (HP), and complicated plaque (CP). The primary endpoint, LOCE − a composite of cardiac mortality, target vessel myocardial infarction, or clinically driven target lesion revascularisation up to 5 years − was analysed according to the presence of these OCT-VFs, both individually and in combination.
RESULTS: TCFA, r-MLA, HP and CP were identified in 98 (25.3%), 190 (49.0%), 87 (22.4%), and 116 (29.9%) patients, respectively. The primary endpoint rate increased progressively from 6.3% to 55.6% (hazard ratio 15.2, 95% confidence interval: 4.53-51.0; p<0.001) in patients without OCT-VFs as compared to patients with concomitant HP, r-MLA, CP, and TCFA. The coexistence of TCFA with other OCT-VFs resulted in an increased risk of the LOCE at 5 years.
CONCLUSIONS: In DM patients with non-ischaemic lesions, TCFA was the strongest predictor of future LOCE events. However, lesions that present additional OCT-VFs are associated with a higher risk of adverse events than OCT-detected TCFA alone. Further randomised studies are warranted to confirm these findings and their potential clinical implications.
Over the last few decades, notable advances have been made in understanding the mechanisms underlying the progression of atherosclerotic plaques and their role in cardiovascular events. Although the management of coronary artery disease has traditionally been focused on treating obstructive coronary lesions, the concept of vulnerable plaque (VP) has emerged as an appealing paradigm, potentially leading to enhanced clinical outcomes but still requiring more robust clinical evidence1234. Progress in both non-invasive and invasive imaging techniques has contributed to a thorough assessment and morphological characterisation of coronary plaques. Prior observational studies have suggested that certain morphological features of atherosclerotic plaques, including reduced minimal lumen area (r-MLA), large plaque volume, the presence of thin-cap fibroatheroma (TCFA), macrophage infiltration, cholesterol clefts, plaque erosion, and healed plaques (HP), might be associated with plaque vulnerability, which is directly linked to cardiovascular events in patients with non-obstructive coronary lesions1234.
Patients with diabetes mellitus (DM) and non-obstructive coronary lesions constitute a particularly high-risk population for recurrent cardiovascular events, despite optimal medical treatment and the absence of myocardial ischaemia. COMBINE OCT-FFR represents the first prospective, natural history trial demonstrating that atherosclerotic plaque morphology (as assessed by optical coherence tomography [OCT]), remains a robust predictor of major adverse cardiovascular events (MACE) in patients with angiographically intermediate and non-ischaemic lesions (fractional flow reserve [FFR]>0.80)56. While the impact of TCFA on MACE has been well established in many studies278910, the influence of additional OCT-detected features, such as large plaque volume, r-MLA, macrophage infiltration, cholesterol clefts and HP, as well as complicated plaques (CP; e.g., plaque erosions or ruptures or calcified nodules associated with intracoronary thrombus), and their potential interplay with TCFA in predicting recurrent cardiovascular events, remain unknown. Therefore, the present study aimed (i) to assess the impact of specific OCT-defined plaque features potentially associated with increased vulnerability individually and (ii) to determine the long-term (5-year) prognosis of the presence of combined high-risk morphological characteristics of vulnerability in patients with DM and non-obstructive coronary lesions.
Methods
STUDY DESIGN AND PATIENT SELECTION
The COMBINE OCT-FFR trial (ClinicalTrials.gov: NCT02989740) is a prospective, international, natural history study that was conducted at 14 centres in 7 countries from March 2015 to December 2018. The rationale, design and main results of the COMBINE OCT-FFR study have been previously reported511. In brief, the trial integrated physiological (using FFR) and morphological (using OCT) assessment of non-culprit coronary lesions to better predict adverse events in patients with DM. Therefore, the study included patients with DM undergoing coronary angiography for any indication (stable angina or acute coronary syndrome [ACS]) who had at least 1 de novo native coronary lesion with a diameter stenosis ranging from 40% to 80% (visually estimated). In patients presenting with ACS, the culprit lesion was revascularised first. In all remaining non-culprit target lesions, FFR assessment was performed. FFR-positive lesions (FFR ≤0.80) underwent percutaneous revascularisation, whereas in patients with FFR-negative lesions (FFR>0.80), systematic OCT assessment was subsequently performed, and they were further treated medically in concordance with current guideline recommendations. Patients with FFR-negative lesions that underwent OCT morphology evaluation represent the current study population. The OCT core lab findings were blinded to patients, operators, and the team that performed the clinical follow-up. The study was approved by the national regulatory agencies and the institutional review boards of all the participating centres. All patients gave informed consent to participate.
For the present analysis, all patients with FFR-negative non-culprit lesions that underwent OCT assessment were studied. According to the OCT central core lab analysis, this patient population was further divided into groups according to specific morphological high-risk plaque features associated with increased vulnerability, based on previous studies23121314, and compared to patients carrying lesions without any of these morphological features. These high-risk, OCT-assessed, morphological characteristics included the following: TCFA, reduced minimal lumen area (r-MLA), low lumen volume (l-LV), CP, HP, neovascularisation, macrophage infiltration and cholesterol clefts.
OCT ANALYSIS
Detailed information on OCT definitions and analysis methodology has been previously described511. The OCT analysis was performed in a central core lab, based on the consensus document on the standards for acquisition, measurement, and reporting of OCT studies reported by the International Working Group for Intravascular OCT Standardization and Validation15. In the OCT analysis, serial cross-sectional images of the vessel were comprehensively assessed in each frame of the OCT pullback, starting at 5 mm distal to and ending 5 mm proximal to the OCT-defined lesion border. During the analysis, the lesion borders were defined as the frames exhibiting the healthiest vessel tissue proximally and distally to the MLA. Ideally, these frames should contain no more than 50% plaque in their circumference and be free from stenosis. If the identification of such a frame was not feasible, the lesion border was defined as the frame adjacent to any side branch limiting the lesion or the ostium of the vessel. Signal-rich homogeneous plaques were classified as fibrous plaques, signal-poor regions with diffuse borders as lipidic plaques and, finally, signal-poor regions with well-defined borders as calcified plaques. OCT analysis was performed by two independent investigators (B. Berta and T. Roleder), and a third (E. Kedhi) supervised all the analyses. TCFA was defined as any lipid-rich plaque with the thinnest part of the atheroma cap ≤65 μm and a lipid arc of >90º. HP was characterised by a heterogeneous, layered morphology with multiple high and low signal-rich strata suggestive of an old healing process. CP was defined as plaque erosion or rupture, or a calcified nodule associated with intracoronary thrombus16. Macrophage infiltration was defined as signal-rich, distinct, or confluent punctate regions that exceed the intensity of the background. Cholesterol clefts were defined as thin, linear regions of high intensity, usually associated with a fibrous cap or necrotic core. Neovascularisation was defined as sharply delineated signal-poor voids that can usually be followed in adjacent frames. All the analyses were performed using the CAAS IntraVascular 2.0 software (Pie Medical Imaging). A detailed list of OCT analysis definitions is shown in Supplementary Table 1.
ENDPOINTS AND DEFINITIONS
The primary endpoint was a target lesion-oriented composite endpoint (LOCE), defined as cardiac death, target vessel-related myocardial infarction (TVMI) or clinically driven target lesion revascularisation (CD-TLR) at 5 years. Cardiac death that could not clearly be related to events originating from non-target lesions were considered to be related to the target lesion. A detailed list of endpoints and definitions has been reported previously and is provided in Supplementary Table 1-Supplementary Table 4511. All adverse events were adjudicated by an independent clinical events committee, whose members were blinded to the OCT results.
STATISTICAL ANALYSIS
Continuous variables are expressed as median [interquartile range] and categorical variables as a number (%). Group comparisons were performed using the Student’s t-test or Wilcoxon rank-sum test for continuous variables and using the χ2 or Fisher’s exact test for categorical variables. OCT-defined predictor variables, considered a priori as potential contributors to an increased incidence of recurrent events, were chosen based on existing evidence. The initially considered candidate variables comprised TCFA, r-MLA, l-LV, macrophage infiltration, cholesterol clefts, neovascularisation, HP and CP. These variables were integrated into a preliminary model, and a univariate Cox regression analysis was used for the initial selection process. Variables exhibiting a trend towards an increased risk of events at the 5-year follow-up (p-value<0.10) in the bivariate analysis were ultimately used to construct prediction models (Table 1). Consequently, TCFA, r-MLA, HP, and CP were integrated into the risk-scoring model, with points assigned based on their weights derived from Cox regression beta coefficients. The proportional hazards assumption was tested by assessing log-minus-log survival plots and scaled Schoenfeld residuals. Receiver-operating characteristic (ROC) curve analysis was performed to identify the optimal cutoff value of continuous variables for the prediction of LOCE events using the Youden index. Two-sided 95% confidence intervals (CIs) for proportions of events were calculated using the Wilson score method. Hazard ratios (HRs) were calculated using Cox regression and presented with 2-sided 95% CIs. Two-sided p-values were presented for informative hypothesis generation and were not adjusted for multiple comparisons. Data analyses were performed with the use of R version 4.2.3 (R Foundation for Statistical Computing).
Table 1. Univariate Cox regression analysis for variable selection.
| Hazard ratio (95% CI) | Unadjusted p-value | |
|---|---|---|
| TCFA | 3.48 (1.86-6.53) | <0.001 |
| MLA, mm2*† | 0.73 (0.52-0.98) | 0.035 |
| Lumen volume, mm3*‡ | 0.99 (0.99-1.00) | 0.646 |
| Complicated plaque | 1.95 (1.03-3.67) | 0.039 |
| Healed plaque | 2.15 (1.12-4.15) | 0.022 |
| Cholesterol clefts | 1.28 (0.67-2.44) | 0.453 |
| Macrophage infiltration | 1.48 (0.78-2.82) | 0.232 |
| Neovascularisation | 0.99 (0.49-2.00) | 0.984 |
| r-MLA (≤2.50 mm2) | 1.87 (0.97-3.60) | 0.061 |
| Low lumen volume (<173.30 mm3) |
1.41 (0.63-3.21) | 0.403 |
| *As continuous variables. †Per 1 mm2 increase. ‡Per 1 mm3 increase. CI: confidence interval; MLA: minimal lumen area; r-MLA: reduced MLA; TCFA: thin-cap fibroatheroma | ||
Results
A total of 550 patients were enrolled in the COMBINE OCT-FFR trial, out of whom 388 patients (70.5%), with at least 1 FFR-negative non-culprit lesion that underwent OCT assessment, were deemed eligible for the present analysis (mean age: 67.5±9 years, 63% male). The univariate Cox analysis to identify OCT-VFs associated with events is presented in Table 1. Macrophage infiltration, cholesterol clefts and l-LV did not exhibit an association with events. In contrast, TCFA, r-MLA, HP, and CP showed a trend towards a higher likelihood of events at 5 years. The flowchart of the study population and the study design are shown in Figure 1A. In 96 patients, no high-risk OCT-VFs were identified, whereas TCFA, r-MLA, HP and CP were detected in 98 (25.3%), 190 (49.0%), 87 (22.4%), and 116 (29.9%) patients, respectively. The overlap between different OCT-VFs is depicted in Figure 1B. The optimal cutoff for MLA in predicting the primary endpoint, based on ROC curve analyses, was ≤2.5 mm2 (area under the curve [AUC]: 0.63; 95% CI: 0.54-0.71) (Supplementary Figure 1).
The main baseline demographic and clinical characteristics of patients presenting lesions with OCT-VFs, as well as patients without any OCT-VFs, are summarised in Table 2. The distribution of underlying comorbidities and baseline medical treatment was similar between groups, except for a lower median body mass index (BMI) and higher rates of previous percutaneous coronary intervention (PCI) in patients presenting lesion with r-MLA and CP, respectively, compared to patients without any OCT-VFs. While there was no difference in the lipidic profile of patients with or without OCT-VFs, the rate of patients receiving statins at baseline was significantly higher in those without. Clinical presentation was comparable across the groups, with most patients being admitted for stable coronary artery disease. However, variations in vessel distribution were observed, with less frequent involvement of the left anterior descending artery and more frequent involvement of the left circumflex and right coronary artery among patients presenting lesions with OCT-VFs.
Detailed data comparing lesion-level quantitative and qualitative OCT analyses in patients with and without OCT-VFs are presented in Table 3. Overall, lesions presenting with OCT-VFs exhibited a smaller MLA, a longer lesion length, and smaller proximal and distal reference lumen areas when compared to those without OCT-VFs. No significant difference was observed in lesion calcification among the groups. However, lesions without any OCT-VFs less frequently showed cholesterol clefts, neovascularisation, and macrophage infiltration, compared to those with OCT-VFs (Table 3).
Long-term clinical follow-up was completed in 386 (99%) patients. The primary endpoint (LOCE) occurred in 21.4% of TCFA patients (HR 3.48, 95% CI: 1.86-6.53; p<0.001), in 13.2% of r-MLA patients (HR 0.73, 95% CI: 0.52-0.98; p<0.035), in 16.1% of HP patients (HR 2.15, 95% CI: 1.12-4.15; p<0.022), and 14.7% of CP patients (HR 1.95, 95% CI: 1.03-3.67; p<0.039). The incidence of the primary endpoint according to the presence of OCT-VFs is illustrated in Figure 2A. The cumulative incidence of LOCE events in patients without any OCT-VFs was 6.3% (95% CI: 2.9-13.0) and increased progressively to 55.6% (95% CI: 26.7-81.1) when more than one OCT-VF was simultaneously present (Central illustration). Table 4 provides details on the primary composite endpoint and its individual components. Patients with lesions showing all 4 OCT-VFs concurrently exhibited a 15.2-fold higher risk (95% CI: 4.53-50.98; p<0.001) of the primary endpoint occurrence than those without any OCT-VFs. Finally, the cumulative incidence of the LOCE with different combinations of OCT-VFs is depicted in Figure 2B. Notably, while TCFA was identified as the individual OCT-VF associated with the strongest risk of LOCE events, the presence of any combination of OCT-VFs further increased the risk of the primary endpoint compared to the presence of TCFA alone (Figure 2B, Supplementary Table 5). The risk-scoring model for predicting the likelihood of the LOCE at 5 years, based on the presence of different OCT-VFs, is shown in Figure 2C.
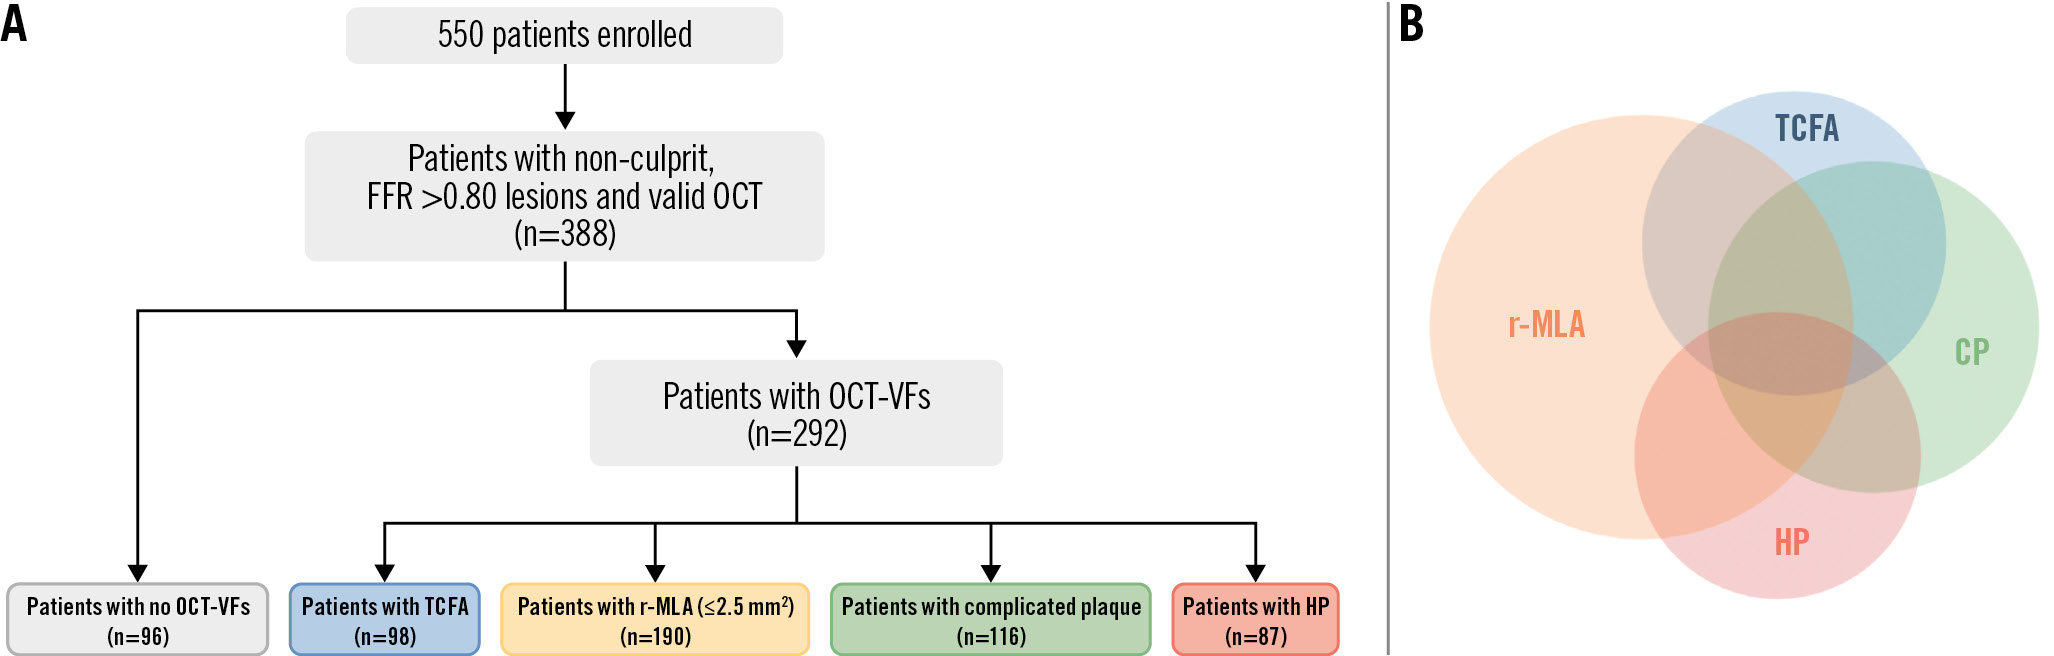
Figure 1. Flowchart of the study population. A) From a total of 550 diabetic patients, 388 with non-culprit, FFR-negative target lesions who underwent OCT assessment were included in the analysis. Among the 292 (75.3%) patients who presented lesions with at least 1 OCT-VF, 98, 190, 116 and 87 patients showed TCFA, r-MLA, HP, and CP, respectively; 96 (24.7%) patients had none of these VFs. B) Distribution and overlap of OCT-VFs in the entire cohort. CP: complicated plaque; FFR: fractional flow reserve; HP: healed plaque; OCT: optical coherence tomography; OCT-VFs: OCT-detected vulnerability features; r-MLA: reduced minimal lumen area; TCFA: thin-cap fibroatheroma
Table 2. Main baseline characteristics of patients presenting lesions with and without OCT-VFs.
| Unadjusted p-value for pairwise comparison | |||||||||
|---|---|---|---|---|---|---|---|---|---|
| None (n=96) | TCFA (n=98) | r-MLA ≤2.5 mm2 (n=190) |
CP (n=116) | HP (n=87) | None vs TCFA | None vs r-MLA | None vs CP | None vsHP | |
| Baseline characteristics | |||||||||
| Age, years | 67.0 [60.3-73.8] | 70.0 [59.0-76.0] | 68.0 [61.8-74.3] | 70.0 [62.3-76.0] | 67.0 [61.0-75.0] | 0.407 | 0.471 | 0.059 | 0.577 |
| Body mass index, kg/m2 | 30.1 [27.4-34.1] | 29.0 [27.0-33.0] | 28.3 [25.7-31.8] | 29.4 [26.3-31.8] | 29.0 [26.4-32.2] | 0.105 | 0.002 | 0.076 | 0.117 |
| Sex (male) | 61 (63.5) | 65 (66.3) | 112 (59.0) | 73 (62.9) | 54 (62.1) | 0.684 | 0.453 | 0.927 | 0.837 |
| Current smoker | 15 (16.5) | 22 (22.4) | 40 (21.4) | 23 (20.2) | 14 (16.3) | 0.302 | 0.335 | 0.499 | 0.971 |
| Previous smoker | 20 (31.8) | 23 (34.8) | 43 (30.9) | 27 (33.3) | 20 (29.4) | 0.709 | 0.908 | 0.840 | 0.772 |
| Hypercholesterolaemia | 56 (58.3) | 61 (62.2) | 116 (61.1) | 64 (55.7) | 56 (64.4) | 0.578 | 0.657 | 0.695 | 0.403 |
| Hypertension | 74 (77.1) | 75 (76.5) | 141 (74.6) | 79 (68.7) | 60 (69.0) | 0.927 | 0.646 | 0.174 | 0.216 |
| Previous ACS | 31 (32.3) | 42 (42.9) | 67 (35.3) | 46 (39.7) | 31 (35.6) | 0.129 | 0.617 | 0.267 | 0.634 |
| Previous PCI | 28 (29.2) | 41 (41.8) | 76 (40.0) | 51 (44.0) | 34 (39.1) | 0.065 | 0.072 | 0.027 | 0.157 |
| Previous CABG | 4 (4.2) | 4 (4.1) | 6 (3.2) | 4 (3.5) | 3 (3.5) | 0.976 | 0.661 | 0.785 | 0.800 |
| Previous CVA | 6 (6.3) | 12 (12.2) | 13 (6.8) | 12 (10.3) | 8 (9.2) | 0.216 | 0.849 | 0.287 | 0.454 |
| Clinical presentation | |||||||||
| SCD at presentation | 70 (73.9) | 77 (78.6) | 140 (73.7) | 90 (77.6) | 69 (79.3) | 0.197 | 0.339 | 0.083 | 0.101 |
| ACS at presentation | 26 (27.1) | 21 (21.4) | 50 (26.3) | 26 (22.4) | 18 (20.7) | ||||
| Laboratory | |||||||||
| Total cholesterol, mg/dL | 154.4 [127.4-185.3] | 161.7 [142.8-189.1] | 158.3 [138.6-194.9] | 154.4 [139.0-189.1] | 167.0 [136.1-193.0] | 0.171 | 0.248 | 0.536 | 0.258 |
| LDL cholesterol, mg/dL | 81.1 [61.8-113.5] | 88.0 [82.0-93.0] | 81.1 [64.9-119.7] | 93.3 [69.2-122.2] | 100.8 [65.6-128.2] | 0.290 | 0.793 | 0.211 | 0.205 |
| Triglycerides, mg/mL | 161.1 [106.2-242.5] | 168.0 [120.0-242.0] | 150.5 [113.1-226.1] | 148.7 [109.6-210.1] | 170.8 [109.7-271.0] | 0.591 | 0.828 | 0.775 | 0.746 |
| Haemoglobin A1c, % | 7.4 [6.8-8.4] | 7.3 [6.7-7.9] | 7.2 [6.5-8.0] | 7.3 [6.8-7.9] | 7.6 [6.8-8.3] | 0.379 | 0.211 | 0.435 | 0.901 |
| Baseline treatment | |||||||||
| Aspirin | 77 (80.2) | 74 (75.5) | 151 (79.5) | 82 (70.7) | 61 (70.1) | 0.431 | 0.884 | 0.111 | 0.113 |
| P2Y12 antagonist | 28 (29.2) | 36 (36.7) | 65 (34.2) | 33 (28.5) | 24 (27.6) | 0.262 | 0.390 | 0.908 | 0.813 |
| Oral anticoagulation | 12 (12.5) | 12 (12.2) | 23 (12.1) | 27 (23.3) | 10 (11.5) | 0.957 | 0.923 | 0.044 | 0.835 |
| Beta blocker | 65 (67.7) | 67 (68.4) | 125 (65.8) | 83 (71.6) | 57 (65.5) | 0.922 | 0.746 | 0.544 | 0.754 |
| ACE inhibitor | 42 (43.8) | 35 (35.7) | 74 (39.0) | 39 (33.6) | 34 (39.1) | 0.253 | 0.435 | 0.131 | 0.522 |
| Angiotensin receptor blocker | 25 (26.0) | 19 (19.4) | 54 (28.4) | 30 (25.9) | 17 (19.5) | 0.269 | 0.671 | 0.976 | 0.296 |
| Statins | 81 (84.4) | 67 (68.4) | 146 (76.8) | 85 (73.3) | 61 (70.1) | 0.009 | 0.137 | 0.051 | 0.021 |
| Oral antidiabetics | 79 (82.3) | 82 (83.7) | 159 (83.7) | 96 (82.8) | 67 (77.0) | 0.798 | 0.766 | 0.929 | 0.375 |
| Insulin treatment | 37 (38.5) | 35 (35.7) | 65 (34.2) | 39 (33.6) | 34 (39.1) | 0.684 | 0.470 | 0.457 | 0.941 |
| Vessel distribution | |||||||||
| LM | 1 (1.0) | 1 (1.0) | 1 (0.5) | 1 (0.7) | 1 (2.0) | 0.033 | 0.002 | 0.021 | 0.056 |
| LAD | 59 (54.1) | 35 (34.0) | 86 (40.2) | 48 (34.5) | 36 (35.6) | ||||
| Cx | 20 (18.4) | 28 (27.2) | 84 (39.3) | 36 (25.9) | 23 (22.8) | ||||
| RCA | 29 (26.6) | 39 (37.9) | 43 (20.1) | 54 (38.9) | 40 (39.6) | ||||
| Values are expressed as median [interquartile range] or n (%). ACE: angiotensin-converting enzyme; ACS: acute coronary syndrome; CABG: coronary artery bypass grafting; CP: complicated plaque; CVA: cerebrovascular accident; Cx: circumflex artery; HP: healed plaque; LAD: left anterior descending artery; LDL: low-density lipoprotein; LM: left main artery; PCI: percutaneous coronary intervention; r-MLA: reduced minimal lumen area; OCT-VFs: optical coherence tomography-detected vulnerability features; RCA: right coronary artery; SCD: stable coronary disease; TCFA: thin-cap fibroatheroma | |||||||||
Table 3. Lesion-level quantitative and qualitative OCT analysis in patients with and without OCT-VFs.
| Unadjusted p-value for pairwise comparison | |||||||||
|---|---|---|---|---|---|---|---|---|---|
| None (n=96) | TCFA (n=98) | r-MLA≤2.5 mm2 (n=190) | CP (n=116) | HP (n=87) | None vs TCFA | Nonevs r-MLA | None vs CP | None vs HP | |
| Quantitative OCT analysis | |||||||||
| MLA, mm2 | 3.25 [2.80-4.28] | 2.30 [1.70-3.13] | 1.80 [1.50-2.10] | 2.60 [1.90-3.50] | 2.40 [1.60-3.20] | <0.001 | <0.001 | <0.001 | <0.001 |
| % area stenosis, % | 57 [49-65] | 66 [59-74] | 69 [62-76] | 67 [59-74] | 69 [61-75] | <0.001 | <0.001 | <0.001 | <0.001 |
| Lesion length, mm | 22.65 [12.43-34.10] | 31.10 [20.88-42.03] | 26.10 [16.10-35.20] | 31.70 [19.10-44.85] | 27.10 [18.10-36.10] | 0.001 | 0.058 | 0.001 | 0.030 |
| Proximal RLD, mm | 3.50 [3.10-3.90] | 3.40 [3.10-3.80] | 3.10 [2.70-3.40] | 3.40 [3.10-3.90] | 3.50 [2.98-3.80] | 0.156 | <0.001 | 0.308 | 0.0890 |
| Distal RLD, mm | 3.00 [2.70-3.40] | 2.70 [2.50-3.20] | 2.50 [2.20-2.80] | 2.80 [2.50-3.40] | 2.80 [2.40-3.40] | 0.001 | <0.001 | 0.034 | 0.0210 |
| Proximal RLA, mm2 | 10.00 [7.80-12.10] | 9.05 [7.50-11.63] | 7.30 [5.60-9.20] | 9.05 [7.50-12.00] | 9.35 [6.98-11.50] | 0.148 | <0.001 | 0.288 | 0.086 |
| Distal RLA, mm2 | 6.90 [5.70-9.15] | 5.70 [4.70-8.00] | 4.80 [3.80-6.00] | 6.20 [4.80-9.10] | 6.30 [4.43-8.78] | 0.001 | <0.001 | 0.039 | 0.023 |
| Qualitative OCT analysis | |||||||||
| Fibrous cap thickness, μm | 147.0 [110.0-201.5] | 60.0 [56.0-62.3] | 104.0 [61.0-174.0] | 63.0 [59.0-104.5] | 119.0 [61.0-216.0] | <0.001 | <0.001 | <0.001 | 0.023 |
| Lipid arc, ° | 167.0 [126.0-218.0] | 245.5 [194.8-290.0] | 195.0 [142.0-261.0] | 229.0 [175.8-283.0] | 203.0 [171.0-272.0] | <0.001 | 0.020 | <0.001 | 0.004 |
| Calcification present | 84 (87.5) | 90 (91.8) | 170 (89.5) | 109 (94.0) | 74 (85.1) | 0.319 | 0.617 | 0.101 | 0.631 |
| Calcium arc, ° | 169.0[89.3-260.3] | 117.5 [81.0-209.0] | 143.0 [88.0-240.0] | 190.0 [109.5-271.0] | 144.0[86.0-230.3] | 0.081 | 0.396 | 0.339 | 0.346 |
| Protruding calcium | 50 (52.1) | 40 (40.8) | 84 (44.2) | 65 (56.0) | 33 (37.9) | 0.116 | 0.208 | 0.565 | 0.055 |
| Cholesterol clefts | 43 (44.8) | 74 (76.3) | 113 (60.1) | 72 (62.6) | 55 (64.7) | <0.001 | 0.014 | 0.010 | 0.007 |
| Neovascularisation | 62 (64.6) | 83 (84.7) | 141 (74.2) | 95 (81.9) | 75 (86.2) | 0.001 | 0.090 | 0.004 | 0.001 |
| Macrophage infiltration | 42 (43.8) | 69 (71.1) | 106 (56.1) | 66 (57.4) | 61 (70.1) | <0.001 | 0.049 | 0.048 | <0.001 |
| Values are expressed as median [interquartile range] or n (%). CP: complicated plaque; HP: healed plaque; MLA: minimal lumen area; OCT: optical coherence tomography; OCT-VFs: OCT-detected vulnerability features; RLA: reference lumen area; RLD: reference lumen diameter; r-MLA: reduced MLA; TCFA: thin-cap fibroatheroma | |||||||||
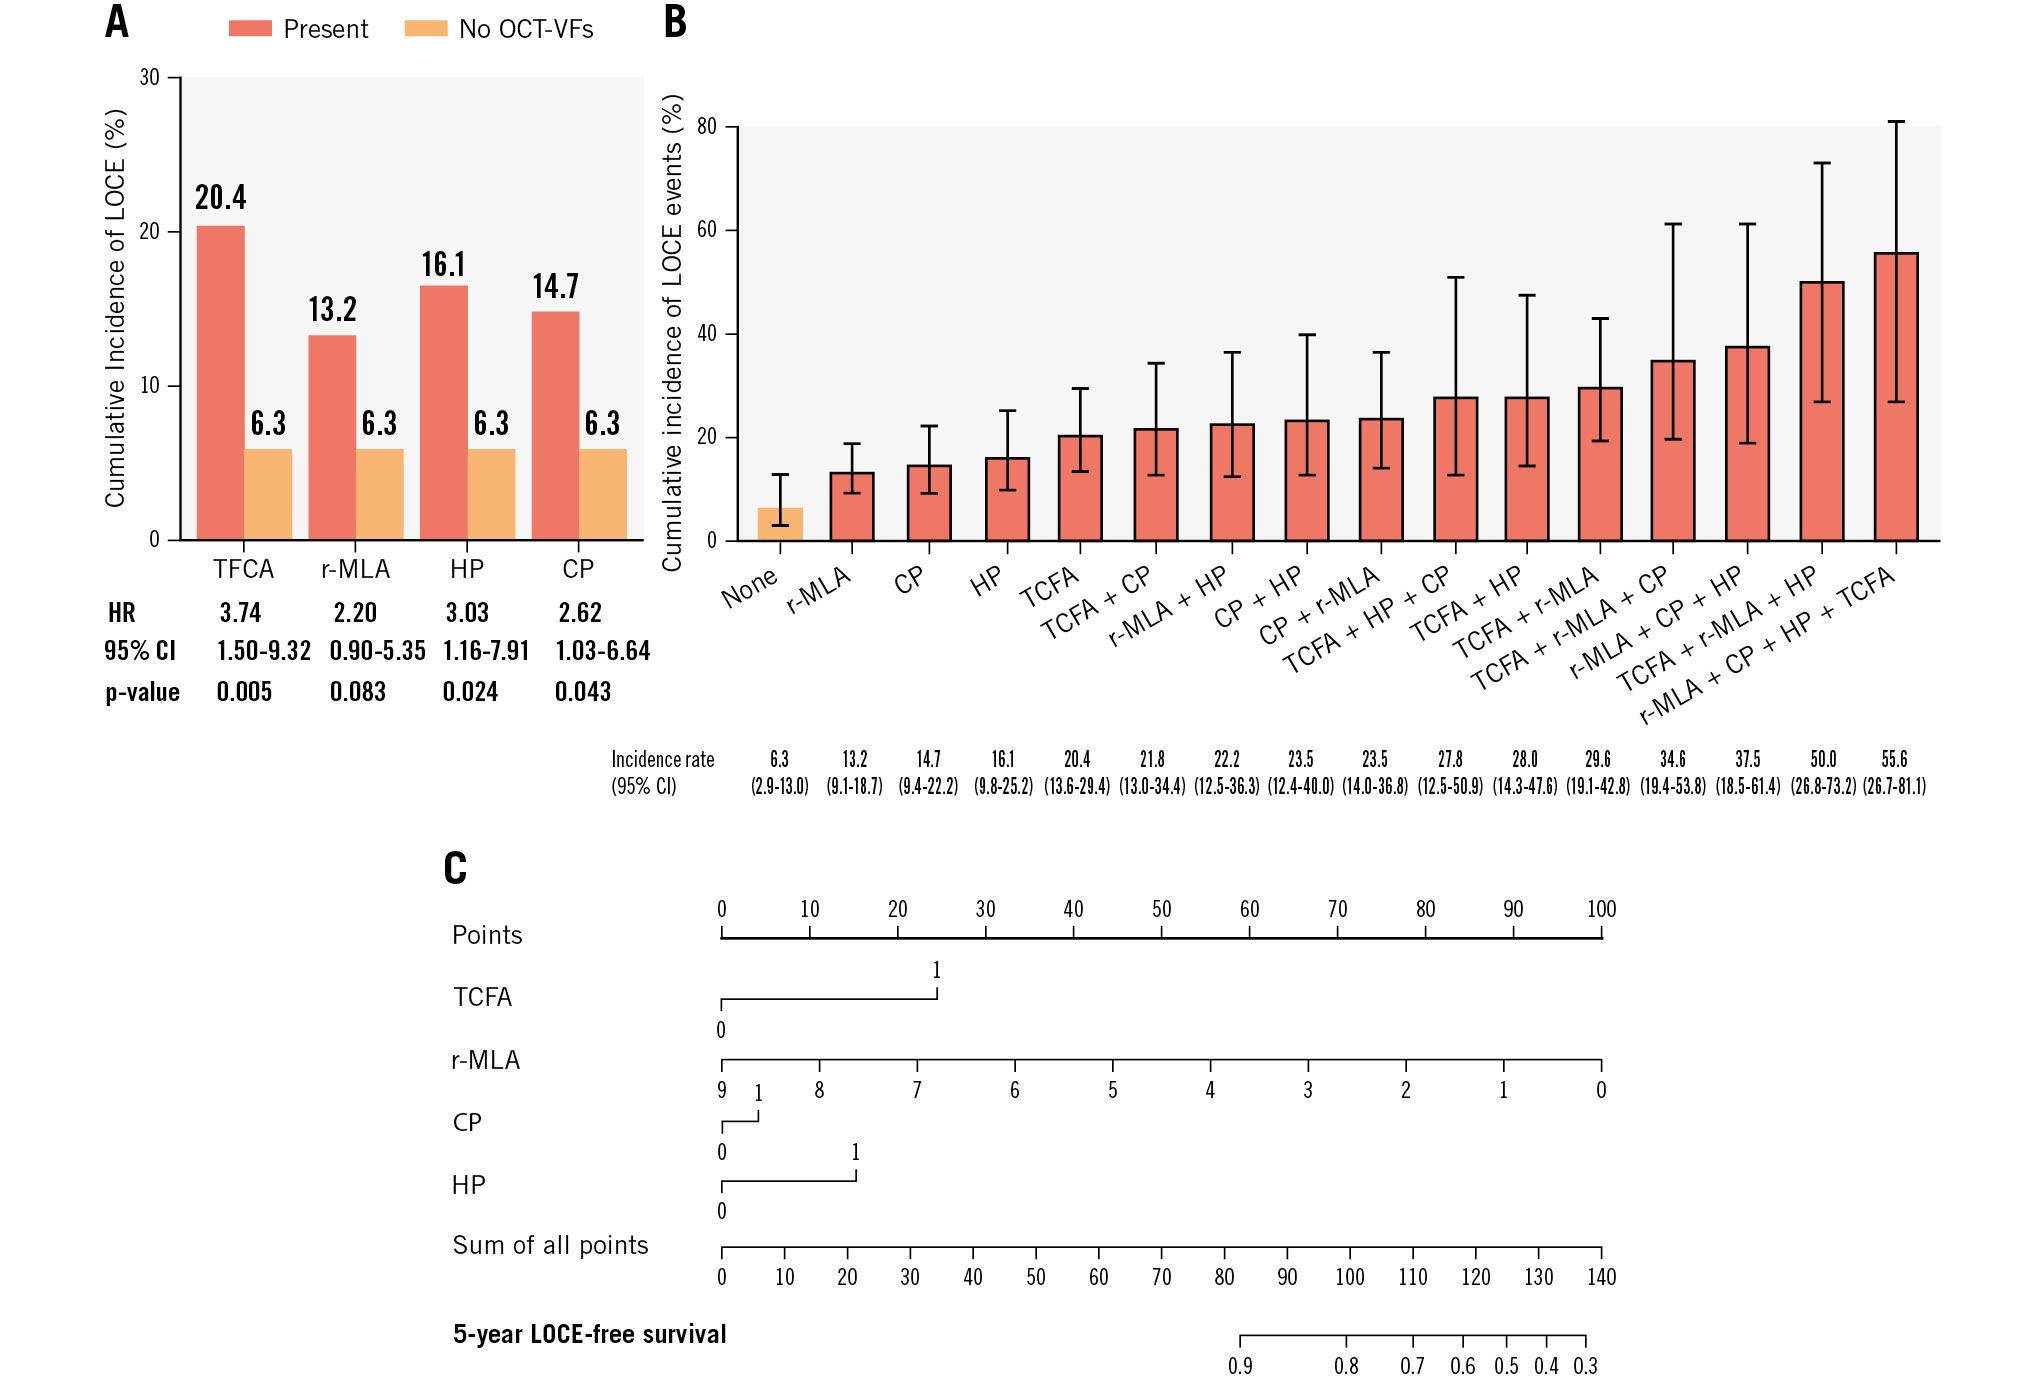
Figure 2. Main results. A) Cumulative incidence of LOCE events in patients with lesions exhibiting different OCT-VFs compared to those without any OCT-VFs. B) Cumulative incidence rate of the primary endpoint (LOCE) with different combinations of OCT-VFs. C) The risk-scoring model for predicting 5-year LOCE-free survival based on the presence of OCT-VFs (r-MLA was considered a continuous variable. TCFA, CP and HP were considered dichotomous variables). CI: confidence interval; CP: complicated plaque; HP: healed plaque; HR: hazard ratio; LOCE: lesion-oriented composite endpoint; r-MLA: reduced MLA; OCT-VFs: optical coherence tomography-detected vulnerability features; TCFA: thin-cap fibroatheroma
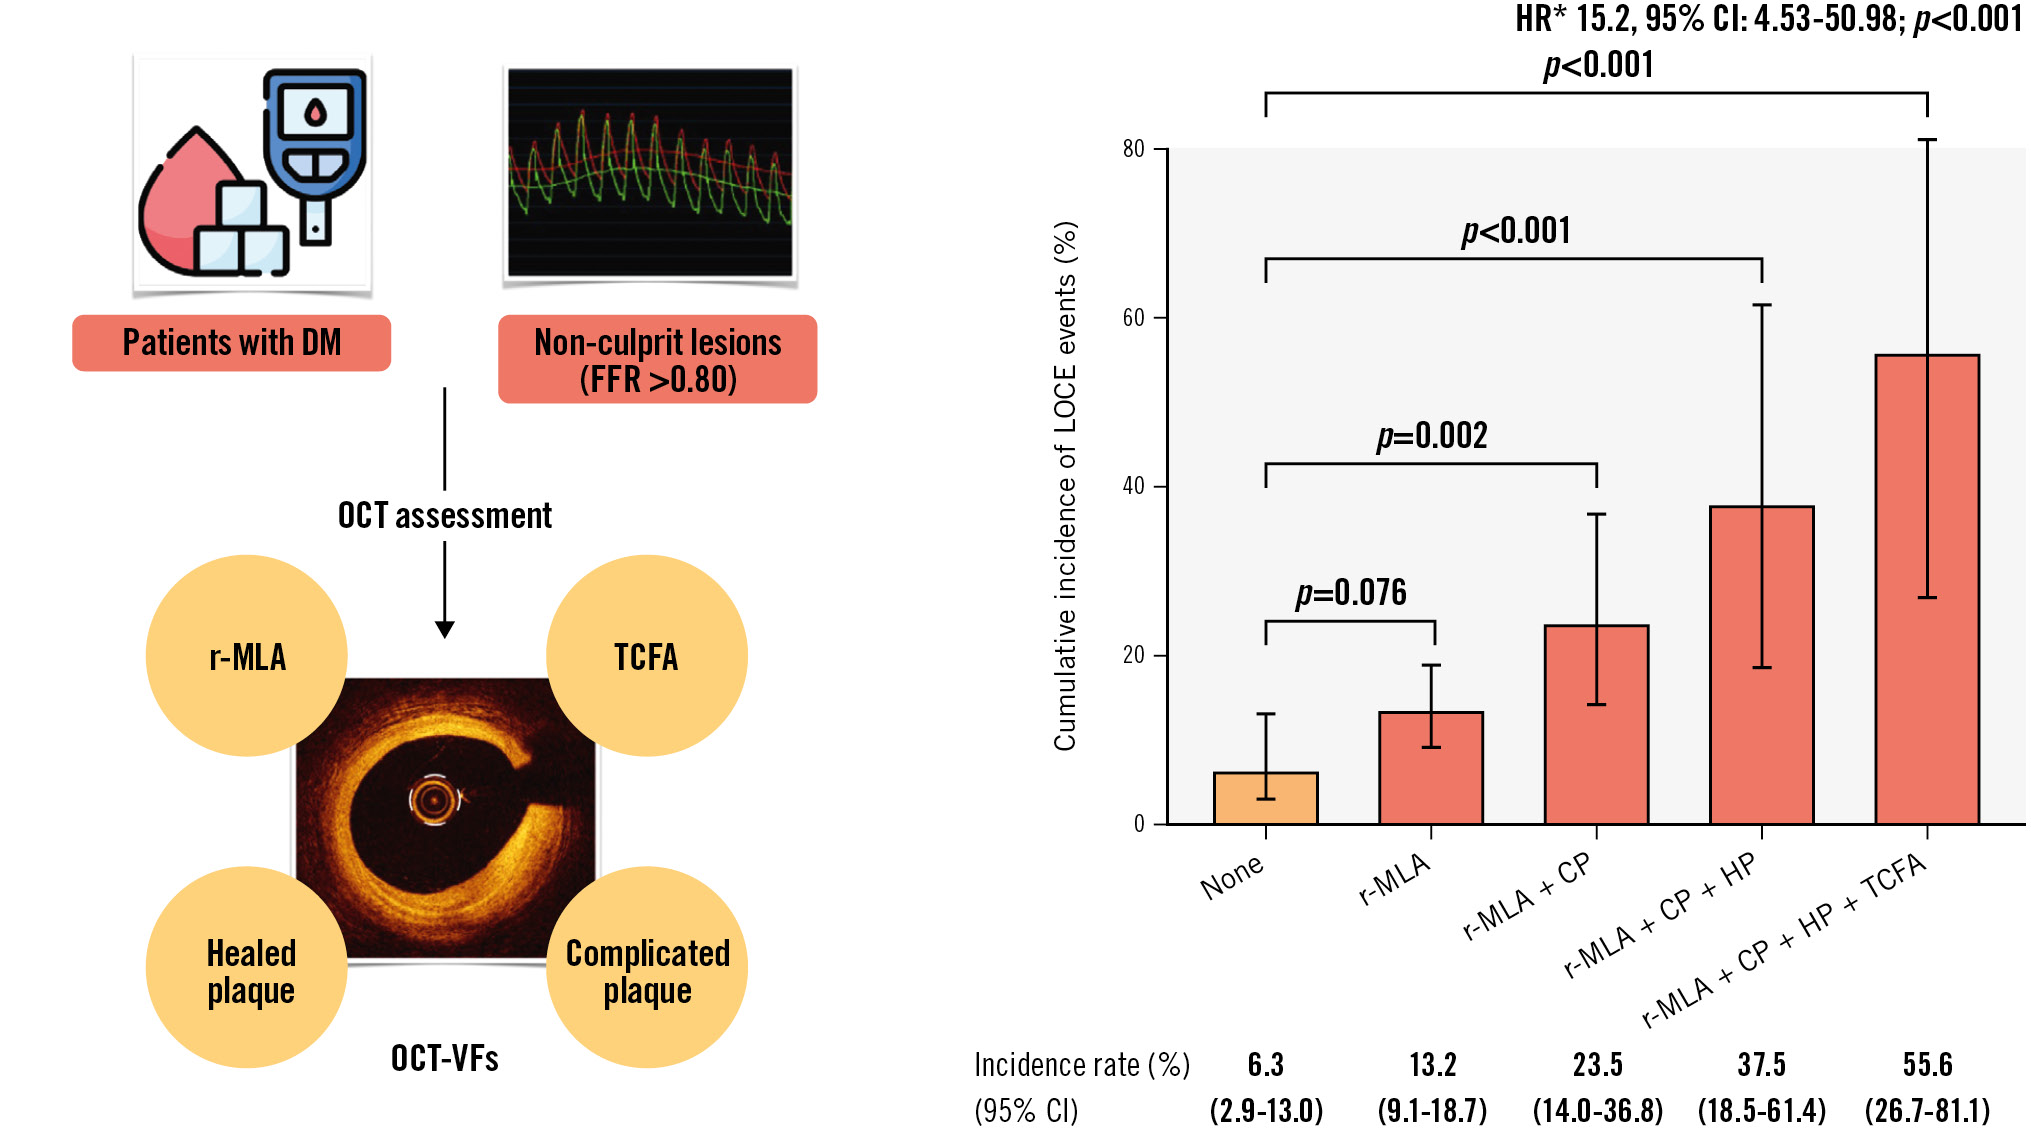
Central illustration. OCT-defined vulnerability features and incidence of lesion-oriented composite endpoint. A) Patients with diabetes mellitus presenting with intermediate, non-ischaemic (FFR >0.80) lesions underwent OCT assessment to identify OCT-based high-risk features for vulnerability. TCFA, r-MLA (<2.5 mm2), healed plaques, and complicated plaques were identified as OCT-VFs related to the lesion-oriented composite endpoint (LOCE). B) The cumulative incidence of the primary endpoint (LOCE) based on the combined presence of OCT-VFs. While the cumulative incidence of LOCE in patients who presented lesions without any OCT-VFs was notably low (6.3%), the progressive accumulation of OCT-VFs significantly increased the event rate (*none as reference). CI: confidence interval; CP: complicated plaque; DM: diabetes mellitus; FFR: fractional flow reserve; HP: healed plaque; HR: hazard ratio; r-MLA: reduced minimal lumen area; OCT: optical coherence tomography; OCT-VFs: OCT-detected vulnerability features; TCFA: thin-cap fibroatheroma
Table 4. Primary endpoint outcomes and its individual components.
| Unadjusted p-value for pairwise comparison | |||||||||
|---|---|---|---|---|---|---|---|---|---|
| No OCT-VFs (n=96) | TCFA (n=98) | r-MLA ≤2.5 mm2 (n=190) |
CP (n=116) | HP (n=87) | None vs TCFA | None vs r-MLA | None vs CP | None vs HP | |
| Primary endpoint* | 6 (6.3) | 20 (20.4) | 25 (13.2) | 17 (14.7) | 14 (16.1) | 0.003 | 0.076 | 0.050 | 0.033 |
| Cardiac death | 3 (3.1) | 2 (2.0) | 5 (2.6) | 5 (4.3) | 4 (4.6) | 0.634 | 0.811 | 0.652 | 0.604 |
| Death (any) | 4 (4.2) | 5 (5.1) | 13 (6.8) | 6 (5.2) | 5 (5.8) | 0.757 | 0.366 | 0.731 | 0.622 |
| TVMI | 1 (1.0) | 6 (6.1) | 5 (2.6) | 4 (3.5) | 2 (2.3) | 0.058 | 0.376 | 0.250 | 0.497 |
| Spontaneous MI (any) | 3 (3.1) | 10 (10.2) | 13 (6.8) | 9 (7.8) | 4 (4.6) | 0.588 | 0.633 | 0.569 | 0.408 |
| CD-TLR | 3 (3.1) | 17 (17.4) | 19 (10.0) | 12 (10.3) | 10 (11.5) | 0.001 | 0.039 | 0.041 | 0.028 |
| Revascularisation (any) | 8 (8.3) | 27 (27.6) | 36 (19.0) | 23 (19.8) | 15 (17.2) | 0.000 | 0.019 | 0.018 | 0.070 |
| Unstable angina requiring hospitalisation | 2 (2.1) | 10 (10.2) | 13 (6.8) | 5 (4.3) | 6 (6.9) | 0.019 | 0.088 | 0.366 | 0.112 |
| Cardiac death and TVMI | 4 (4.2) | 8 (8.2) | 10 (5.3) | 9 (7.8) | 6 (6.9) | 0.248 | 0.685 | 0.278 | 0.417 |
| Death and any MI | 7 (7.3) | 16 (16.3) | 27 (14.2) | 16 (13.8) | 10 (11.5) | 0.052 | 0.088 | 0.130 | 0.328 |
| Death, MI and revascularisation | 12 (12.5) | 31 (31.6) | 48 (25.3) | 28 (24.1) | 19 (21.8) | 0.001 | 0.012 | 0.031 | 0.093 |
| Values are expressed as n (%). *Primary endpoint was defined as a lesion-oriented composite endpoint (LOCE): cardiac death, TVMI or CD-TLR at 5 years. CD-TLR: clinically driven target lesion revascularisation; CP: complicated plaque; HP: healed plaque; MI: myocardial infarction; OCT-VFs: optical coherence tomography-detected vulnerability features; r-MLA: reduced minimal lumen area; TCFA: thin-cap fibroatheroma; TVMI: target vessel myocardial infarction. | |||||||||
Discussion
This study provides unique novel insights into the association between OCT-VFs and the long-term risk of LOCE events in patients with DM and non-culprit, FFR-negative coronary lesions. The key findings of this study can be summarised as follows: (1) OCT-VFs were observed in a high proportion of the lesions, often in combination, with more than 3 out of 4 patients presenting at least 1 OCT-VF; (2) TCFA, r-MLA and HP were associated with a higher risk of the primary endpoint; (3) while the cumulative incidence of the LOCE in patients carrying lesions without any OCT-VFs was notably low (6.3%), the progressive accumulation of OCT-VFs significantly increased the event rate. Indeed, the simultaneous presence of all 4 OCT-VFs was linked to a markedly elevated risk of the primary endpoint, with more than half of the patients experiencing LOCE events during clinical follow-up; (4) the presence of any combination of OCT-VFs further increased the risk of the primary endpoint compared to the presence of TCFA alone; and (5) the predicted LOCE-free survival at 5 years in patients without any OCT-VFs is high; this decreases progressively with the concurrence of different OCT-VFs.
IMAGING-BASED MORPHOLOGICAL FEATURES AND PLAQUE VULNERABILITY
The progression of atherosclerotic coronary lesions is a dynamic process influenced by several factors. In recent years, the widespread use of invasive imaging techniques, such as intravascular ultrasound (IVUS) and OCT, has facilitated a more comprehensive assessment of imaging-based morphological features linked to vulnerability or high risk. Previous studies using these invasive imaging techniques have identified specific lesion-related characteristics associated with an increased rate of major adverse cardiovascular events, including fibrous cap thickness, plaque burden, macrophage infiltration, plaque erosion, plaque rupture and neovascularisation3. In particular, in PROSPECT (Providing Regional Observations to Study Predictors of Events in the Coronary Tree: An Imaging Study in Patients With Atherosclerotic Lesions)2, a large plaque burden (≥70%), r-MLA (≤4.0 mm2), and TCFA were identified as predictors of MACE in non-culprit lesions, as assessed by IVUS. It is noteworthy that a further subanalysis of this study, focusing on a subset of patients with DM, observed that most of the events occurred in non-culprit mild lesions rather than in the index lesion undergoing PCI17. In the PROSPECT II trial, which combined IVUS and near-infrared spectroscopy (NIRS), an increased risk of future adverse cardiac outcomes was observed in patients presenting with non-obstructive lesions with a high lipid content and large plaque burden12. Likewise, the CLIMA Study demonstrated the correlation of OCT-detected TCFA (defined as a fibrous cap thickness <75 μm), r-MLA (<3.5 mm2), lipid arc circumferential extension >180º, and macrophage infiltration with an increased risk of a composite of cardiac death or myocardial infarction at 1 year in patients with an untreated proximal left anterior descending coronary artery13. More recently, a large observational study analysed the findings of 3-vessel OCT evaluation in 883 patients presenting with acute myocardial infarction (median of 4 [interquartile range: 3-6] non-culprit lesions per patient)18. This study identified TCFA (<65 μm) and MLA <3.5 mm2 as independent predictors of new adverse events during follow-up18. Furthermore, the COMBINE OCT-FFR study demonstrated that TCFA (defined as a fibrous cap thickness ≤65 μm) was the most robust predictor of recurrent events during follow-up in patients with DM and FFR-negative lesions, with up to a 5-fold higher risk compared to TCFA-negative patients5. A recent post hoc analysis of the COMBINE OCT-FFR study suggested that the combination of a lipid-rich plaque and TCFA, rather than the presence of lipid-rich plaques alone, was associated with an increased risk of adverse events19. However, a detailed comprehensive assessment of the combination of OCT-VFs was not performed. Additionally, other studies using NIRS have linked TCFA and a high lipid core burden index with non-culprit major adverse events2021. It is worth noting that the overall incidence rate of events varied significantly across different studies assessing high-risk, imaging-based morphological plaque features. These disparities may be partially explained by the heterogeneous patient populations included in the corresponding studies. Lesion-related, precise, high-risk criteria are not universally accepted, and some analyses used different thresholds and definitions for specific plaque features (e.g., fibrous cap thickness, MLA, lipid arc extension). Thus, this variation is not particularly surprising and can be explained by the diversity of study designs, the heterogeneity of the study populations (patient’s profile, comorbidities, clinical presentation), and the lack of uniformity in the definition of high-risk vulnerability features.
To date, there is limited evidence regarding the prognostic implications of the coexistence of multiple high-risk morphological plaque features of vulnerability2121318. Although TCFA emerged as the most robust predictor of lesion-oriented outcomes in the present study, the long-term risk of recurrent events in non-culprit, FFR-negative lesions substantially increased when additional OCT-VFs were identified simultaneously. It is noteworthy that more than half of the patients exhibiting all 4 OCT-VFs (TCFA, r-MLA, HP and CP) in combination experienced a lesion-related outcome during follow-up. This observed incidence rate is notably higher than those reported in prior studies2121318 and may be partially explained by the unique characteristics of the COMBINE population, which exclusively comprised patients with DM that are inherently associated with a high risk of recurrent events. Moreover, it is important to highlight that the progressively increasing risk observed with the combination of OCT-VFs is notably higher than that associated with PCI for comparable lesions. This implies that mechanical revascularisation might yield better clinical outcomes than conservative treatment in selected non-flow-limiting but high-risk plaques. Currently, dedicated ongoing OCT trials are actively enrolling patients to provide further insights into this exciting field (COMBINE-INTERVENE [ClinicalTrials.gov: NCT05333068], INTERCLIMA [ClinicalTrials.gov: NCT05027984], and VULNERABLE [ClinicalTrials.gov: NCT05599061]).
Recently, diagnostic algorithms based on deep learning and artificial intelligence (AI) have emerged as valuable tools for the automatic characterisation of OCT features associated with a high probability of recurrent clinical events22. The integration of AI and OCT (AI-assisted OCT) may eventually mitigate certain limitations inherent in image interpretation, including the requirement for specialised training and the inter- and intraobserver variability in image interpretation. While promising results have been recently reported, additional studies in this compelling area are also warranted.
HIGH-RISK VULNERABLE PLAQUES IN HIGH-RISK POPULATIONS
The management of coronary artery disease in patients with DM remains challenging, as they represent a particularly high-risk population for recurrent events232425. Findings from the PROSPECT trial showed that the 3-year overall MACE rate was substantially higher in patients with DM compared to those without, primarily because of a greater incidence of MACE in non-culprit lesions17. To the best of our knowledge, however, our study is the first systematic evaluation of the prognostic value of detecting the coexistence of different OCT-defined morphological characteristics of vulnerability in non-culprit, FFR-negative lesions, within a large cohort of patients with DM. Our findings, emphasising the utility of OCT in identifying patients at high risk for recurrent events, provide novel insights that may have notable clinical implications. While evidence-based clinical guidelines recommend a conservative approach with medical therapy, in the absence of ischaemia, in patients with non-obstructive lesions, the exceptionally high incidence rate of the LOCE in our study in patients with lesions showing ≥2 OCT-VFs (TCFA, r-MLA, HP and CP) concurrently is of major concern. Therefore, we hypothesise that in certain cases (e.g., those with 4 OCT-VFs), a focal percutaneous approach or a more aggressive medical treatment may be justified. In this regard, previous studies have demonstrated that the combination of proprotein convertase subtilisin kexin type 9 (PCSK9) inhibitors and high-intensity statin therapy was associated with plaque stabilisation, as assessed by intracoronary imaging, in high-risk patients. In the PACMAN-AMI study26, significant plaque regression in non-infarct-related vessels was observed in patients on this treatment, along with a greater reduction in lipid burden and a notable increase in the minimum fibrous cap thickness, compared with placebo. Likewise, the HUYGENS Study showed a significant increase in the minimum fibrous cap thickness, a reduction in the maximum lipid arc and macrophage index, and a notable regression of the percentage of atheroma volume in patients receiving evolocumab27.
Importantly, our findings suggest that patients with DM carrying only coronary lesions without any OCT-VFs could be safely managed conservatively, given the very low rate of events during follow-up in this subset of patients (6.3%). Nonetheless, further randomised studies are needed to support the use of these novel treatment strategies (either pharmacological or interventional) in patients with OCT-detected vulnerability features. Of note, detailed data on lipid-lowering medication and low-density lipoprotein values during follow-up were not available, yet these might significantly impact on the prognosis of the different OCT-VFs analysed in this study. Indeed, large, well-designed, dedicated, ongoing randomised trials will provide better insights on this important question.
Limitations
The current study has some limitations. First, as a prospective, non-randomised study, the COMBINE OCT-FFR study is inherently susceptible to the limitations and potential biases associated with this type of design. Second, the results found in the present study derive from a post hoc analysis of the COMBINE OCT-FFR study and, therefore, should be considered as hypothesis-generating only. Third, the study cohort exclusively comprised patients with DM, and, hence, these findings might not be extrapolated to non-diabetic patients, who typically exhibit a lower risk of recurrent events. Fourth, although the current analysis represents the largest study assessing the prognostic value of combined OCT-VFs in patients with DM, it may still be underÂpowered to detect differences in low-incidence, but still relevant, clinical endpoints. Fifth, although OCT-VFs might be useful in predicting recurrent events in patients with DM, these morphological features are not validated for estimating the risk of ACS related to uncommon aetiologies (“non-ruptured plaque ACS”), such as spontaneous coronary artery dissection, plaque erosion or complicated calcified nodules. Sixth, despite our maximum efforts, some misinterpretation of cap thickness, due to macrophage infiltration of the intima, leading to an overestimation of TCFA, might have persisted. However, the percentage of TCFA reported in this study is in line with that reported previously, and, therefore, we do not expect this issue to significantly impact the results of this study. Seventh, OCT was unfortunately not performed in most cases of revascularisation associated with unstable angina during follow-up; therefore, we could neither confirm nor discard the presence of thrombus. In addition, in this study, some events during follow-up (unstable angina, myocardial infarction) were adjudicated in relation to the entire target vessel but not to the precise target lesion where vulnerability features were assessed. Finally, data on plaque haemorrhage were unavailable; consequently, this plaque feature was not included in the risk-scoring model.
Conclusions
Among patients with DM, high-risk OCT-defined VFs, including TCFA, r-MLA, HP, and CP, were commonly identified in non-culprit, FFR-negative coronary lesions. While TCFA was the strongest predictor of recurrent events, the presence of any combination of OCT-VFs was associated with a noteworthy increase in event rates. The long-term risk of the lesion-oriented composite endpoint was as high as 55.6% in patients presenting with 4 OCT-VFs. Further randomised studies are needed to explore whether a more aggressive strategy for these atherosclerotic coronary lesions, either pharmacological or invasive, might be linked to improved clinical outcomes in this high-risk population.
Impact on daily practice
This study provides novel data of high clinical relevance to an important field, which may contribute to a change in practice. The cumulative incidence of the lesion-oriented composite endpoint (LOCE) in diabetic patients without any optical coherence tomography-detected vulnerability features (OCT-VFs) was relatively low (6.3%), but this increased progressively to 55.6% when all 4 OCT-VFs were simultaneously present. Patients with lesions showing all 4 OCT-VFs exhibited a 15.2 times higher risk of the LOCE during follow-up compared to those without any OCT-VFs. Therefore, the identification of OCT-VFs, particularly in combination, might indeed justify a focal percutaneous approach or tailored, more aggressive medical treatment in diabetic patients with non-obstructive atherosclerotic lesions.
Funding
This investigator-initiated study was sponsored by Isala Hartcentrum, Zwolle, the Netherlands, and supported by an unrestricted institutional grant from St Jude Medical/Abbott. ClinicalTrials.gov: NCT02989740.
Conflict of interest statement
E. Kedhi reports personal lecture and advisory fees and institutional research grants from Abbott and Medtronic, outside the submitted work. W. Wojakowski reports personal fees from Abbott, outside the submitted work. R.S. Hermanides reports that he has received speaker fees from Abbott, Amgen, and Novartis. B. Berta reports that the Research Department of Cardiology of Isala has received an institutional research grant provided by Bayer outside the scope of the present study. The other authors have no conflicts of interest to declare.
Supplementary data
To read the full content of this article, please download the PDF.