Cory:
Unlock Your AI Assistant Now!
Abstract
Background: The drug delivery eï¬ciency of drug-coated balloons (DCBs) in de novo coronary artery disease is correlated with atherosclerotic plaque characteristics. It remains to be elucidated whether plaque composition and vulnerability can affect the efficacy of DCBs.
Aims: This study aimed to explore the association between a novel angiography-based radial wall strain (RWS) measurement for plaque vulnerability and DCB efficacy in de novo small vessel disease (SVD).
Methods: This study is a post hoc analysis of 266 SVD lesions in 260 patients treated with a paclitaxelâcoated balloon or plain old balloon angioplasty (POBA) from the PEPCAD China SVD study. The baseline maximum RWS (RWSmax) ≥13% was selected as the cutoff value for vulnerable plaques. The primary outcome was in-segment late lumen loss (LLL) at 9-month follow-up.
Results: A total of 152 and 72 lesions in the DCB and POBA groups, respectively, completed the 9-month angiographic follow-up. In the DCB group, lesions with RWSmax ≥13% had higher in-segment LLL (0.24±0.53 mm vs 0.05±0.16 mm; p=0.0009), greater binary restenosis (14.9% vs 1.9%; p=0.0040) and more target lesion failure (10.2% vs 1.6%; p=0.022) than those with RWSmax <13%. Among all the lesions with RWSmax ≥13%, no significant difference was observed in in-segment LLL (0.24±0.53 mm vs 0.32±0.48 mm; p=0.49) between the DCB and POBA groups.
Conclusions: Angiographically derived RWS has the potential to predict the angiographic and clinical outcomes of DCB treatment for de novo SVD (PEPCAD China SVD study; ClinicalTrials.gov: NCT03625830).
Drug-eluting stent (DES) implantation is a standard approach of percutaneous coronary intervention (PCI) in the current era. However, the deployment of a DES leaves a permanent metallic scaffold behind, which may lead to in-stent restenosis and adverse ischaemic events, especially in coronary small vessel disease (SVD) in which there is a smaller cross-sectional area1. To achieve the “leave nothing behind” goal, drug-coated balloons (DCBs) have been introduced as an attractive alternative to DES in treating de novo SVD23. Evidence from several pivotal trials, including BASKET-SMALL24, RESTORE SVD China trial5, PICCOLETO II6, and the recently published REC-CAGEFREE I7, have supported the notion that, in the setting of SVD, a new-generation DCB was at least non-inferior to a new-generation DES in terms of angiographic or clinical outcomes. A successful DCB-only approach depends on proper lesion preparation and subsequent efficient delivery of DCBs to the target lesions. The accumulated evidence indicates that the efficient delivery of a coating drug to the diseased vascular wall relies on various factors, including the type of coating drug, eï¬ective excipients, optimal drug load, and kinetic release profiles8. In addition to the proposed approaches to improve DCB design, coronary artery lesion characteristics are considered key to DCB efficacy. The presence of specific coronary anatomical features, such as calcium, severe tortuosity, high thrombus content, and diï¬use atherosclerotic burden, can substantially aï¬ect the penetration and retention of drugs in vascular tissues9. Animal studies have reported that lipid components in a diseased vascular wall could influence coating drug uptake and retention in atherosclerotic lesions10. However, the association between plaque vulnerability and DCB efficacy in humans has not yet been elucidated. In current clinical practice, plaque vulnerability is usually defined by coronary imaging-derived morphological characteristics. However, routine application of invasive modalities is not cost-effective and is particularly unrealistic in the context of de novo SVD. Angiographically derived radial wall strain (RWS) measurement was recently developed to evaluate the biomechanical response of deformable plaques exposed to pulsatile blood pressure1112. Aided by artificial intelligence, RWS is calculated by delineating the relative variation of the lumen diameter during an entire cardiac cycle from a single angiographic view. The maximum RWS (RWSmax) within a lesion segment has been found to be significantly correlated with multiple vulnerable plaque features on optical coherence tomography (OCT), including lipid-to-cap ratio (r=0.584; p<0.001), lipid plaque burden (r=0.411; p<0.001), and maximal lipid arc (r=0.276; p=0.002)12. In a recent validation study, a good correlation was observed between angiography-derived RWS and OCT-derived strain calculated by finite element analysis from plaque geometry, composition, and specific biomechanical material properties (r=0.91; p<0.001, difference=0.0±3.6%; p=0.909), which provides direct evidence supporting the correlation between RWS and established biomechanical assessments13. Recent studies have reported that RWS can independently predict the progression and future adverse events of untreated non-culprit lesions with mild to intermediate stenosis1415. Thus, RWS provides a novel, simplified, and cost-effective method for assessing the biomechanical characteristics of coronary plaques, making it an effective tool to detect vulnerable plaques in small coronary vessels. In the recently published Randomized, Multicenter Study on the Efficacy and Safety of Paclitaxel-Eluting PTCA-Balloon Catheter Compared to POBA in the Treatment of Small Vessel Disease Patient (PEPCAD China SVD study), DCB treatment for de novo SVD showed a significantly lower 9-month in-segment late lumen loss (LLL) than plain old balloon angioplasty (POBA) treatment16. Therefore, in the present study, we conducted a post hoc analysis on the PEPCAD China SVD study population to determine the predictive value of angiography-based RWS analysis on the angiographic and clinical outcomes of DCB treatment for de novo SVD.
Methods
Study design
This study is a post hoc analysis of the PEPCAD China SVD study, a prospective, multicentre, randomised controlled clinical trial conducted to determine whether DCBs (SeQuent Please [B. Braun]) are superior to conventional balloon catheters (SeQuent Neo [also B. Braun]) in SVD treatment. The study design, inclusion and exclusion criteria, and primary findings have previously been reported16. This study included patients intended for PCI with a maximum of two de novo lesions in different native coronary arteries. Lesions had a reference vessel diameter (RVD) of 2.00-2.75 mm and a percentage diameter stenosis (%DS) of 70-100%, or 50-70%DS with evidence of ischaemia. The primary aim of this study was to explore the association between RWS and DCB efficacy for SVD treatment. Lesions that were successfully treated with either a DCB or POBA were eligible for the analysis. All the target lesions were predilated with a conventional balloon catheter; none were treated with a modified balloon (e.g., cutting balloon or scoring balloon), nor with rotational atherectomy. In all the lesions included in our present analysis, successful predilation (defined as residual stenosis of less than 30% without dissection of type C or above) was achieved because it was mandatory for randomisation in the main study. The exclusion criteria were as follows: (1) presence of totally occluded lesions; (2) bailout stenting; (3) insufficient angiographic image quality, including excessive overlap, foreshortening, or severe distortion to the target lesions; or (4) acquisition of angiographic images <1 full cardiac cycle following complete contrast filling of the target vessel. The PEPCAD China SVD study protocol was approved by the ethics committee of each participating centre where the patients were enrolled and was conducted in accordance with the principles of the Declaration of Helsinki. All patients provided signed informed consent for enrolment in the database for potential future investigation.
Procedure
In the original PEPCAD China SVD study, all angiograms were analysed by a third-party independent core laboratory with the use of a quantitative coronary angiography (QCA) software package (Medis QAngio [Medis Medical Imaging]), following standard procedures. In the post hoc analysis of our present report, we extracted the QCA analysis data from the original study. Thus, the QCA data utilised in the present report, including minimal luminal diameter (MLD), RVD, and %DS, were identical to those previously reported in the original study. In our present report, RWS was retrospectively analysed at an external academic core laboratory (CardHemo, Shanghai Jiao Tong University) by two experienced analysts who were blinded to the clinical information, QCA analysis, and outcome data. The Murray law-based quantitative flow ratio (μQFR) and RWS analyses were conducted using AngioPlus Core software, version V3 (Pulse Medical), according to the standard operative procedures previously reported17. The key methodology for μQFR and RWS analyses are summarised in Supplementary Appendix 1. RWSmax was defined as the maximum RWS along the target lesion. An illustrative example of the RWS analysis on a DCB-treated SVD is shown in Supplementary Figure 1.
Outcomes
During follow-up, all the patients received guideline-based optimal medical therapy. The primary outcome was in-segment LLL, defined as the difference in the MLD from immediately after the index procedure to 9 months. In-segment was defined as the device length plus the proximal and distal 5 mm margins. The key secondary endpoint was target lesion failure (TLF) at 12 months, defined as the composite of cardiac death, target vessel myocardial infarction (MI), and clinically driven target lesion revascularisation (TLR) at the 12-month clinical follow-up. The other secondary endpoints included in-segment %DS, binary restenosis, and the individual components of TLF. Binary restenosis was defined as an in-segment %DS of 50% or more. Acute gain was calculated as the difference between post- and preprocedural MLD. Cardiac deaths that could not be attributed to the target vessels were excluded from the primary outcome. In the PEPCAD China SVD study, an independent clinical event committee that was blinded to the randomisation assignment adjudicated all clinical events. In the present study, the events were attributed to specific lesions by two interventional cardiologists blinded to the baseline clinical characteristics, lesion and procedural details, as well as the RWS analysis results. Data related to all adverse events were extracted from the medical records, electrocardiograms, and angiograms, and these were used for event readjudication. Events that could not be attributed to a culprit vessel were excluded.
Statistical analyses
RWS analysis was not available and could not be prespecified at the design stage of the PEPCAD China SVD study. Therefore, the sample size for the present study was dependent on the actual size of the main study, rather than the result of the sample size estimation. The Gaussian distribution was tested using the Shapiro-Wilk test for continuous variables, which were expressed as mean±standard deviation (SD) if normally distributed and as median with interquartile range otherwise. Meanwhile, categorical variables were expressed as numbers (%). Between-group comparisons of the baseline characteristics were performed using the chi-squared test or Fisher’s exact test for categorical variables and the Student’s t-tests or the Wilcoxon rank-sum test for continuous variables depending on the distributions. Pearson product-moment correlation was performed to evaluate the associations between RWSmax and in-segment LLL in the DCB group. Using an analysis of covariance (ANCOVA) linear regression model, sensitivity analyses were performed to determine the influences of different baseline characteristics. Cox proportional hazards models and Kaplan-Meier curves were used to analyse the time-dependent occurrence of events. Hazard ratios (HRs) were presented with 95% confidence intervals (CIs). A cutoff value ≥13% was used for RWSmax to identify lesions with a high strain amplitude, based on a previous study indicating that RWSmax ≥13% demonstrated a good performance in the identification of OCT-defined plaque vulnerability9. This threshold could also be compared with the optimal cutoff value identified from the dataset in the present study using the criterion of the Youden index. The predictive accuracy of RWSmax for TLF was evaluated using the area under the curve (AUC) via receiver operating characteristic analysis. Lesion-wise analyses were conducted without adjustment for multiple vessels within individuals. To test the reproducibility of RWS measurement, the angiograms of 30 randomly selected SVD lesions were analysed by one analyst at different timepoints as well as by a second analyst. Intra- and interobserver agreements of RWS measurement were qualified using the Bland-Altman analysis and the intraclass correlation coefficient. Hypothesis testing was conducted using a two-sided alpha of 0.05. All analyses were conducted using Stata software, version 14.0 (StataCorp) and Prism, version 9.5.0 (GraphPad Software).
Results
Study population
The angiographic data of 276 lesions in 268 patients were screened. Four lesions were excluded due to bailout stenting, and six totally occluded lesions were excluded due to the inability to perform RWS analysis. Ultimately, 266 lesions in 260 patients were included in the final analysis (Figure 1). 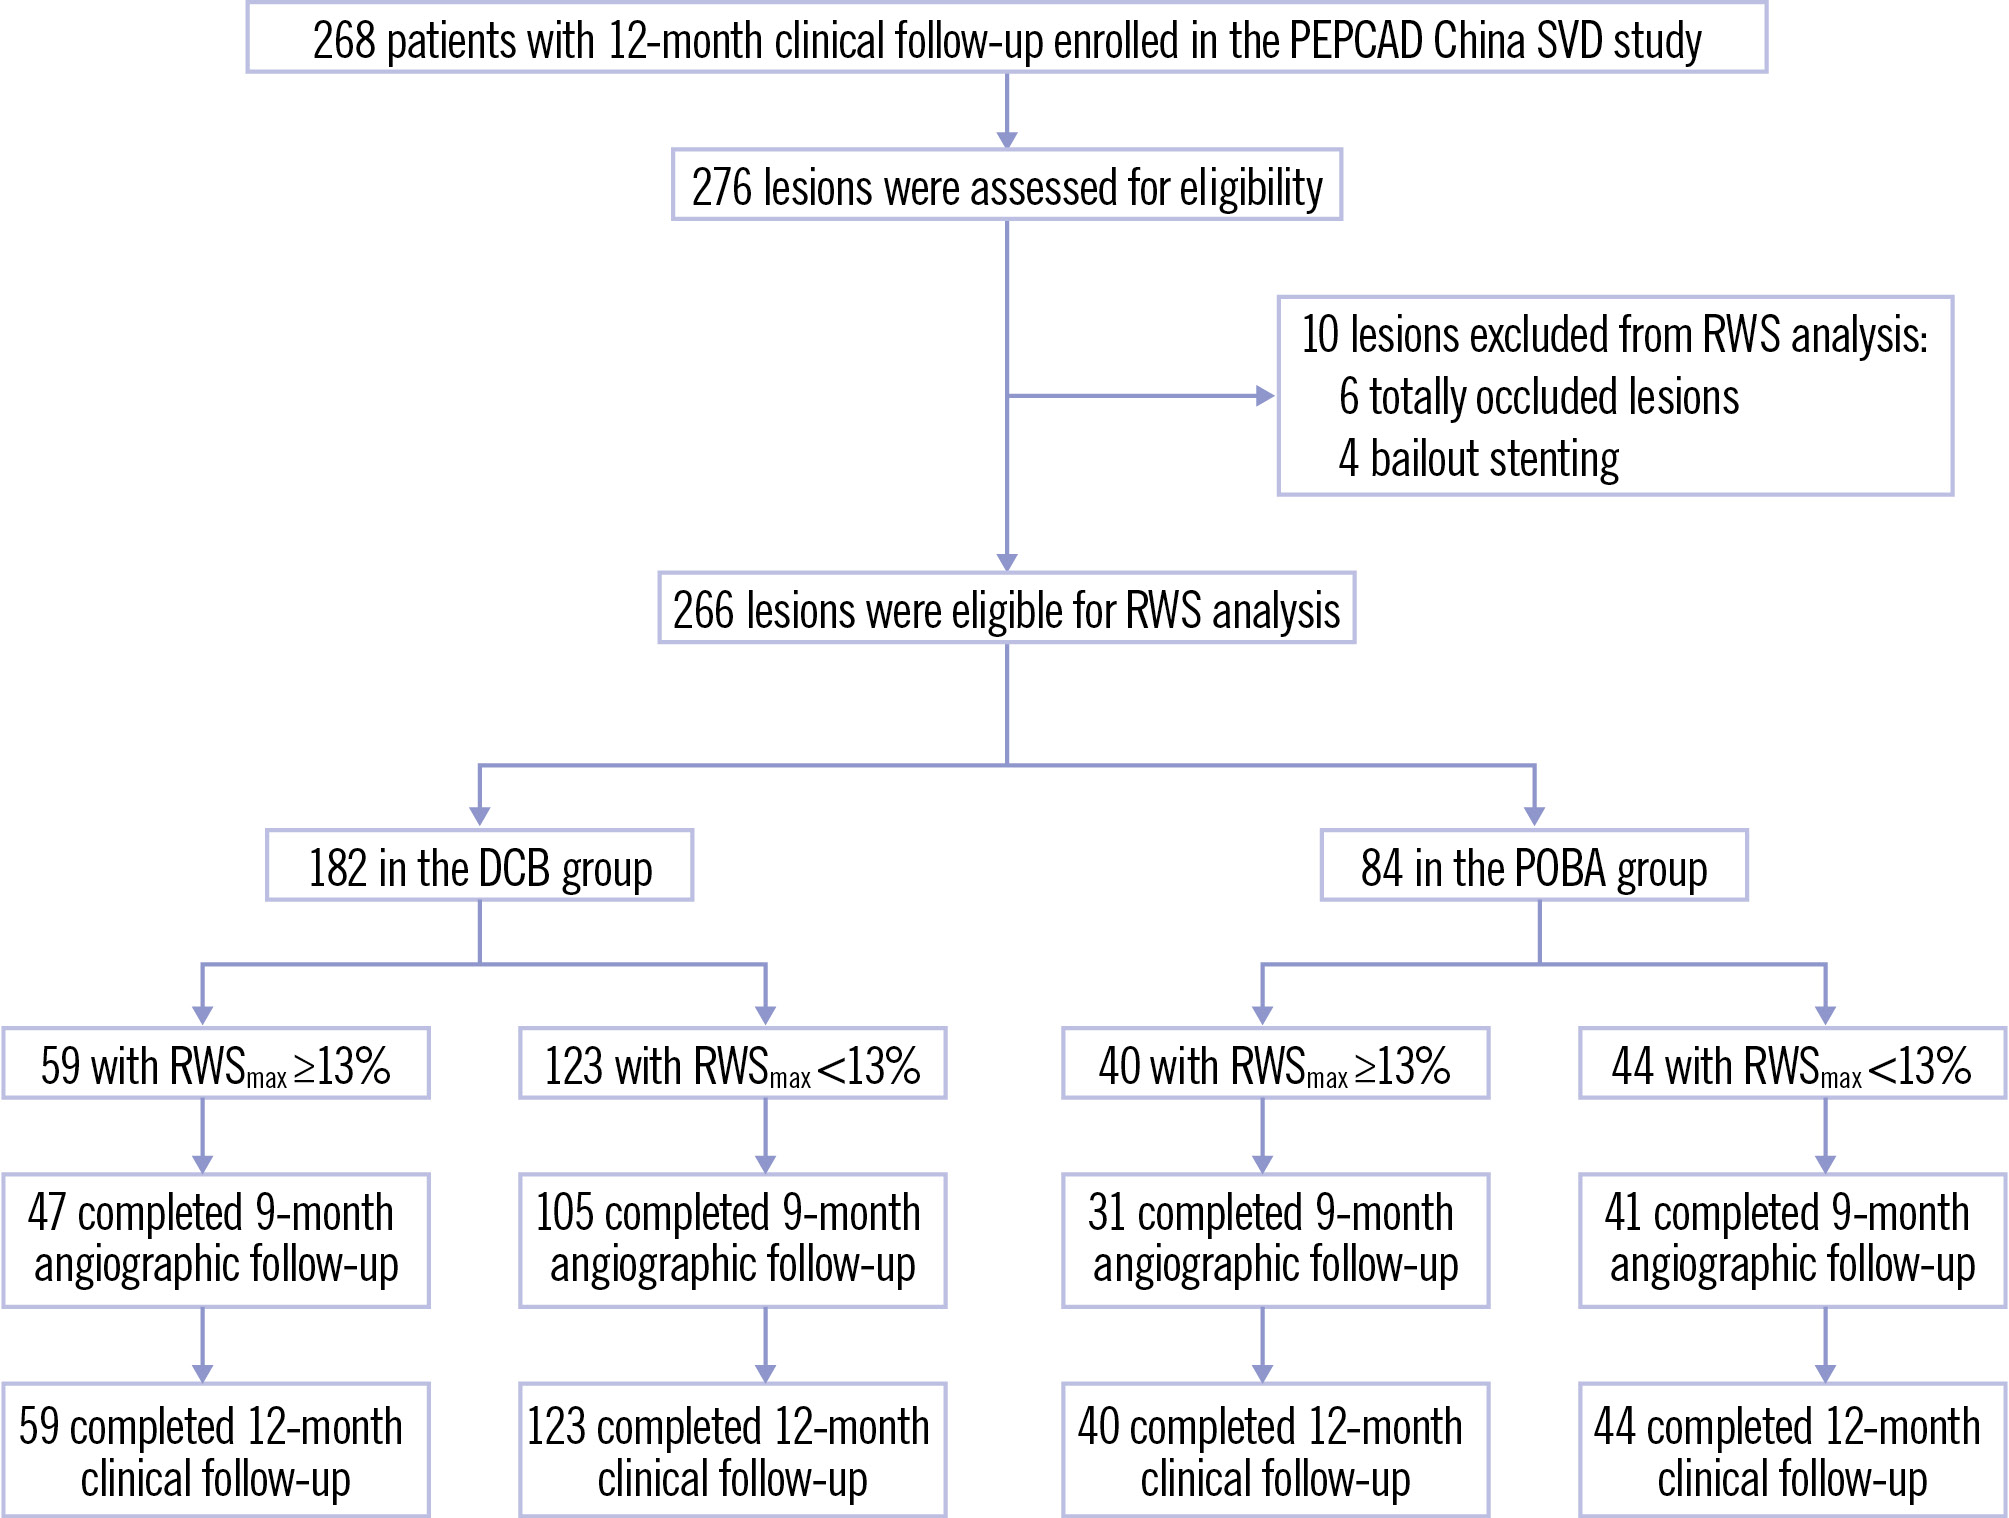
Figure 1. Flowchart of the study. DCB: drug-coated balloon; POBA: plain old balloon angioplasty; RWS: radial wall strain; RWSmax: maximum radial wall strain; SVD: small vessel disease
RWS analysis
The distribution of RWSmax in the interrogated lesions fit the Gaussian distribution in both the DCB and POBA groups (Supplementary Figure 2). In the DCB group, the lesion RWSmax ranged from 1% to 21% (mean 11±4%), whereas in the POBA group, it ranged from 1% to 22% (mean 12±5%). Lesion RWSmax was comparable between lesions included in the final analysis and those with bailout stenting (Supplementary Table 1). As reported in a recent validation study12, RWSmax ≥13% was the optimal cutoff to identify OCT-defined plaque vulnerability. In the DCB group, 59 lesions in 59 patients had RWSmax ≥13% and 123 lesions in 118 patients had RWSmax <13%, whereas in the POBA group, 40 lesions in 40 patients had RWSmax ≥13% and 44 lesions in 43 patients had RWSmax <13% (Figure 1). The intraclass correlation coefficients for intra- and interobserver variability in repeated RWS measurement in SVD lesions were 0.909 (95% CI: 0.815-0.956; p<0.001) and 0.883 (95% CI: 0.767-0.943; p<0.001), respectively (Supplementary Figure 3).
Baseline clinical characteristics
As shown in Table 1, the baseline clinical characteristics were well balanced between patients with and without lesion RWSmax ≥13% in both the DCB and POBA groups. However, in the latter group, patients with lesion RWSmax ≥13% were more often treated with clopidogrel and an angiotensin-converting enzyme inhibitor/angiotensin II receptor blocker, and less often with ticagrelor, compared with those with lesion RWSmax <13%.
Table 1. Patient clinical characteristics.
| DCB group | POBA group | |||||
|---|---|---|---|---|---|---|
| RWSmax≥13% (N=59) | RWSmax<13% (N=118) | p-value | RWSmax≥13% (N=40) | RWSmax<13% (N=43) | p-value | |
| Age, years | 63.76±9.33 | 63.21±8.83 | 0.70 | 62.58±9.42 | 62.91±7.54 | 0.86 |
| Sex | 0.59 | >0.99 | ||||
| Male | 45 (76.3) | 84 (71.8) | 28 (70.0) | 30 (69.8) | ||
| Female | 14 (23.7) | 33 (28.2) | 12 (30.0) | 13 (30.2) | ||
| Body mass index, kg/m2 | 25.50±2.68 | 25.10±3.31 | 0.43 | 25.31±2.91 | 25.02±3.25 | 0.67 |
| Current smoker | 13 (22.0) | 30 (25.6) | 0.71 | 10 (25.0) | 11 (25.6) | >0.99 |
| Family history of coronary artery disease | 5 (8.5) | 10 (8.5) | >0.99 | 1 (2.5) | 2 (4.7) | >0.99 |
| Hypertension | 43 (72.9) | 81 (69.2) | 0.73 | 32 (80.0) | 27 (62.8) | 0.096 |
| Dyslipidaemia | 15 (25.4) | 28 (23.9) | 0.85 | 11 (27.5) | 6 (14.0) | 0.17 |
| Diabetes | 18 (30.5) | 39 (33.3) | 0.74 | 13 (32.5) | 20 (46.5) | 0.26 |
| Peripheral artery disease | 0 (0) | 4 (3.4) | 0.30 | 2 (5.0) | 0 (0) | 0.23 |
| Previous myocardial infarction | 8 (13.6) | 19 (16.2) | 0.83 | 5 (12.5) | 3 (7.0) | 0.47 |
| Previous percutaneous coronary intervention | 24 (40.7) | 52 (44.4) | 0.75 | 15 (37.5) | 20 (46.5) | 0.51 |
| Previous coronary artery bypass grafting | 0 (0) | 1 (0.9) | >0.99 | 0 (0) | 0 (0) | >0.99 |
| Previous stroke | 7 (11.9) | 14 (12.0) | >0.99 | 7 (17.5) | 6 (14.0) | 0.77 |
| Clinical presentation | 0.84 | 1.00 | ||||
| Asymptomatic ischaemia | 5 (8.5) | 13 (11.1) | 2 (5.0) | 2 (4.7) | ||
| Stable angina | 16 (27.1) | 29 (24.8) | 11 (27.5) | 12 (27.9) | ||
| Unstable angina | 38 (64.4) | 75 (64.1) | 27 (67.5) | 29 (67.4) | ||
| Left ventricular ejection fraction, % | 62.00±10.54 | 63.52±8.53 | 0.33 | 66.36±5.83 | 62.87±7.38 | 0.024 |
| Medication | ||||||
| Aspirin | 57 (96.6) | 116 (98.3) | 0.26 | 38 (95.0) | 42 (97.7) | 0.61 |
| Clopidogrel | 42 (71.2) | 94 (79.7) | 0.19 | 37 (92.5) | 30 (69.8) | 0.012 |
| Ticagrelor | 17 (28.8) | 23 (19.5) | 0.19 | 3 (7.5) | 13 (30.2) | 0.012 |
| Cilostazol | 4 (6.8) | 2 (1.7) | 0.098 | 2 (5.0) | 1 (2.3) | 0.61 |
| Oral anticoagulation | 4 (6.8) | 2 (1.7) | 0.098 | 1 (2.5) | 3 (7.0) | 0.62 |
| Statin | 58 (98.3) | 111 (94.1) | 0.43 | 39 (97.5) | 42 (97.7) | >0.99 |
| ACEi/ARB | 39 (66.1) | 69 (58.5) | 0.41 | 32 (80.0) | 25 (58.1) | 0.036 |
| β-blocker | 39 (66.1) | 87 (73.7) | 0.29 | 28 (70.0) | 28 (65.1) | 0.65 |
| Calcium channel blocker | 25 (42.4) | 47 (39.8) | 0.87 | 19 (47.5) | 13 (30.2) | 0.12 |
| Nitrate | 26 (44.1) | 47 (39.8) | 0.63 | 16 (40.0) | 13 (30.2) | 0.37 |
| Proton pump inhibitor | 30 (50.8) | 46 (39.0) | 0.15 | 19 (47.5) | 23 (53.5) | 0.66 |
| Values are expressed as mean±standard deviation or n (%). P-values were calculated using the Student’s t-tests, Fisher’s exact tests, or chi-squared tests, as appropriate. ACEi: angiotensin-converting enzyme inhibitor; ARB: angiotensin II receptor blocker; DCB: drug-coated balloon; POBA: plain old balloon angioplasty; RWSmax: maximum radial wall strain | ||||||
Baseline lesion and procedural characteristics
As shown in Table 2, the baseline lesion and procedural characteristics (including target vessel, lesion complexity, and lesion predilation) were well balanced between patients with and without lesion RWSmax ≥13% in both the DCB and POBA groups.
Table 2. Lesion and procedural characteristics.
| DCB group | POBA group | |||||
|---|---|---|---|---|---|---|
| RWSmax≥13% (N=59) | RWSmax <13% (N=123) | p-value | RWSmax ≥13% (N=40) | RWSmax <13% (N=44) | p-value | |
| Target vessel | 0.76 | 0.27 | ||||
| Left anterior descending artery | 15 (25.4) | 37 (30.1) | 12 (30.0) | 7 (15.9) | ||
| Left circumflex artery | 30 (50.8) | 56 (45.5) | 19 (47.5) | 23 (52.3) | ||
| Right coronary artery | 14 (23.7) | 30 (24.4) | 9 (22.5) | 14 (31.8) | ||
| ACC/AHA lesion classification | 0.66 | 0.10 | ||||
| Type A | 0 (0) | 2 (1.6) | 0 (0) | 2 (4.5) | ||
| Type B1 | 23 (39.0) | 40 (32.5) | 7 (17.5) | 17 (38.6) | ||
| Type B2 | 32 (54.2) | 72 (58.5) | 29 (72.5) | 24 (54.5) | ||
| Type C | 4 (6.8) | 9 (7.3) | 4 (10.0) | 1 (2.3) | ||
| Long lesion | 3 (5.1) | 7 (5.7) | >0.99 | 4 (10.0) | 1 (2.3) | 0.19 |
| Eccentricity | 57 (96.6) | 121 (98.4) | 0.60 | 40 (100) | 42 (95.5) | 0.50 |
| Tortuosity | 0 (0) | 1 (0.8) | >0.99 | 0 (0) | 0 (0) | NA |
| Angulation | 0 (0) | 0 (0) | NA | 0 (0) | 0 (0) | NA |
| Irregular contour | 0 (0) | 1 (0.8) | >0.99 | 0 (0) | 0 (0) | NA |
| Severe calcification | 0 (0) | 0 (0) | NA | 0 (0) | 0 (0) | NA |
| Bifurcation | 8 (13.6) | 30 (24.4) | 0.12 | 10 (25.0) | 9 (20.5) | 0.79 |
| Preprocedural TIMI flow | 0.62 | 0.32 | ||||
| 0 | 0 (0) | 0 (0) | 0 (0) | 0 (0) | ||
| 1 | 1 (1.7) | 3 (2.4) | 1 (2.5) | 0 (0) | ||
| 2 | 3 (5.1) | 3 (2.4) | 1 (2.5) | 0 (0) | ||
| 3 | 55 (93.2) | 117 (95.1) | 38 (95.0) | 44 (100) | ||
| Predilation performed | ||||||
| Balloon diameter, mm | 2.12±0.22 | 2.16±0.27 | 0.33 | 2.14±0.25 | 2.15±0.26 | 0.77 |
| Balloon length, mm | 15.43±3.28 | 14.96±3.25 | 0.36 | 15.30±3.12 | 15.11±3.14 | 0.79 |
| Balloon pressure, atm | 9.09±2.36 | 9.32±2.30 | 0.53 | 9.80±2.66 | 8.98±2.70 | 0.17 |
| Successful predilation | 59 (100) | 123 (100) | >0.99 | 40 (100) | 44 (100) | >0.99 |
| DCB used for treatment | ||||||
| Balloon diameter, mm | 2.19±0.26 | 2.23±0.27 | 0.38 | 2.29±0.28 | 2.25±0.29 | 0.49 |
| Balloon length, mm | 19.22±3.80 | 18.54±3.61 | 0.24 | 18.38±4.44 | 16.98±4.25 | 0.15 |
| Balloon pressure, atm | 8.40±1.79 | 8.65±2.08 | 0.44 | 8.85±2.60 | 9.05±2.74 | 0.74 |
| Duration of dilation, s | 62.60±12.82 | 62.65±17.33 | 0.98 | 46.03±22.66 | 53.79±47.88 | 0.36 |
| Values are expressed as mean±standard deviation or n (%). P-values were calculated using the Student’s t-tests, Fisher’s exact tests, or chi-squared tests, as appropriate. DCB: drug-coated balloon; NA: not applicable; POBA: plain old balloon angioplasty; RWSmax: maximum radial wall strain; TIMI: Thrombolysis in Myocardial Infarction | ||||||
Correlations between RWSmax and in-segment LLL
As shown in Supplementary Figure 4, the RWSmax in the interrogated lesions was significantly correlated with in-segment LLL in the DCB group (Pearson r=0.2738; p=0.0006).
Angiographic outcomes
The preprocedural, postprocedural, and 9-month follow-up angiographic analyses are shown in Table 3. In-segment MLD, RVD, %DS, lesion length before and after the index procedure, and acute gain were comparable between lesions with RWSmax ≥13% and <13%. However, in the POBA group, the preprocedural in-segment %DS was higher and the lesion length was longer in patients with lesion RWSmax ≥13% than in those with lesion RWSmax <13%. A total of 152 (83.5%) and 72 (85.7%) lesions in the DCB and POBA groups, respectively, completed the 9-month angiographic follow-up. The cumulative distribution curve for the in-segment LLL in DCB-treated lesions is presented in Supplementary Figure 5. No significant differences in the lesion or procedural characteristics were found between lesions with the highest quartile of in-segment LLL and those with the lower three quartiles, except the RWSmax (Supplementary Table 2). The mean balloon diameter was significantly different, but the DCB diameter/RVD ratio was comparable. In the DCB group, the primary endpoint of in-segment LLL was considerably higher in lesions of RWSmax ≥13% when compared with those of RWSmax <13% (0.24±0.53 mm vs 0.05±0.16 mm; difference 0.19 mm; 95% CI: 0.08-0.30; p=0.0009) (Central illustration). Among different subgroups, there were no significant interactions found for the in-segment LLL (all pinteraction>0.05) (Supplementary Table 3). Similarly, lesions of RWSmax ≥13% had higher %DS (32.51±24.36% vs 21.90±12.87%; p=0.0006) and greater binary restenosis (14.9% vs 1.9%; p=0.0040) than those of RWSmax <13%, whereas the RVD was comparable between those with and without RWSmax ≥13%. In the DCB arm, the change in %DS between post-procedure and follow-up was significantly higher in the RWSmax ≥13% group than that in the RWSmax <13% group (12.37±25.50% vs 4.81±12.60%; p=0.016), while in the POBA arm, the difference did not reach statistical significance (19.26±25.23% vs 9.52±16.23%; p=0.051).
Table 3. QCA and μQFR results in the DCB and POBA groups, stratified by RWSmax.
| DCB group | POBA group | |||||
|---|---|---|---|---|---|---|
| RWSmax≥13% (N=59) | RWSmax<13% (N=123) | p-value | RWSmax≥13% (N=40) | RWSmax<13% (N=44) | p-value | |
| Preprocedure; in-segment | ||||||
| Minimal luminal diameter, mm | 0.65±0.27 | 0.69±0.28 | 0.27 | 0.63±0.27 | 0.73±0.27 | 0.093 |
| Reference vessel diameter, mm | 1.99±0.26 | 2.07±0.34 | 0.10 | 2.11±0.39 | 2.09±0.33 | 0.81 |
| Diameter stenosis, % | 67.76±12.99 | 66.91±11.93 | 0.67 | 70.22±11.31 | 65.15±10.92 | 0.040 |
| Lesion length, mm | 11.62±4.68 | 11.91±4.61 | 0.70 | 13.88±5.47 | 11.15±4.14 | 0.011 |
| μQFR | 0.85±0.14 | 0.87±0.12 | 0.39 | 0.81±0.17 | 0.87±0.13 | 0.11 |
| Post-procedure; in-segment | ||||||
| Minimal luminal diameter, mm | 1.48±0.34 | 1.57±0.28 | 0.070 | 1.56±0.37 | 1.67±0.27 | 0.12 |
| Reference vessel diameter, mm | 1.89±0.32 | 1.91±0.35 | 0.76 | 1.97±0.40 | 1.99±0.31 | 0.75 |
| Diameter stenosis, % | 21.02±15.15 | 16.94±12.93 | 0.063 | 20.66±14.29 | 15.47±11.56 | 0.070 |
| Acute gain, mm | 0.84±0.36 | 0.87±0.30 | 0.53 | 0.92±0.31 | 0.94±0.32 | 0.85 |
| μQFR | 0.91±0.08 | 0.90±0.10 | 0.82 | 0.87±0.11 | 0.91±0.08 | 0.036 |
| 9-month follow-upa; in-segment | ||||||
| Number of lesions | 47 | 105 | 31 | 41 | ||
| Minimal luminal diameter, mm | 1.27±0.48 | 1.51±0.27 | 0.0001 | 1.21±0.49 | 1.47±0.36 | 0.011 |
| Reference vessel diameter, mm | 1.91±0.32 | 1.96±0.34 | 0.39 | 1.95±0.39 | 1.99±0.33 | 0.60 |
| Diameter stenosis, % | 32.51±24.36 | 21.90±12.87 | 0.0006 | 39.58±23.56 | 25.19±15.59 | 0.0027 |
| Difference in %DS between post-procedure and follow-up | 12.37±25.50 | 4.81±12.60 | 0.016 | 19.26±25.23 | 9.52±16.23 | 0.051 |
| Binary restenosis | 7 (14.9) | 2 (1.9) | 0.0040 | 11 (35.5) | 4 (9.8) | 0.017 |
| In-segment late lumen loss, mm | 0.24±0.53 | 0.05±0.16 | 0.0009 | 0.32±0.48 | 0.21±0.27 | 0.23 |
| μQFR | 0.86±0.11 | 0.88±0.12 | 0.41 | 0.79±0.13 | 0.89±0.09 | 0.0007 |
| Values are expressed as mean±standard deviation or n (%). P-values were calculated using the Student’s t-tests or Fisher’s exact tests, as appropriate for the comparisons between lesions with and without RWSmax ≥13%. aA total of 152 and 72 lesions in the DCB and POBA groups, respectively, completed the 9-month angiographic follow-up. DCB: drug-coated balloon; DS: diameter stenosis; POBA: plain old balloon angioplasty; QCA: quantitative coronary angiography; RWSmax: maximum radial wall strain; μQFR: Murray law-based quantitative flow ratio | ||||||
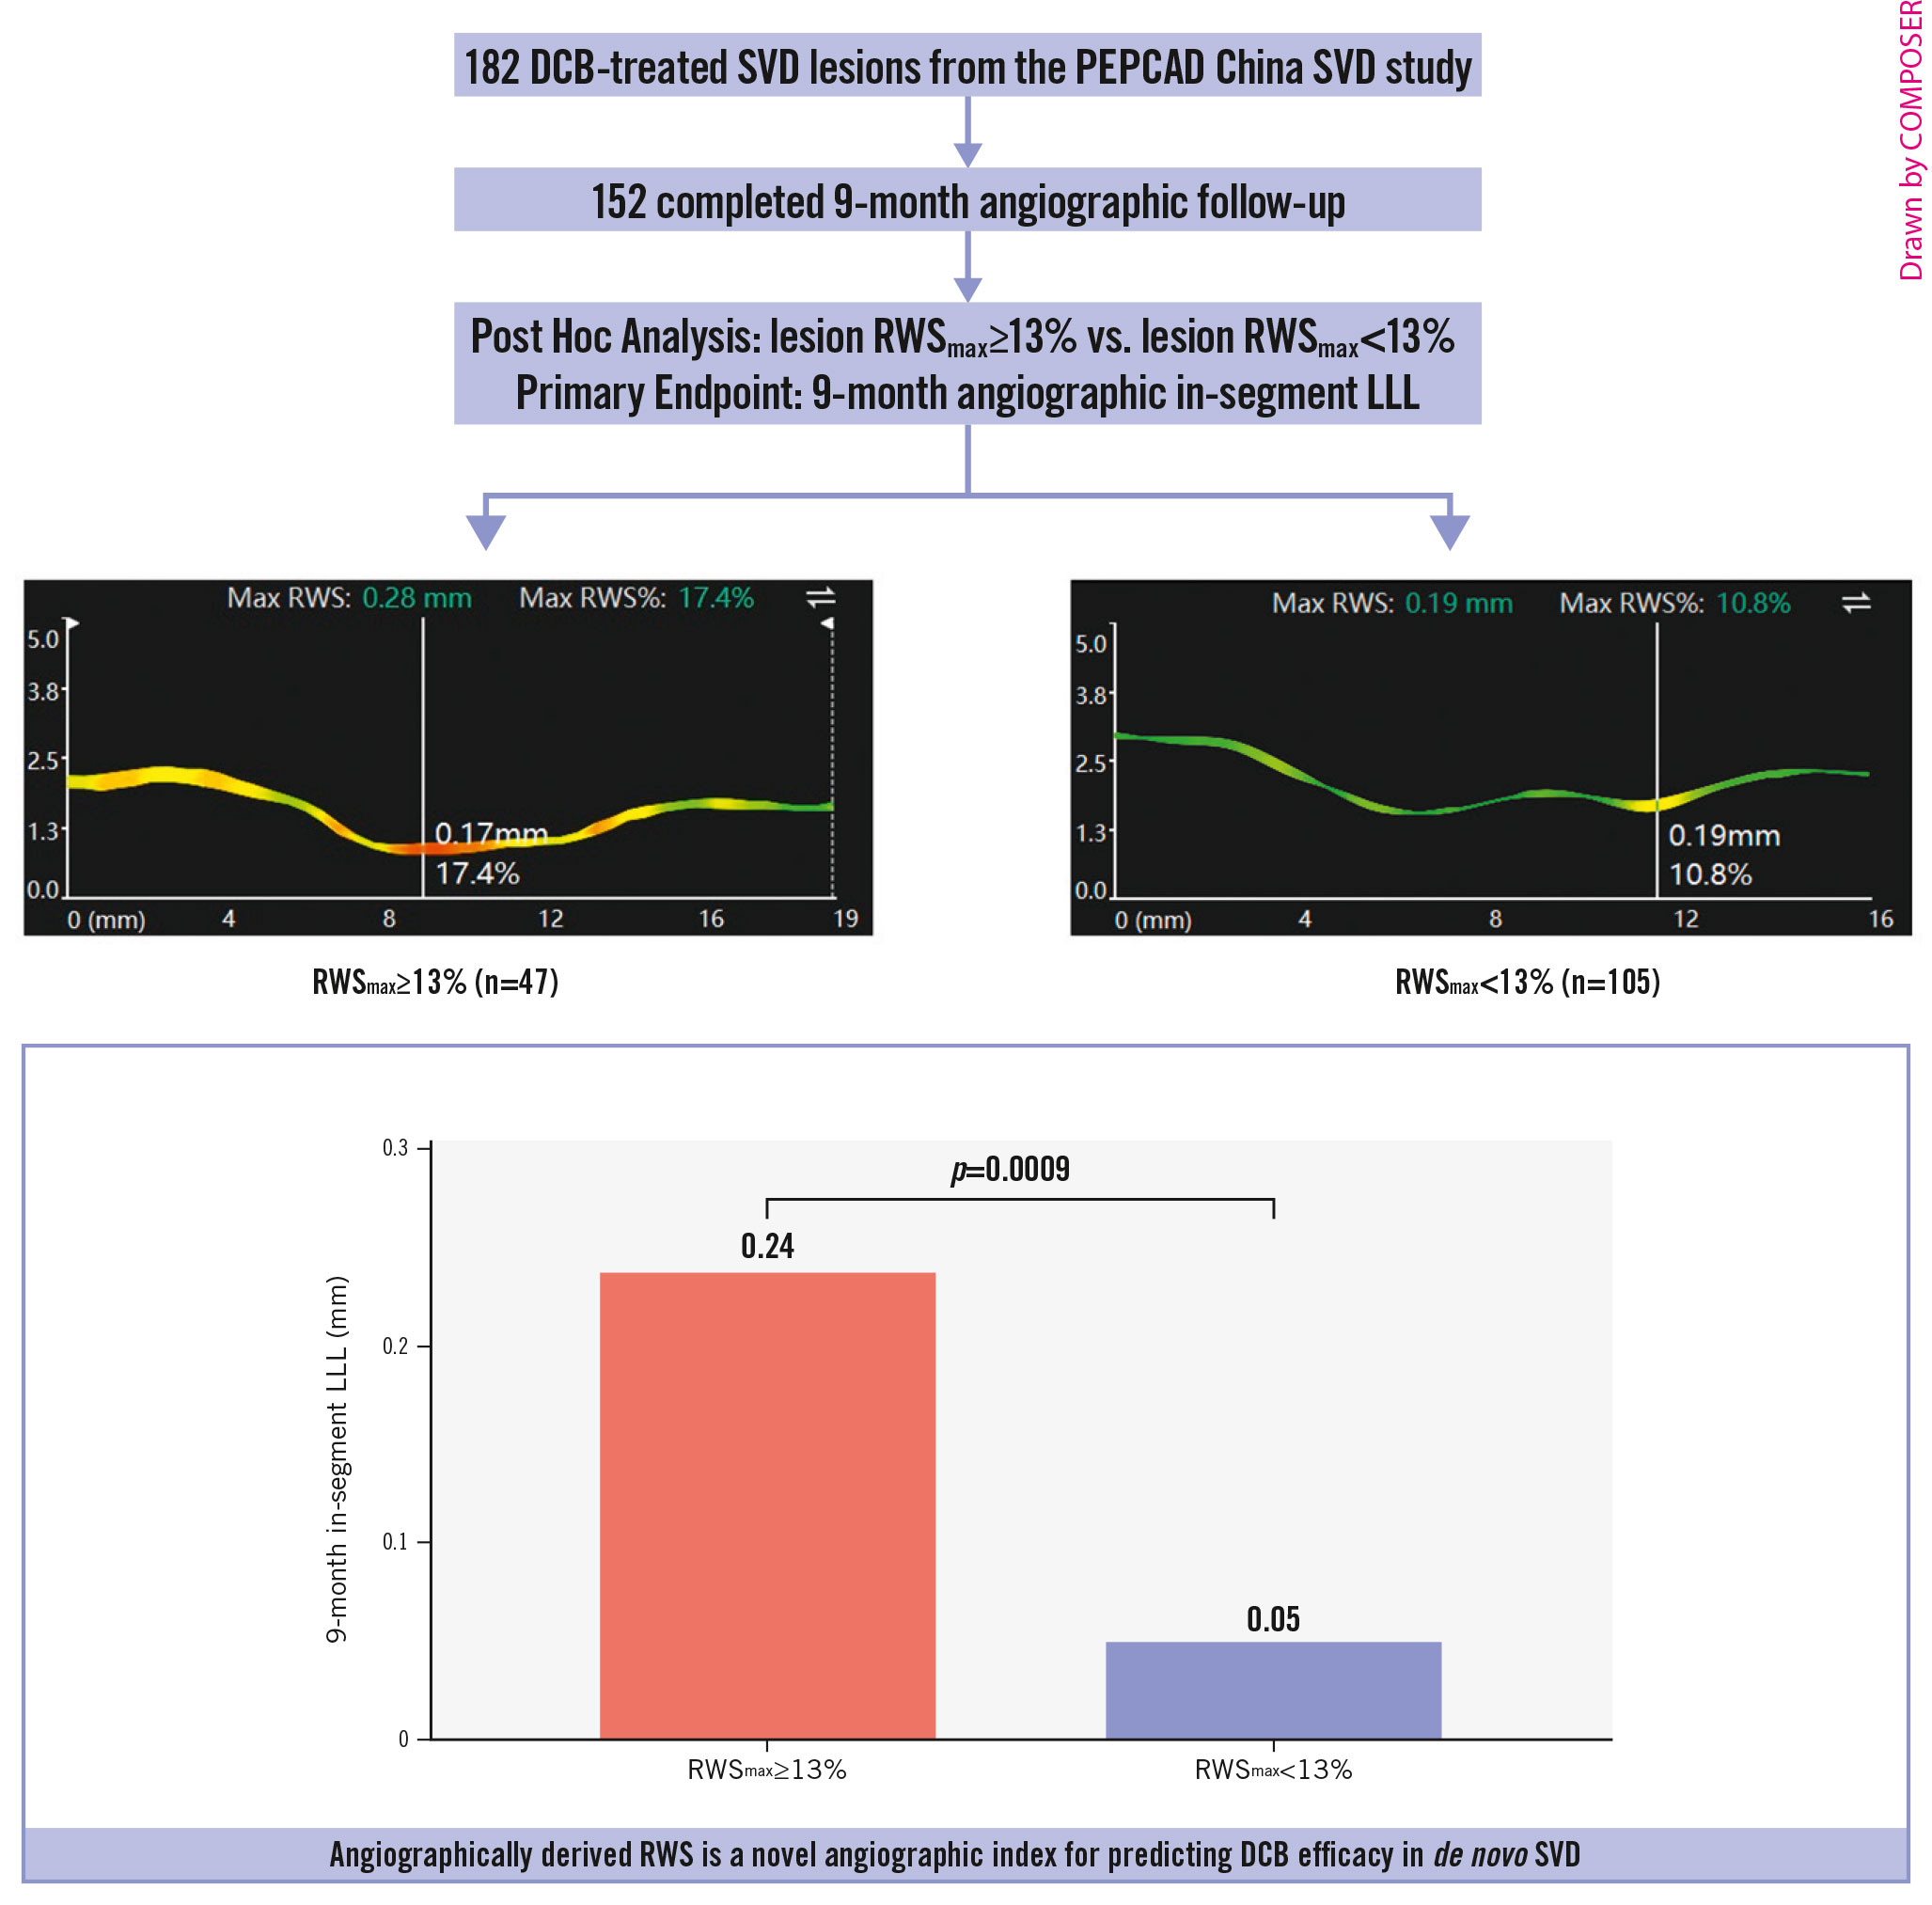
Central Illustration. A) Study design; B) in-segment LLL at 9-month follow-up according to RWSmax. DCB: drug-coated balloon; LLL: late lumen loss; RWS: radial wall strain; RWSmax: maximum radial wall strain; SVD: small vessel disease
Relationship between angiographic acute gain versus in-segment LLL
The correlations between angiographic acute gain and in-segment LLL were significant and positive in both the RWSmax ≥13% group (slope 0.80, intercept –0.43; p<0.001) and the RWSmax <13% group (slope 0.14; intercept –0.07; p=0.007) in the DCB arm (Supplementary Figure 6A), with a significant interaction (pinteraction<0.001). In the POBA arm (Supplementary Figure 6B), the slope and intercept of the two regression lines were comparable, without significant interaction with RWSmax (pinteraction=0.39).
μQFR
In the DCB arm (Table 3), μQFR was comparable between the RWSmax ≥13% group and the RWSmax <13% group before and after the index procedure and at the 9-month angiographic follow-up (allp>0.05). In the POBA arm (Table 3), μQFR was comparable before the index procedure between the RWSmax ≥13% group and the RWSmax <13% group. After the procedure, μQFR was significantly lower in lesions with RWSmax ≥13% than in those with RWSmax <13% (0.87±0.11 vs 0.91±0.08; p=0.036); this was also observed at the 9-month angiographic follow-up (0.79±0.13 vs 0.89±0.09; p=0.0007).
Clinical outcomes
All patients completed the 12-month clinical follow-up. In the DCB group, six lesions with RWSmax ≥13% in six patients were associated with lesion-related events (no cardiac deaths, one target vessel MI, five clinically driven TLRs), whereas two lesions with RWSmax <13% in two patients were associated with lesion-related events (no cardiac deaths, one target vessel MI, one clinically driven TLR). Lesions of RWSmax ≥13% were associated with more TLF events than those of RWSmax <13% (10.2% vs 1.6%, unadjusted HR 6.51, 95% CI: 1.31-32.26; p=0.022) (Figure 2A), largely influenced by significantly higher rates in clinically driven TLR (8.5% vs 0.8%, unadjusted HR 10.93, 95% CI: 1.28-93.60; p=0.029) (Figure 2D). We conducted an exploratory analysis to determine the optimal cutoff value of RWSmax for predicting 12-month TLF in DCB-treated lesions. Through lesion-level receiver operating characteristic curve analysis (Figure 3), we found that RWSmax demonstrated a good predictive performance for TLF during the 12-month follow-up in DCB-treated lesions (AUC 0.718; 95% CI: 0.551-0.885; p=0.037). The optimal cutoff value of RWSmax for predicting TLF was ≥13%, with a sensitivity of 75.0% (95% CI: 40.9-95.6%) and a specificity of 69.5% (95% CI: 62.3-75.9%) (Supplementary Table 4). It was the same as the optimal cutoff value of RWSmax for identifying an OCT-derived lipid-to-cap ratio>0.331218. 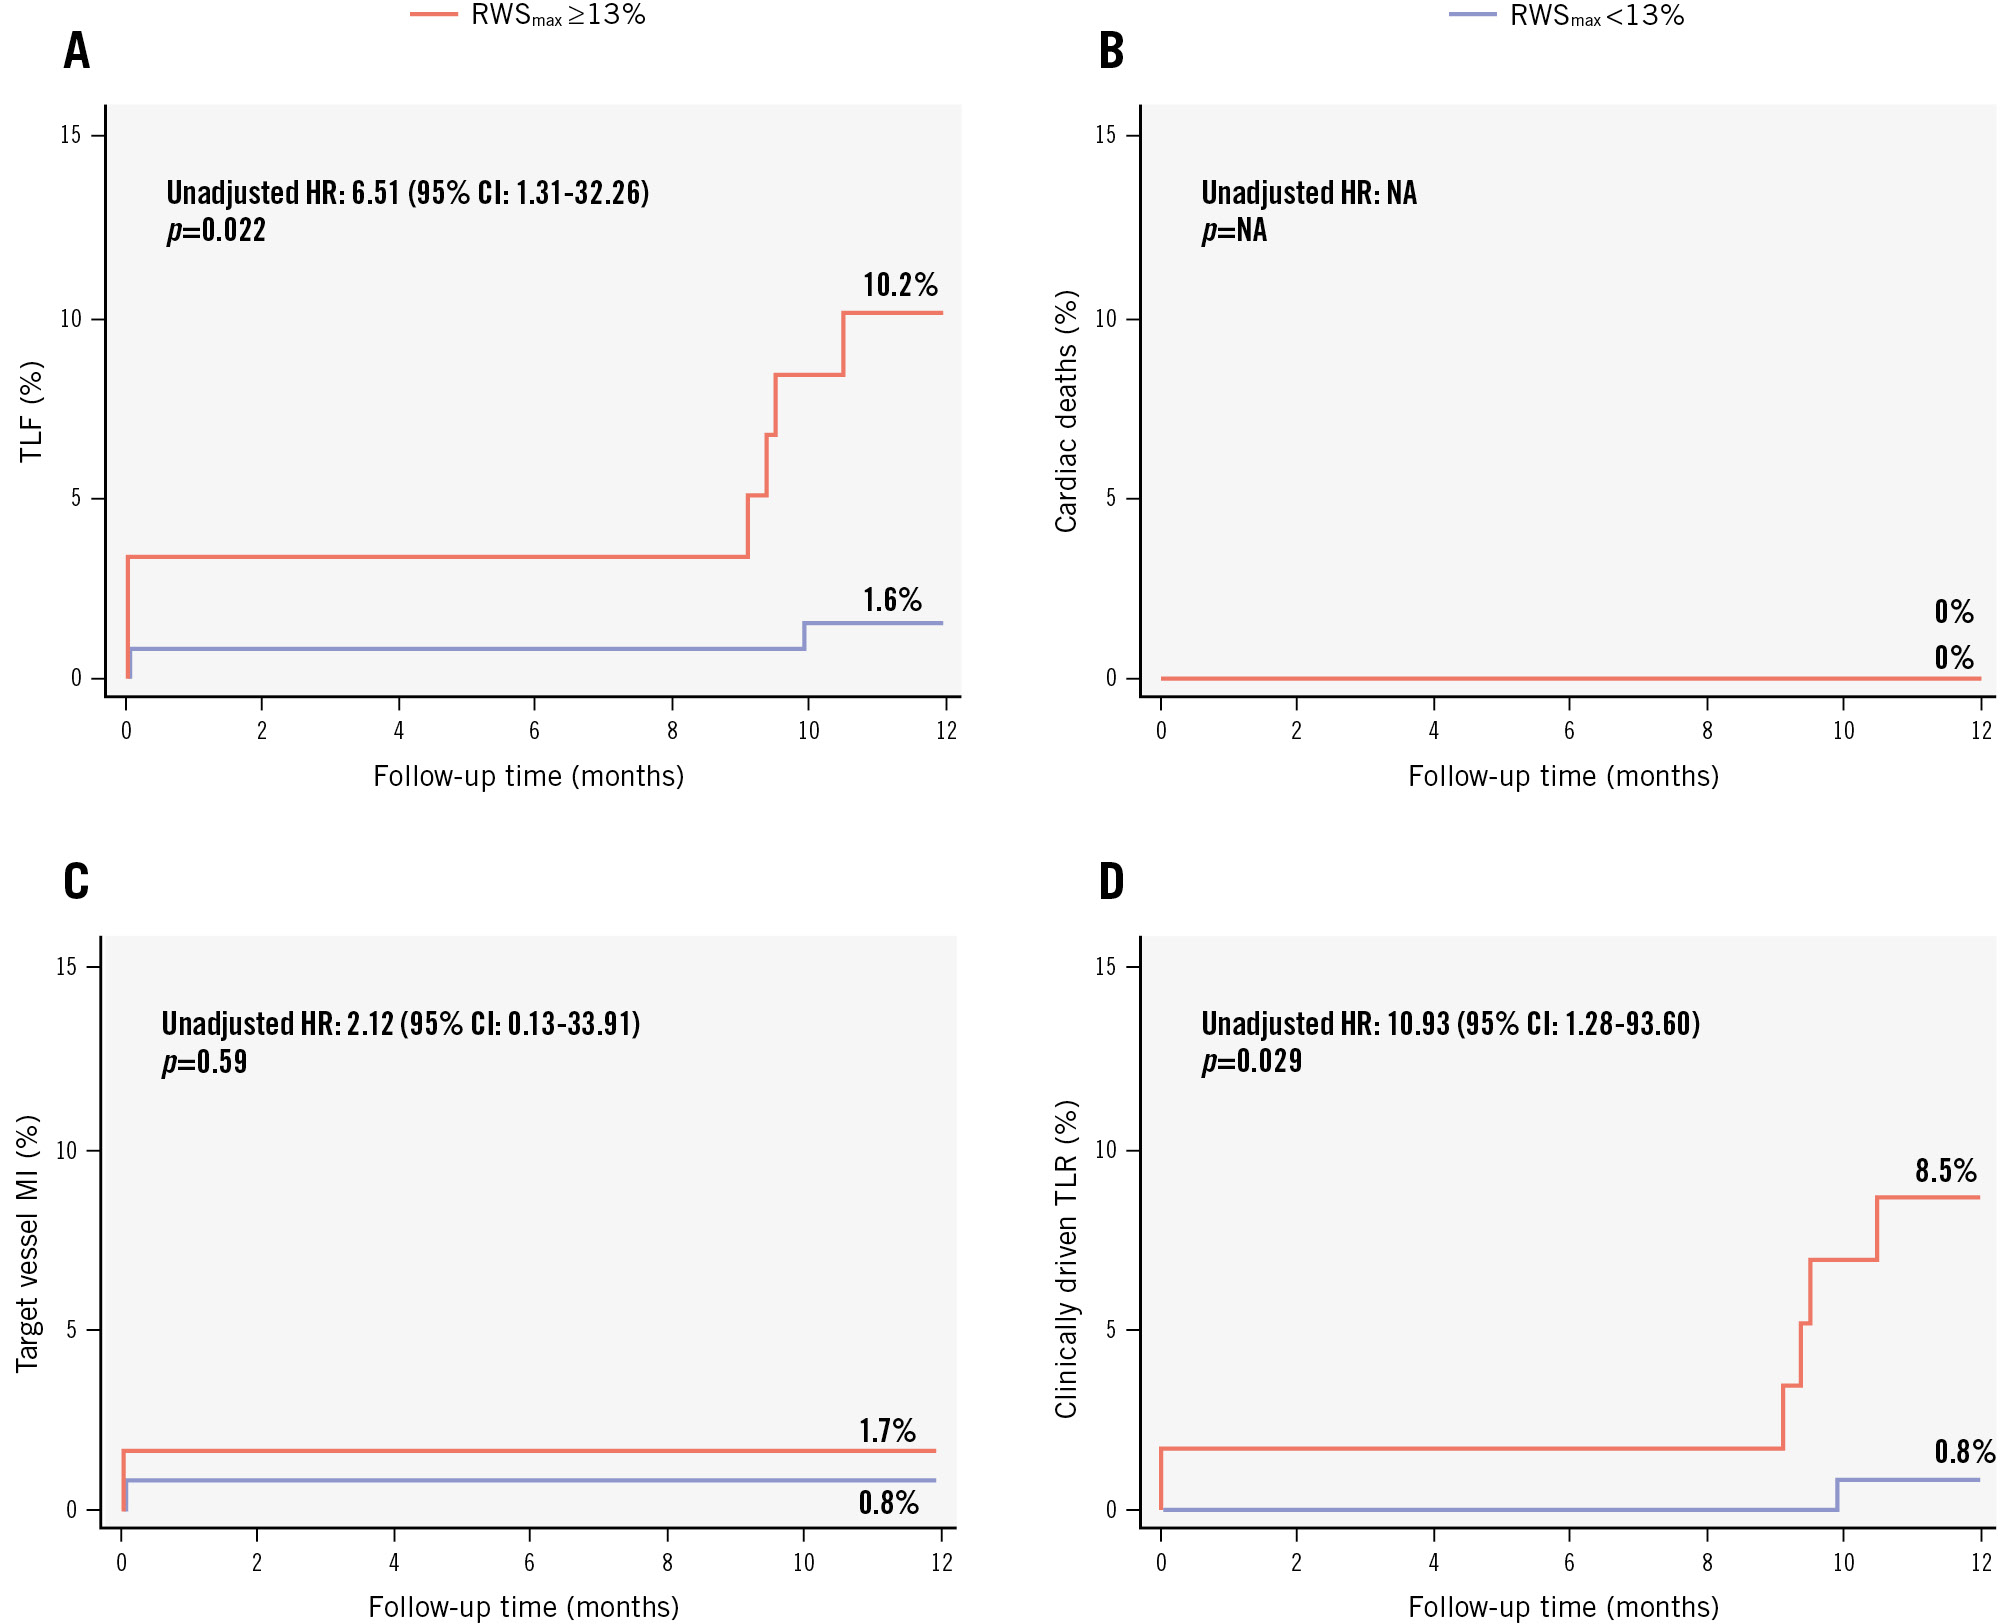
Figure 2. Event curves for lesion-related events in lesions with and without RWSmax ≥13% in the DCB group. A) TLF; (B) cardiac deaths; (C) target vessel MI; and (D) clinically driven TLR. TLF was defined as the composite of cardiac death, target vessel myocardial infarction, and clinically driven TLR. CI: confidence interval; DCB: drug-coated balloon; HR: hazard ratio; MI: myocardial infarction; NA: not applicable; RWSmax: maximum radial wall strain; TLF: target lesion failure; TLR: target lesion revascularisation
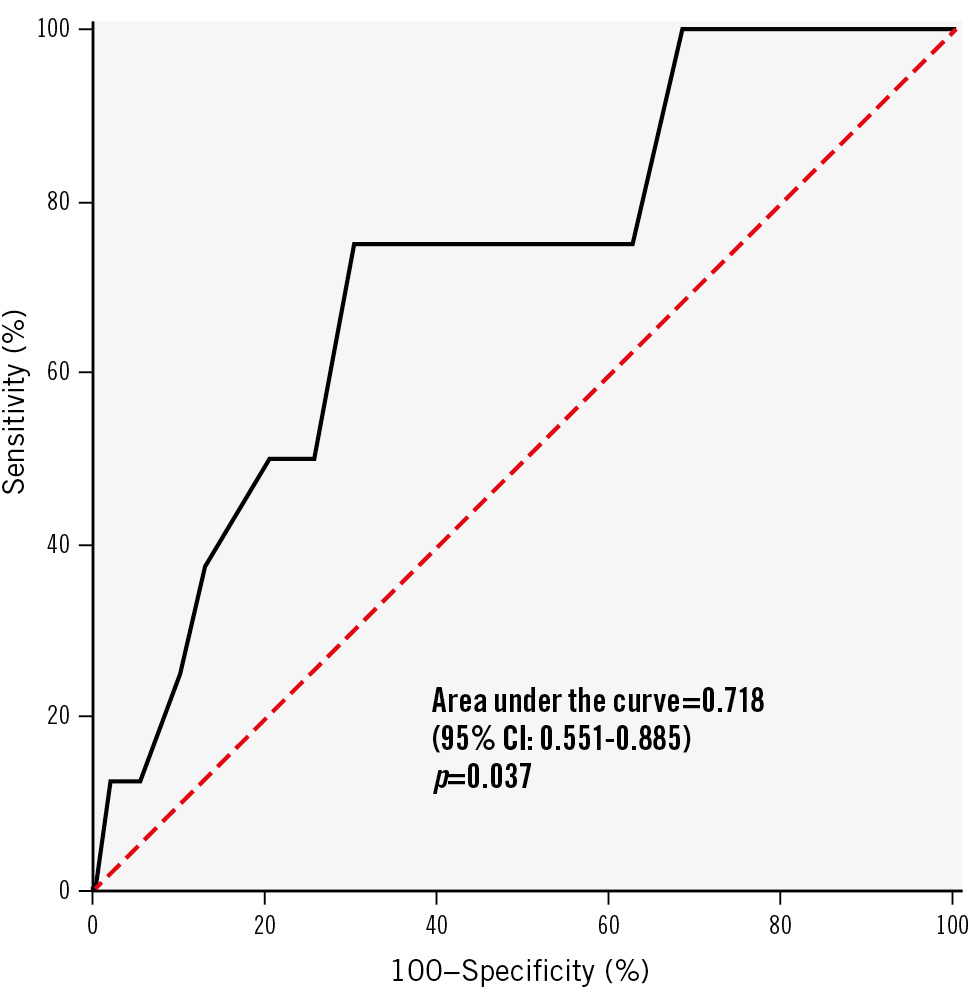
Figure 3. Receiver operating characteristic curve analysis. The area under the curve was 0.718 (95% CI: 0.551-0.885; p=0.037) for RWSmax. TLF was defined as the composite of cardiac death, target vessel MI, and clinically driven TLR. CI: confidence interval; MI: myocardial infarction; RWSmax: maximum radial wall strain; TLF: target lesion failure; TLR: target lesion revascularisation
Influence of RWS on DCB or POBA efficacy
Among all the lesions of RWSmax <13%, those treated with a DCB had significantly lower in-segment LLL (0.05±0.16 mm vs 0.21±0.27 mm; p<0.0001) (Figure 4A) and less binary restenosis (1.9% vs 9.8%; p=0.035) (Figure 4B) than those treated with POBA. However, no significant differences were observed for in-segment LLL (0.24±0.53 mm vs 0.32±0.48 mm; p=0.49) or binary restenosis (14.9% vs 35.5%; p=0.064) among lesions of RWSmax ≥13% between the DCB and POBA groups. 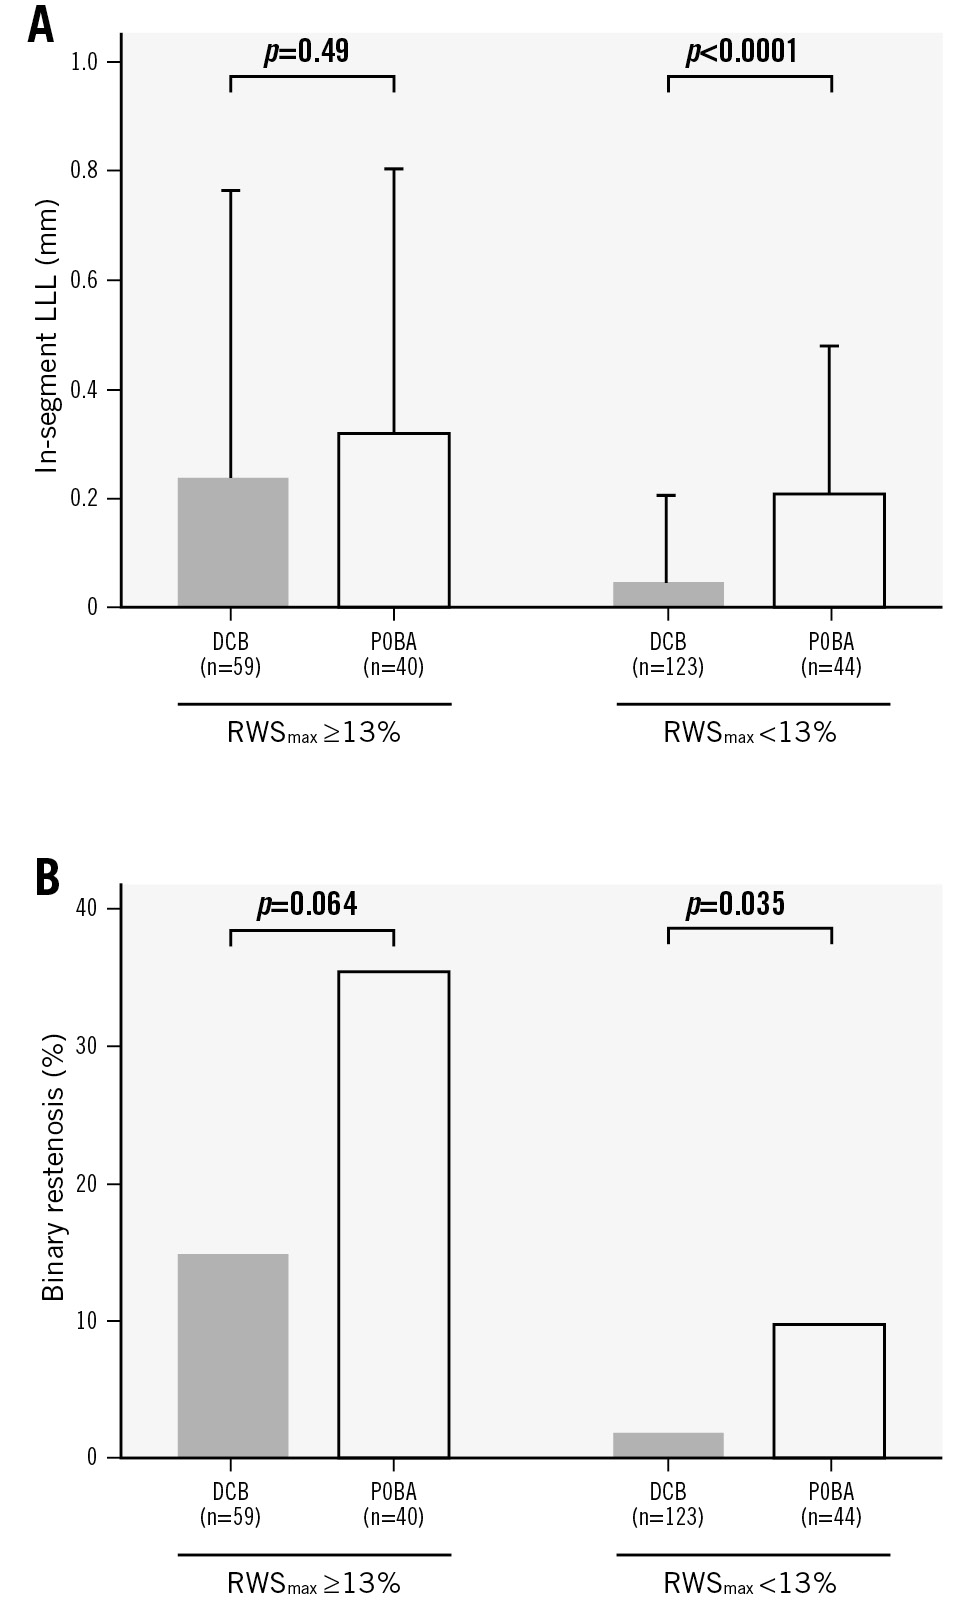
Figure 4. Influence of RWS on DCB and POBA efficacy. A) In-segment LLL and (B) binary restenosis. DCB: drug-coated balloon; LLL: late lumen loss; POBA: plain old balloon angioplasty; RWS: radial wall strain; RWSmax: maximum radial wall strain
Discussion
In this post hoc analysis of the PEPCAD China SVD study, we found that, among de novo SVD treated with a DCB, (1) RWSmax was significantly correlated with in-segment LLL at the target lesions; (2) lesions with RWSmax ≥13% had significantly higher in-segment LLL and greater binary restenosis than those with RWSmax <13%; (3) the presence of RWSmax ≥13% was significantly associated with an approximately 6.5-fold higher risk of TLF during the 12-month follow-up compared to its absence; and (4) the superiority of DCB to POBA in decreasing in-segment LLL was observed in lesions with RWSmax <13% but not in those with RWSmax ≥13%. To the best of our knowledge, this is the first study to investigate the association between DCB efficacy and plaque vulnerability as well as the value of angiographically derived strain analysis in the identification of high-risk lesions of angiographic and clinical failure in de novo SVD. Due to a smaller crossâsectional area of SVD, the metallic struts of implanted DES may lead to further lumen loss and higher rates of restenosis3. To overcome this drawback, DCBs were introduced as an alternative to DES for SVD treatment, following the concept of “leave nothing behind”. Although first-generation DCBs failed to present non-inferiority in angiographic outcomes versus second-generation DES (i.e., DIOR DCB [Eurocor Tech] vs TAXUS Liberté DES [Boston Scientific] in the PICCOLETO study)19, newer-generation DCBs showed superiority in angiographic outcomes and long-term clinical endpoints when compared with second-generation DES (e.g., IN.PACT Falcon DCB [Medtronic] vs TAXUS Liberté DES in the BELLO study)20. Subsequently, newer-generation DCBs were found to be at least non-inferior to newer-generation DES in angiographic outcomes or even clinical outcomes in several pivotal studies (e.g., SeQuent Please DCB vs TAXUS Element paclitaxel-eluting stent [Boston Scientific]/XIENCE everolimus-eluting stent [EES; Abbott] in the BASKET-SMALL2 study, RESTORE DCB [Cardionovum] vs Resolute Integrity zotarolimus-eluting stent [Medtronic] in the RESTORE SVD China trial, Elutax SV/Emperor DCB [both AR Baltic Medical] vs XIENCE EES in the PICCOLETO II study, and Swide DCB [Shenqi Medical] vs Firebird 2 DES [MicroPort] in the REC-CAGEFREE I trial)4567. These studies provide accumulating evidence supporting the use of DCBs for the treatment of de novo SVD. Although optimal lesion preparation before DCB administration was mandated and almost 100% procedural success was achieved in the DCB groups in previous studies, approximately 10% of DCB-treated SVD cases had binary restenosis at the 6-9-month angiographic follow-up (e.g., 10% in the BELLO study and 9.6% in the PICCOLETO II study)620 which might translate into long-term clinical failure (i.e., 3-year major adverse cardiac events rate in the DCB group: 14.4% in the BELLO study and 10.8% in the PICCOLETO II study)2122. Therefore, a satisfactory postprocedural angiographic result does not always translate into long-term angiographic or clinical success. Thus, it is important to determine which factors have a potential influence on the efficacy of DCBs. The rationale for using a DCB to treat coronary stenosis is to use it as a carrier to deliver an antiproliferative agent to the vessel wall within a short balloon inflation time to inhibit proliferation of smooth muscle cells3. Thus, the concentration of the antiproliferative agent on the vessel wall is crucial to the efficacy of a DCB. To improve DCB efficacy, investigators focused on DCB design and interventional techniques, such as drug lipophilicity, excipient technique, drug loss minimisation, and administration time optimisation8. Aside from these factors, the characteristics of the lesion itself are also an important factor but less studied. Tzafriri et al assessed the steady-state arterial distributions of paclitaxel, sirolimus, and everolimus in atherosclerotic human and rabbit tissues; they found that lipid-rich vessels had about a threefold lower affinity for the evaluated drugs than lipid-poor vessels, indicating that lipid content may suppress the efficiency of DCB drug delivery9. In addition, the formation of atherosclerotic fatty streaks leads to the displacement of adjacent cells expressing tubulin and FKBP12, drug-specific binding targets (paclitaxel exhibits affinity for the former, and sirolimus for the latter), and reduces drug affinity23. Thus, the existence of lipid content in plaques might lower the drug concentration in the DCB-treated vessel segment and reduce DCB efficacy. Angiographically derived RWS is a simplified method recently developed for determining plaque composition and vulnerability12. Theoretically, RWS represents the comprehensive effects of external forces, mainly in the circumferential direction, on the plaque and coronary wall with heterogeneous componential and structural properties. Previous studies found that the high strain pattern identified via intravascular ultrasound elastography and palpography was associated with plaque vulnerability and stenosis severity242526. A previous OCT study provided direct evidence that supports the correlation between plaque vulnerability and angiographically derived strain analysis12. As reported, angiographically derived RWSmax in the interrogated plaques was positively correlated with lipidic plaque burden and negatively correlated with fibrous cap thickness. Moreover, several clinical studies found that a higher RWSmax was associated with increased risks of lesion progression and ischaemic events in non-flow-limiting vessels1727. Essentially, the cutoff value of RWSmax ≥13% derived from the PEPCAD China SVD study for TLF prediction in DCB-treated SVD in the current analyses was similar to that for the prediction of OCT-derived plaque vulnerability (RWSmax >12%)12, lesion progression (RWSmax >12.6%)27, and vessel-related ischaemic events (RWSmax >12%)17. Altogether, these studies suggest that RWS analysis is a useful tool for identifying vulnerable plaques and predicting ischaemic events potentially triggered by plaque vulnerability. The present study found that a higher RWSmax was associated with higher in-segment LLL, greater binary restenosis, and a higher TLF rate in SVD following DCB treatment. Also, each millimetre of acute gain was penalised by a loss of 0.80 mm in lesions with RWSmax ≥13% when treated with a DCB, which was significantly higher than that of 0.14 mm in lesions with RWSmax <13%. Considering the evidence listed above, one explanation could be that lesions with a higher RWSmax have a higher lipid content, which may decrease the concentrations of antiproliferative agents in the DCB-treated vessel segment and subsequently weaken the efficacy of the DCB. However, this explanation requires more experimental studies on its intrinsic mechanism for validation. Interestingly, we also found that in SVD, a DCB was superior to POBA in terms of in-segment LLL and binary restenosis in lesions with RWSmax <13%. However, the same was not observed in lesions with RWSmax ≥13%. The major difference between a DCB and POBA is the antiproliferative agents coated on the balloon. Therefore, lesions with a higher RWSmax may have a higher lipid content and thus suppress the delivery efficiency of antiproliferative agents, which alleviates the therapeutic superiority of a DCB to POBA. Future studies are warranted to validate this hypothesis and optimise the interventional approach for lesions with a higher RWSmax.
Limitations
First, the PEPCAD China SVD study enrolled patients with chronic coronary syndrome or unstable angina and with SVD lesions only, among whom no severely calcified lesions and only a few long lesions were included. It remains unclear whether the results in the present analysis could be generalised to other settings, such as acute MI or de novo coronary stenosis with a larger vessel size, severe calcification, or long lesion length. Second, the significant difference in TLF between lesions with a high and a low RWSmax was from an exploratory analysis in this present post hoc study, with low statistical power due to the small sample size, and it might be biased by subjective judgements from operators (e.g., oculostenotic reflex). Thus, we regarded the present study as a hypothesis-generating report, and the validation of its results requires further larger-size prospective studies with a precise design (e.g., Academic Research Consortium [ARC]-2 and DCB ARC consensuses)2829 to minimise the influences of other cofounding factors, and with intracoronary imaging-based plaque vulnerability assessment (e.g., near-infrared spectroscopy intravascular ultrasound)30 to acquire direct evidence on the relationship between plaque vulnerability, RWS, and DCB efficacy in SVD. Last, as the present study is a post hoc analysis, the angiographic image views may not have been optimal for RWS analysis in all the target lesions. However, a good correlation between RWS and strain derived from OCT followed by finite element analysis has been demonstrated in a previous validation study of RWS10. Prospective studies with an optimal view for RWS analysis are warranted to validate the results of our present study.
Conclusions
The present retrospective study provided the first evidence of the prognostic value of RWS in de novo SVD treated with DCBs. This offers the opportunity to include a new angiography-derived index of plaque vulnerability assessment for predicting DCB efficacy in SVD and personalising the interventional strategy before the procedure.
Impact on daily practice
The present study demonstrated that de novo small coronary vessels with high baseline maximum radial wall strain (RWS) had increased in-segment late lumen loss following drug-coated balloon (DCB) angioplasty. It suggested that plaque composition and vulnerability might have an influence on DCB treatment efficacy. Angiographically derived RWS might provide a novel, simplified, and cost-effective method for predicting the efficacy of DCB in small vessel disease during routine percutaneous coronary intervention procedures.
Acknowledgements
We appreciate the PEPCAD China SVD study investigators for providing raw data for this study.
Funding
This work was supported by the Medicine-Engineering Interdisciplinary Research Fund of Shanghai Jiao Tong University (YG2023ZD24, YG2024QNB30).
Conflict of interest statement
S. Tu is the cofounder of, has received research grants from, and has been a consultant for Pulse Medical. The other authors have no conflicts of interest relevant to the contents of this paper to declare.
Supplementary data
To read the full content of this article, please download the PDF.