Cory:
Unlock Your AI Assistant Now!
Abstract
BACKGROUND: Severe aortic stenosis (AS) is associated with left ventricular (LV) remodelling, likely causing alterations in coronary blood flow and microvascular resistance.
AIMS: We aimed to evaluate changes in absolute coronary flow and microvascular resistance in patients with AS undergoing transcatheter aortic valve implantation (TAVI).
METHODS: Consecutive patients with AS undergoing TAVI with non-obstructive coronary artery disease in the left anterior descending artery (LAD) were included. Absolute coronary flow (Q) and microvascular resistance (Rμ) were measured in the LAD using continuous intracoronary thermodilution at rest and during hyperaemia before and after TAVI, and at 6-month follow-up. Total myocardial mass and LAD-specific mass were quantified by echocardiography and cardiac computed tomography. Regional myocardial perfusion (QN) was calculated by dividing absolute flow by the subtended myocardial mass.
RESULTS: In 51 patients, Q and R were measured at rest and during hyperaemia before and after TAVI; in 20 (39%) patients, measurements were also obtained 6 months after TAVI. No changes occurred in resting and hyperaemic flow and resistance before and after TAVI nor after 6 months. However, at 6-month follow-up, a notable reverse LV remodelling resulted in a significant increase in hyperaemic perfusion (QN,hyper: 0.86 [interquartile range {IQR} 0.691.06] vs 1.20 [IQR 0.99-1.32] mL/min/g; p=0.008; pre-TAVI and follow-up, respectively) but not in resting perfusion (QN,rest: 0.34 [IQR 0.30-0.48] vs 0.47 [IQR 0.36-0.67] mL/min/g; p=0.06).
CONCLUSIONS: Immediately after TAVI, no changes occurred in absolute coronary flow or coronary flow reserve. Over time, the remodelling of the left ventricle is associated with increased hyperaemic perfusion.
Severe aortic stenosis (AS) is characterised by a progressive increase in afterload and wall stress, and secondary concentric remodelling12. These changes might ultimately provoke angina despite the absence of obstructive coronary artery disease.
When comparing absolute flow and resistance in patients with and without AS, we observed that with the progression of left ventricle (LV) hypertrophy (LVH), myocardial perfusion was maintained at rest but not during hyperaemia3.
By alleviating the resistance to flow, aortic valve implantation is supposed to improve myocardial perfusion and microcirculatory function. Due to the lack of accurate measures of volumetric flow and absolute microvascular resistance, the extent and time course of these changes have not been well defined45. The recent development of continuous intracoronary thermodilution to assess absolute coronary flow and resistance in an operator-independent manner678 enables clinicians to better characterise the interplay between LV mass, flow and resistance in patients with AS.
The aim of the present study (unlike our previous one comparing flow and resistance in patients with and without severe AS3) is to explore the physiological changes in the microcirculatory function by using continuous intracoronary thermodilution to assess both resting and hyperaemic absolute coronary flow and microvascular resistance before transcatheter aortic valve implantation (TAVI), immediately after TAVI, and at 6-month follow-up.
Methods
DESIGN AND STUDY POPULATION
In this observational, single-centre, prospective study, consecutive patients undergoing TAVI for symptomatic severe AS from June 2021 to January 2023 at the Cardiovascular Center Aalst (Aalst, Belgium) were considered eligible. Inclusion criteria were as follows: (1) presence of normal-flow, high-gradient severe AS; and (2) absence of significant epicardial stenosis in the left anterior descending artery (LAD; defined as diameter stenosis [DS] >50% by visual estimation). Exclusion criteria were the following: (1) previous myocardial infarction (MI); (2) previous coronary artery bypass graft (CABG) in the LAD territory; (3) valve-in-valve procedure; (4) left ventricular ejection fraction (LVEF) <50%; (5) low-flow, low-gradient AS; and (6) left bundle branch block or right ventricular pacing.
All patients underwent cardiac computed tomography (CCT), echocardiography, and left and right catheterisation as part of TAVI procedural planning (data concerning the left and right catheterisation are listed in Supplementary Table 1)9. Physiological assessments of flow and resistance were performed before and immediately after TAVI in all patients. Details about size and types of implanted valves are presented in Supplementary Table 2. Clinical follow-up was performed approximately at 6 months after TAVI with echocardiography and, in a subgroup of patients, also with coronary angiography and invasive physiological assessment with intracoronary continuous thermodilution. A detailed description of the echocardiographic protocol is provided in Supplementary Appendix 1. The protocol was approved by the institutional review board of the Onze-Lieve-Vrouw Clinic in Aalst, Belgium (registration number: 2021/033). The present study was conducted according to the Declaration of Helsinki; all patients were informed about their participation in the study and provided informed consent for the anonymous publication of scientific data. Patients were not involved in the research process.
CORONARY ANGIOGRAPHY AND INVASIVE PHYSIOLOGICAL ASSESSMENT
Coronary catheterisation was performed through either radial or femoral access. A 6 Fr guiding catheter was used to cannulate the LAD. A guidewire equipped with a pressure/temperature sensor (PressureWire X [Abbott]) was connected to a dedicated software for tracings analysis (CoroFlow Cardiovascular System [Coroventis]) and, after zeroing, was advanced through the guiding catheter. The pressures recorded by the pressure/temperature wire and by the fluid-filled guide catheter were equalised close to the tip of the guiding catheter. Next, the wire was advanced into the distal part of the coronary artery. Thereafter, the distal coronary pressure to aortic pressure ratio (Pd/Pa) and resting full-cycle ratio (RFR) were recorded.
CONTINUOUS INTRACORONARY THERMODILUTION
Absolute coronary blood flow and microvascular resistance were measured with continuous intracoronary thermodilution of saline through a dedicated monorail infusion microcatheter with 4 distal side holes (RayFlow [Hexacath]). The method has been already described elsewhere, and details are reported in Supplementary Appendix 16101112.
Absolute coronary flow (Q in mL/min) and resistance (Rμ in Wood units [WU]) as derived from continuous thermodilution were calculated by the previously validated equations both at rest (Qrest and Rμ,rest, respectively) and during hyperaemia (Qhyper and Rμ,hyper)1013.
Coronary flow reserve (CFR) was calculated as the ratio between Qhyper and Qrest. Microvascular resistance reserve (MRR) was calculated as the ratio of CFR to fractional flow reserve (FFR) and corrected for the changes in systemic pressure as previously described14.
CARDIAC COMPUTED TOMOGRAPHY, MYOCARDIAL MASS AND PERFUSION QUANTIFICATION
The myocardial mass quantification has been described in detail previously and is provided in Supplementary Appendix 13. In brief, vessel-specific myocardial mass was quantified by the CCT images using Voronoi’s algorithm with dedicated software (Synapse 3D [Fujifilm Healthcare Solutions])15. The values of the total LV myocardial mass, the vessel-specific myocardial mass, and the percentage of LAD mass for the total LV mass were exported. Myocardial perfusion at rest (QN,rest) and during hyperaemia (QN,hyper) were calculated by dividing absolute flow by the specific myocardial mass subtended by the LAD (calculated as the % of LAD mass obtained by CCT angiography on the total LV mass obtained by echocardiography). Myocardial perfusion at rest (QN,rest) and during hyperaemia (QN,hyper) were calculated by dividing absolute flow for the specific myocardial mass subtended by the LAD.
STATISTICAL ANALYSIS AND SAMPLE SIZE CALCULATION
The distribution of continuous variables was assessed visually by histograms or the Shapiro-Wilk test as appropriate. Continuous variables with normal distribution are expressed as mean±standard deviation and non-normally distributed variables as median (interquartile range). Categorical variables are expressed as count and percentages. Normal ranges are presented as the 5th and 95th percentiles. The Student’s t-test and chi-square test were used to compare differences between continuous and categorical variables, respectively. Pearson’s correlation coefficient and linear regression models were fitted to evaluate the association between continuous variables. Details about the sample size calculation are reported in Supplementary Appendix 1; based on an expected mean difference in CFR before and after TAVI of approximately 15-20% to achieve a power of 80% and a significance level of 5%, the minimum required sample size ranged between 19 and 34 patients.
All analyses were performed with R statistical software (R Foundation for Statistical Computing). P<0.05 was considered statistically significant.
Results
STUDY POPULATION
Between June 2021 and January 2023, we screened 117 patients referred for a TAVI procedure for inclusion in our study. Among them, 66 patients were excluded, and 51 patients were eventually included in the study (12 of whom were already included in our previous pilot study3). Invasive absolute flow measurements were performed in the following patients:
- The overall cohort (N=51) underwent absolute flow measurements at rest and during hyperaemia before and immediately after TAVI;
- A subgroup of 20 patients also had these measurements performed at 6-month follow-up.
The study flowchart is presented in Figure 1. In the overall population, the mean age was 83.7±5.0 years, and 16 were male (31.4%). The most prevalent clinical presentation was dyspnoea, in New York Heart Association Class II-III (92.2%); 9.8% of patients had angina, and 11.8% had syncope. Baseline characteristics of the overall population are summarised in Table 1; those of the subset of patients who underwent invasive physiological assessment at 6-month follow-up are shown in Supplementary Table 3.
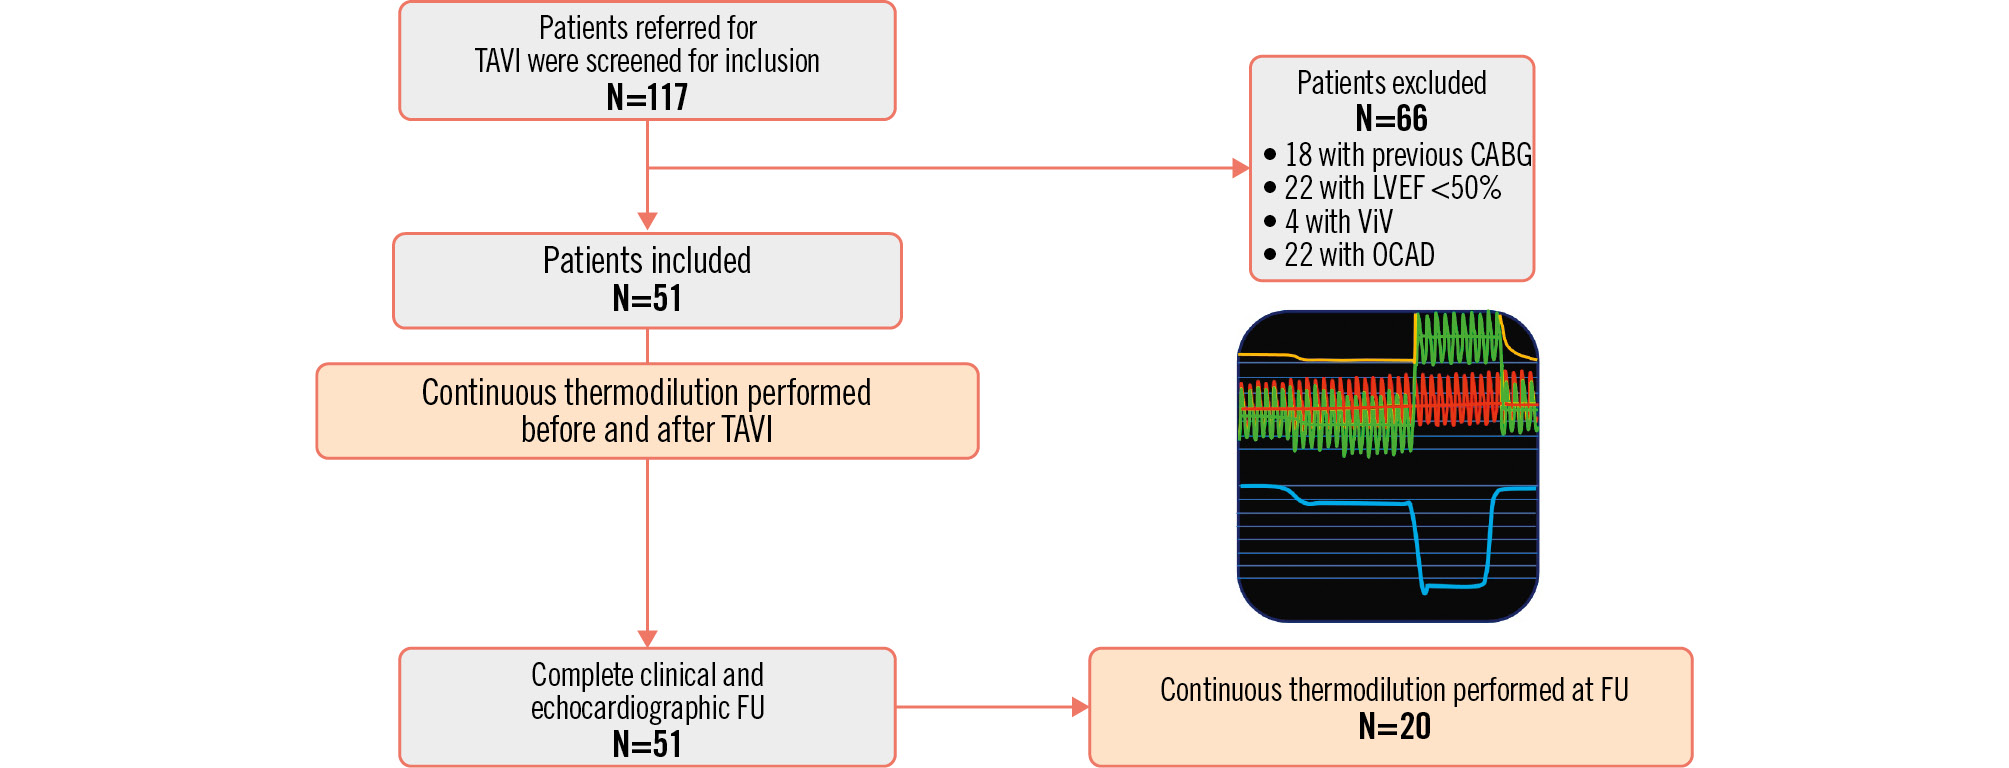
Figure 1. Study flowchart. CABG: coronary artery bypass graft; FU: follow-up; LVEF: left ventricular ejection fraction; OCAD: obstructive coronary artery disease; TAVI: transcatheter aortic valve implantation; ViV: valve-in-valve
Table 1. Baseline characteristics.
| Characteristic | N=51 |
|---|---|
| Male sex | 16 (31.4) |
| Age, years | 83.7±5.0 |
| BMI, kg/m² | 26.0±5.3 |
| Smoking habitus | 9 (17.6) |
| Hypertension | 43 (84.3) |
| Diabetes | 16 (31.4) |
| Dyslipidaemia | 42 (82.4) |
| Afib | 4 (7.8) |
| History of Afib | 17 (33.3) |
| Creatinine, mg/dL | 1.07±0.74 |
| GFR, mL/min/1.73 m² | 62.71±19.38 |
| CKD | 16 (31.4) |
| History of CAD | 10 (19.6) |
| Previous PCI | 8 (15.7) |
| Previous MI | 1 (2.0) |
| Pacemaker | 3 (5.9) |
| Angina | 5 (9.8) |
| Dyspnoea | 49 (96.1) |
| Syncope | 6 (11.8) |
| Previous HF hospitalisation | 6 (11.8) |
| Diuretics | 27 (52.9) |
| Antialdosteronics | 10 (19.6) |
| ACEi/ARBs | 25 (49.0) |
| Statins | 38 (74.5) |
| Beta blockers | 23 (45.1) |
| Calcium channel blockers | 16 (31.4) |
| Insulin | 3 (5.9) |
| OAD | 14 (27.5) |
| Anticoagulation | 14 (27.5) |
| Aspirin | 17 (33.3) |
| P2Y12 inhibitors | 11 (21.6) |
| Data are expressed as number (percentage) or mean±standard deviation. ACEi: angiotensin-converting enzyme inhibitors; Afib: atrial fibrillation; ARBs: angiotensin II receptor blockers; BMI: body mass index; CAD: coronary artery disease; CKD: chronic kidney disease; GFR: glomerular filtration rate; HF: heart failure; MI: myocardial infarction; OAD: oral antidiabetics; PCI: percutaneous coronary intervention | |
ECHOCARDIOGRAPHIC DATA AND CARDIAC REMODELLING
All 51 patients completed clinical and echocardiographic follow-ups. The mean follow-up time was 6.1±1.3 months. Echocardiographic data are reported in Supplementary Table 4.
The mean transaortic pressure gradient was 51.5±10.2 mmHg, with a mean peak aortic jet velocity of 4.43±0.40 cm/s and a mean aortic valve area of 0.62±0.41 cm2. The mean LV myocardial mass was 201.9±37.9 g, with 72.5% of patients presenting with concentric LVH. Echocardiographic data at discharge are shown in Supplementary Table 5.
At follow-up, there was a significant reduction in left ventricular mass of approximately 13% (from 201.9±37.9 g to 175.1±46.6 g; p<0.001) with a decrease of the septal thickness (from 14.0±1.7 mm to 11.8±1.9 mm; p<0.001). Consequently, the percentage of patients with LVH decreased from 72.5% to 51.0% (p=0.041).
PRE- AND IMMEDIATELY POST-TAVI FLOW ASSESSMENT
Absolute flow and resistance measurements pre- and post-TAVI are listed in Table 2.
There were no acute changes in either resting Pd/Pa or RFR after TAVI (Pd/Pa: 0.91±0.03 vs 0.91±0.04; p=0.768; RFR: 0.87±0.05 vs 0.85±0.06; p=0.081, pre- and post-TAVI respectively). Similarly, the FFR values before and after TAVI were similar (0.84±0.06 vs 0.83±0.06, respectively; p=0.339).
Resting flow values were similar before and immediately after TAVI (68 [56-88] mL/min vs 69 [55-92] mL/min; p=0.449) (Supplementary Figure 1). As a result, both CFR and MRR remained unchanged (CFR: 2.38±0.79 vs 2.47±0.97; p=0.875; and MRR: 2.72±0.97 vs 2.96±1.17; p=0.361, pre- and immediately post-TAVI, respectively) (Supplementary Figure 1).
Table 2. Absolute flow and resistance measurements collected pre- and post-TAVI.
| Pre-TAVI (N=51) | Post-TAVI (N=51) | p-value | |
|---|---|---|---|
| Pdrest | 76±19 | 77±14 | 0.261 |
| Parest | 83±19 | 85±13 | 0.184 |
| Pd/Pa | 0.91±0.03 | 0.91±0.04 | 0.768 |
| RFR | 0.87±0.05 | 0.85±0.06 | 0.081 |
| Qrest, mL/min | 68 [56-88] | 69 [55-92] | 0.776 |
| Rμ,rest, WU | 1,145 [796-1,277] | 1,147 [822-1,299] | 0.944 |
| Pdhyper | 72±15 | 72±15 | 0.973 |
| Pahyper | 86±16 | 87±16 | 0.611 |
| FFR | 0.84±0.06 | 0.83±0.06 | 0.339 |
| Qhyper, mL/min | 159 [129-201] | 172 [132-216] | 0.449 |
| Rµ,hyper, WU | 438 [370-532] | 422 [332-520] | 0.458 |
| CFR | 2.38±0.79 | 2.47±0.97 | 0.875 |
| MRR | 2.72±0.97 | 2.96±1.17 | 0.361 |
| QN,rest, mL/min/g | 0.34 [0.27-0.50] | 0.38 [0.29-0.45] | 0.710 |
| QN,hyper, mL/min/g | 0.75 [0.63-1.05] | 0.85 [0.71-1.08] | 0.349 |
| Rμ,N,rest, WU/g | 5.53 [3.78-6.90] | 5.44 [3.80-7.75] | 0.880 |
| Rμ,N,hyper, WU/g | 2.17 [1.83-2.87] | 2.13 [1.60-3.04] | 0.529 |
| CPP, mmHg | 42.3±14.1 | 37.6±18.1 | 0.152 |
| LVEDP, mmHg | 17.1±8.0 | 18.1±7.3 | 0.443 |
| Data are presented as mean±standard deviation or median [interquartile range]. CFR: coronary flow reserve; CPP: coronary perfusion pressure; FFR: fractional flow reserve; LVEDP: left ventricular end-diastolic pressure; MRR: microvascular resistance reserve; Pa: aortic pressure; Pd: distal coronary pressure; Qhyper: absolute hyperaemic coronary flow; QN,hyper: myocardial perfusion during hyperaemia; QN,rest: myocardial perfusion at rest; Qrest: absolute coronary flow at rest; RFR: resting full-cycle ratio; Rµ,N,hyper: microvascular hyperaemic resistance normalised for myocardial mass; Rµ,N,rest: microvascular resistance at rest normalised for myocardial mass; Rμ,hyper: absolute microvascular resistance during hyperaemia; Rμ,rest: absolute microvascular resistance at rest; TAVI: transcatheter aortic valve implantation; WU: Wood units | |||
LONG-TERM CHANGES AFTER TAVI
In 20 patients, physiological assessment was repeated at 6-month follow-up after TAVI. Overall, resting Pd/Pa and RFR did not significantly change between baseline and follow-up (Pd/Pa: 0.91±0.03 vs 0.92±0.04; p=0.788; RFR: 0.88±0.03 vs 0.87±0.06; p=0.553, pre-TAVI and follow-up, respectively). Similarly, no significant changes were noted in FFR values at follow-up compared to pre-TAVI values (0.83±0.05 vs 0.84±0.07; p=0.795, respectively).
Values of absolute flow and resistance measurements at baseline and at follow-up are reported in Table 3.
Resting absolute flow and microvascular resistance were similar at baseline and follow-up (Qrest: 72 [63-84] vs 83 [59-108] mL/min; p=0.658; Rμ,rest: 1,083268767 vs 916481725 WU; p=0.925; pre-TAVI and follow-up, respectively) (Figure 2). Similarly, no changes occurred in terms of hyperaemic flow and resistance (Qhyper: 181 [158-201] vs 194 [166-223]; p=0.492; Rμ,hyper: 413 [353-482] vs 389 [341-524]; p=0.869; pre-TAVI and follow-up, respectively). Consequently, both CFR and MRR remained unchanged at follow-up (CFR: 2.45±0.76 vs 2.71±0.97; p=0.388; MRR: 2.78±0.88 vs 2.73±0.97; p=0.854, pre-TAVI and follow-up, respectively). Accordingly, there was a weak correlation between the relative increase in CFR and the relative change in myocardial mass between baseline and follow-up (Supplementary Figure 2).
However, in terms of myocardial perfusion, a significant increase was observed in hyperaemic perfusion between pre-TAVI and follow-up (QN,hyper: 0.86 [0.69-1.06] vs 1.20 [0.99-1.32] mL/min/g; p=0.008; pre-TAVI and follow-up, respectively) (Figure 2). Resting perfusion showed a numerically but not statistically significant increase at follow-up (QN,rest: 0.34 [0.30-0.48] vs 0.47 [0.36-0.64] mL/min/g; p=0.061). When comparing the relative changes in myocardial mass and myocardial perfusion at rest and during hyperaemia (Figure 3), the regression model showed that despite changes in myocardial mass, the resting perfusion did not change significantly (R=0.32 [−0.12 to 0.68]; p=0.145). However, there was a significant inverse linear correlation between LV remodelling and the hyperaemic perfusion (R=−0.48 [−0.76 to −0.05]; p=0.03), the latter increasing along with a decrease in LV myocardial mass.
Table 3. Absolute flow and resistance measurements at baseline and at 6-month follow-up.
| Pre-TAVI (N=20) | Follow-up (N=20) | p-value | |
|---|---|---|---|
| Pdrest | 79±26 | 78±14 | 0.791 |
| Parest | 87±26 | 84 ±12 | 0.755 |
| Pd/Pa | 0.91±0.03 | 0.92±0.04 | 0.788 |
| RFR | 0.88±0.03 | 0.87±0.06 | 0.553 |
| Pdhyper | 75±17 | 76±13 | 0.942 |
| Pahyper | 89±19 | 90±15 | 0.859 |
| FFR | 0.84±0.07 | 0.83±0.05 | 0.795 |
| Qrest, mL/min | 72 [63-84] | 83 [59-108] | 0.658 |
| Qhyper, mL/min | 181 [158-201] | 194 [166-223] | 0.492 |
| Rμ,rest, WU | 1,083 [767-1,268] | 916 [725-1,481] | 0.925 |
| Rμ,hyper, WU | 413 [353-482] | 389 [341-524] | 0.869 |
| CFR | 2.45±0.76 | 2.71±0.97 | 0.338 |
| MRR | 2.78±0.88 | 2.73±0.97 | 0.854 |
| LV mass, g | 208±47 | 164±24 | <0.001 |
| LV mass indexed, g/m2 | 118±23 | 100±34 | <0.001 |
| QN,rest, mL/min/g | 0.34 [0.30-0.48] | 0.47 [0.36-0.64] | 0.061 |
| QN,hyper, mL/min/g | 0.86 [0.69-1.06] | 1.20 [0.99-1.32] | 0.008 |
| Rμ,N,rest, WU/g | 5.05 [3.97-6.84] | 5.61 [4.47-9.03] | 0.256 |
| Rμ,N,hyper, WU/g | 2.09 [1.76-2.89] | 2.31 [2.05-3.20] | 0.304 |
| Data are presented as mean±standard deviation or median [interquartile range]. CFR: coronary flow reserve; FFR: fractional flow reserve; LV: left ventricular; LVEDP: left ventricular end-diastolic pressure; MRR: microvascular resistance reserve; Pa: aortic pressure; Pd: distal coronary pressure; Qhyper: absolute hyperaemic coronary flow; QN,hyper: myocardial perfusion during hyperaemia; QN,rest: myocardial perfusion at rest; Qrest: absolute coronary flow at rest; RFR: resting full-cycle ratio; Rµ,N,hyper: microvascular hyperaemic resistance normalised for myocardial mass; Rµ,N,rest: microvascular resistance at rest normalised for myocardial mass; Rμ,hyper: absolute microvascular resistance during hyperaemia; Rμ, rest: absolute microvascular resistance at rest; TAVI: transcatheter aortic valve implantation; Thyper: mixed temperature during hyperaemia; Ti,hyper: infusion temperature during hyperaemia; Ti,rest: infusion temperature at rest; Trest: mixed temperature at rest; WU: Wood units | |||
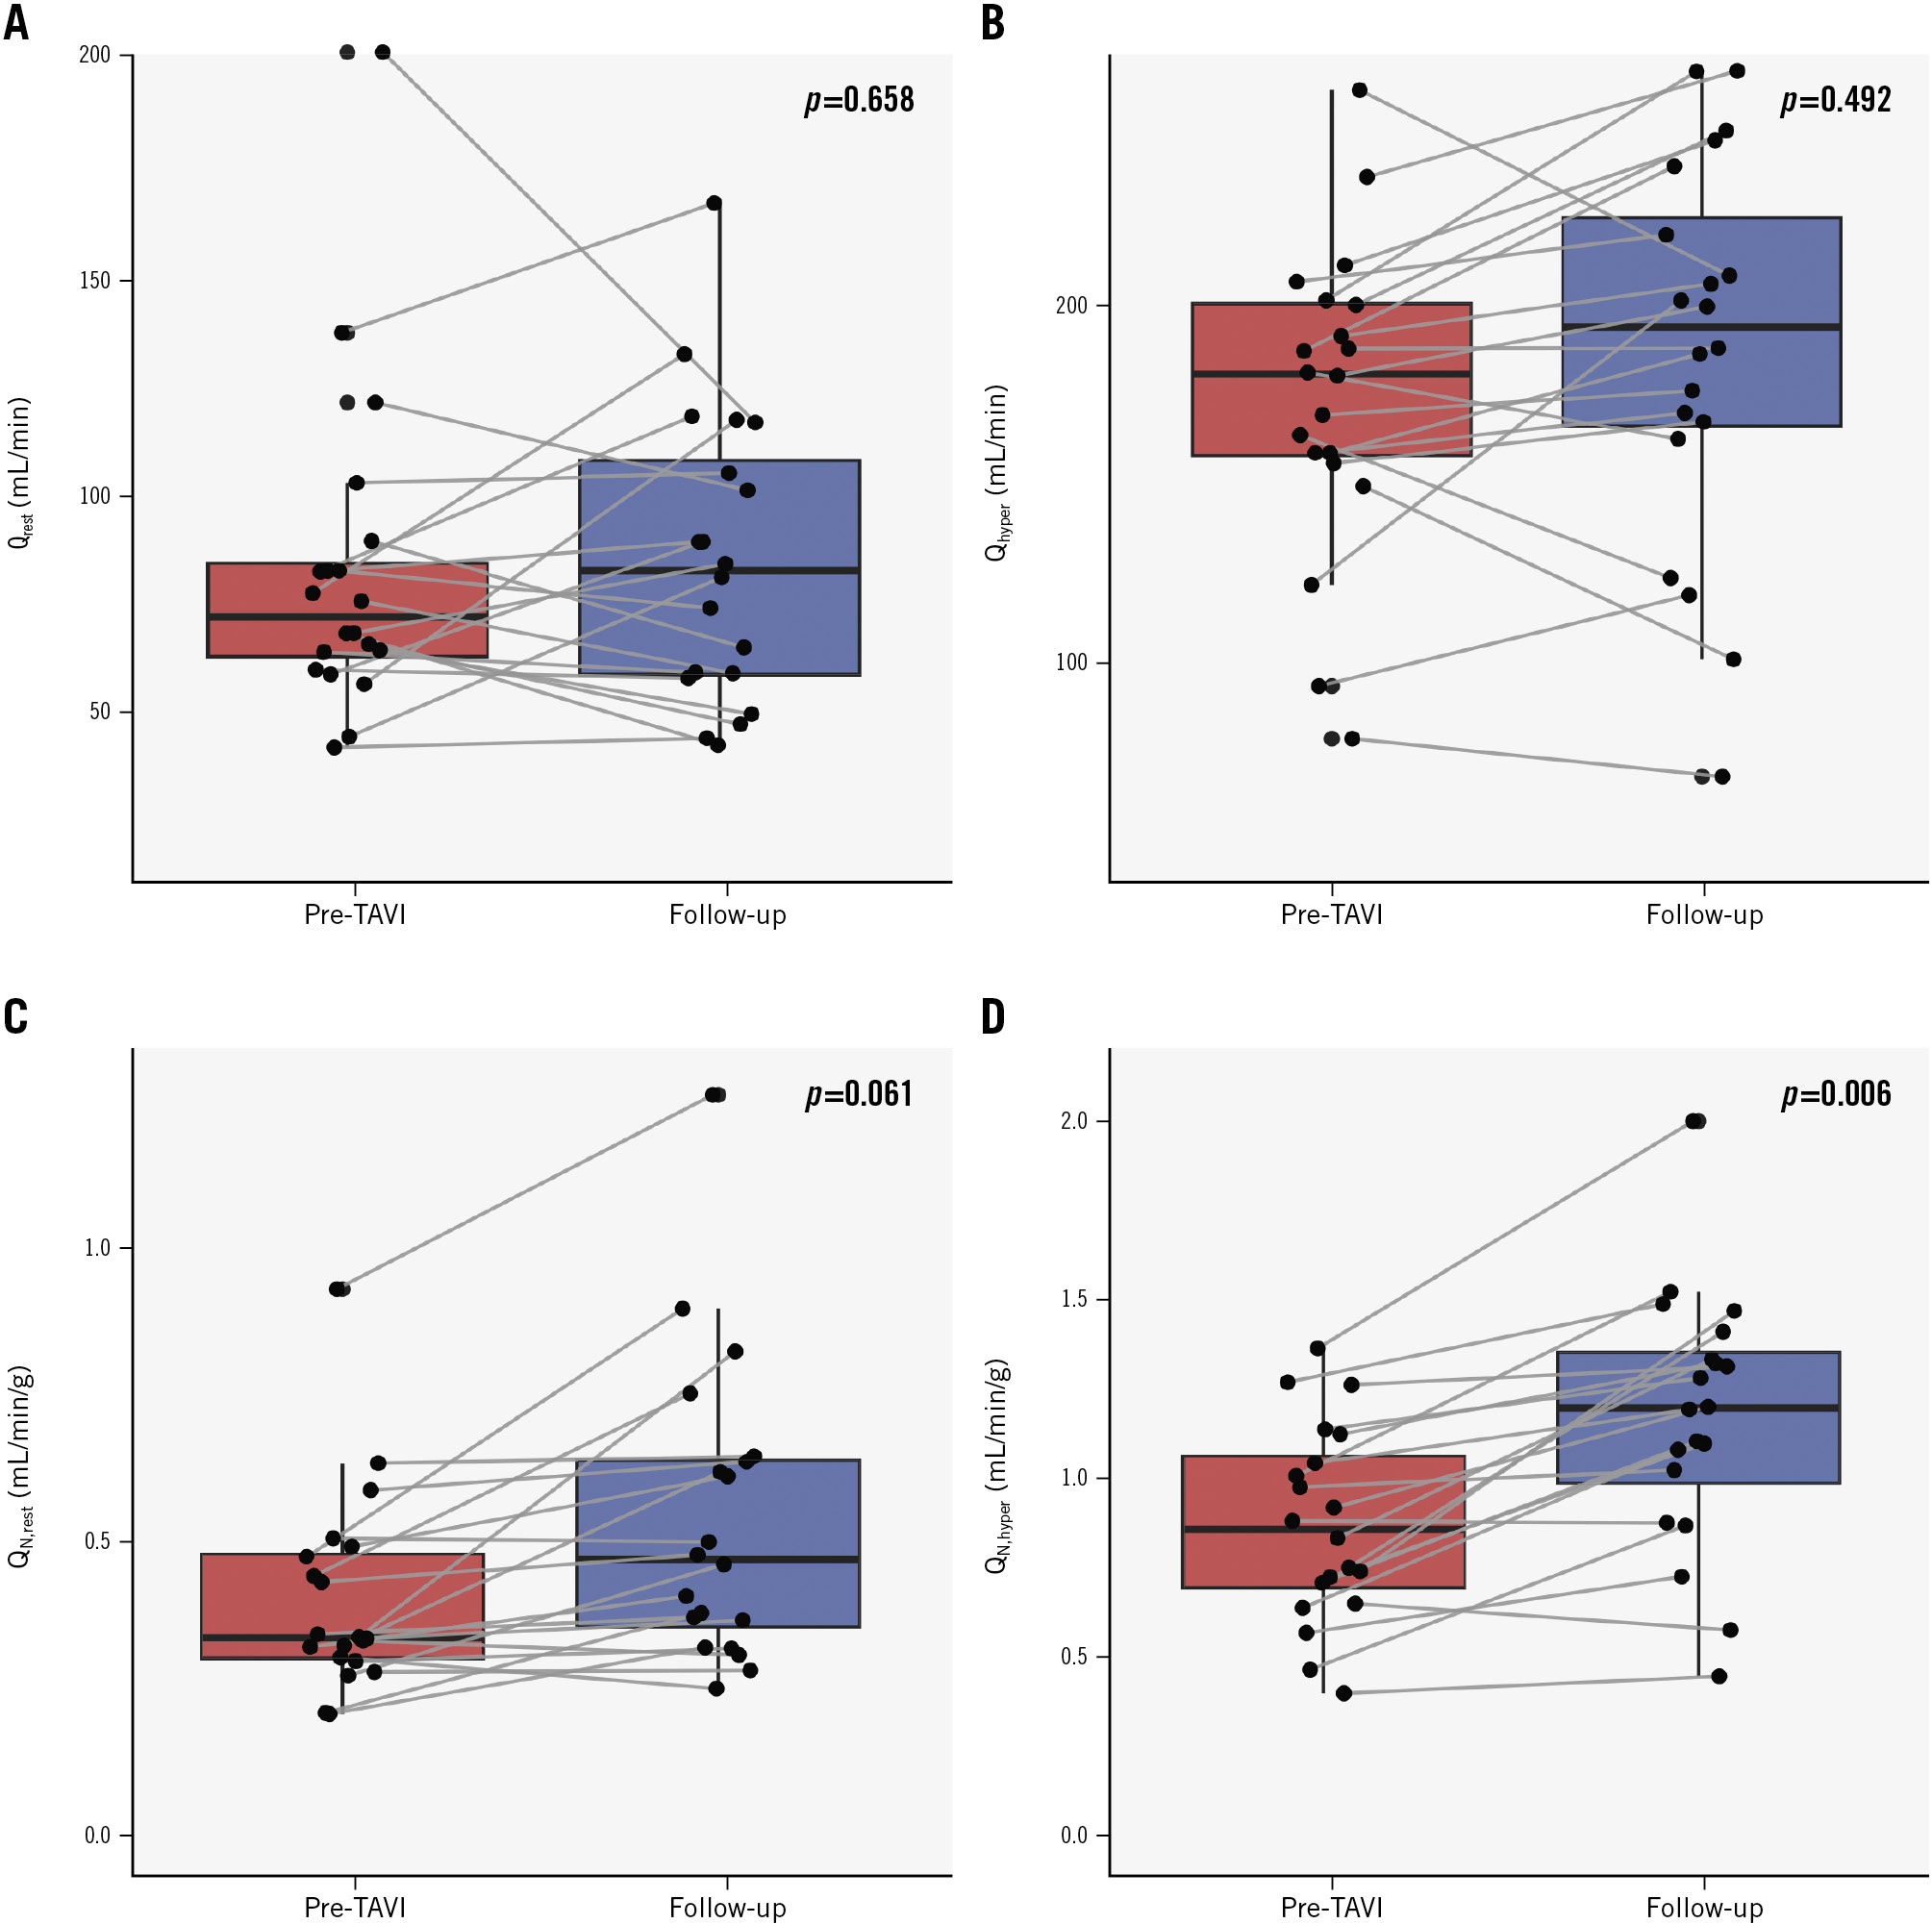
Figure 2. Absolute flow and myocardial perfusion at baseline and at 6-month follow-up (N=20). Boxplots with stripcharts showing differences between absolute flow and myocardial perfusion at rest (Qrest and QN,rest; A,C) and during hyperaemia (Qhyper, QN,hyper; B,D) at baseline (pre-TAVI) and at 6-month follow-up. Qhyper: absolute hyperaemic coronary flow; QN,hyper: myocardial perfusion during hyperaemia; QN,rest: myocardial perfusion at rest; Qrest: absolute coronary flow at rest
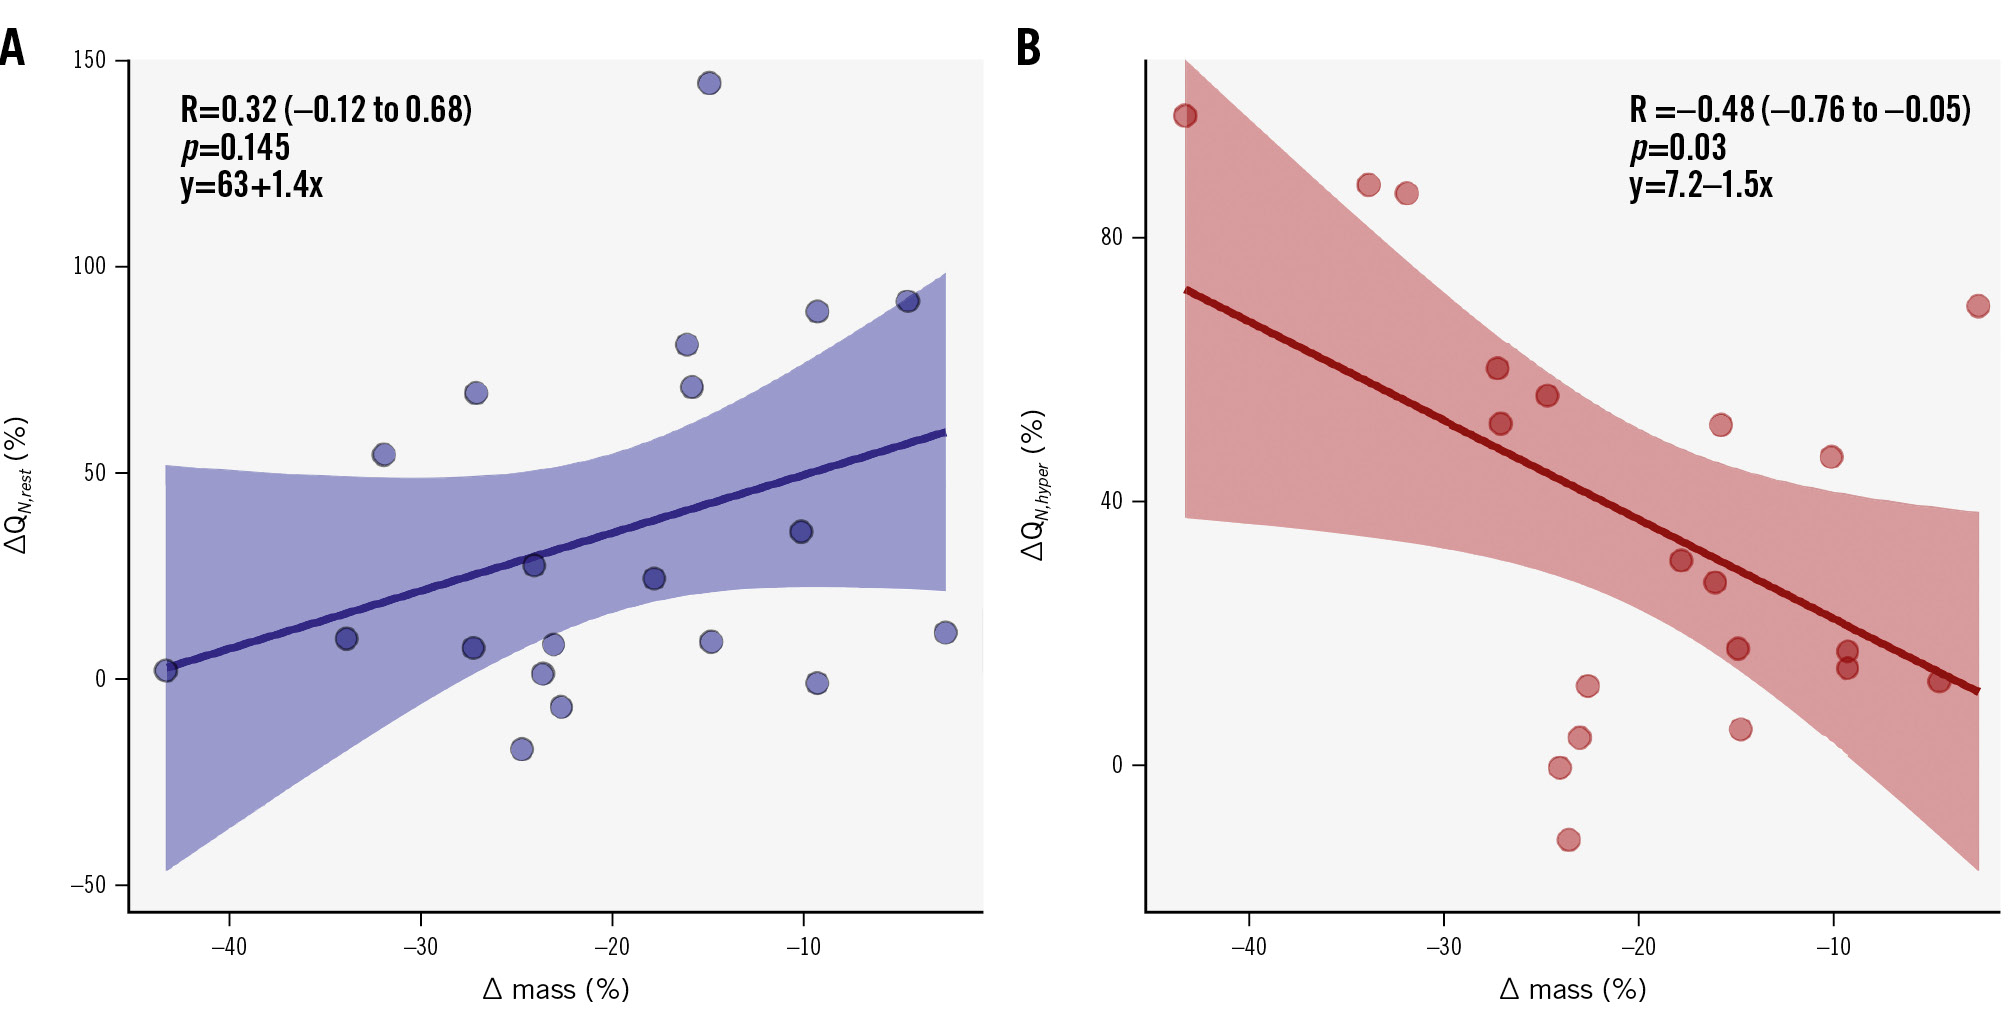
Figure 3. Correlation between the relative changes in myocardial mass and myocardial perfusion between baseline and follow-up measurements. Scatter plot with correlation and regression equation between relative changes in perfusion and mass before TAVI and at follow-up, at rest (A) and during hyperaemia (B). ΔQN represents the relative change expressed as a percentage between myocardial perfusion before and after TAVI (both at rest [ΔQN,rest] and during hyperaemia [ΔQN,hyper]). Δ mass represents the relative change in the subtended mass before TAVI and at follow-up expressed as a percentage. QN,hyper: myocardial perfusion during hyperaemia; QN,rest: myocardial perfusion at rest
Discussion
In the present study, we collected the largest dataset concerning absolute coronary flow and microvascular resistance at rest and during hyperaemia in patients with AS before and after TAVI, and at 6-month follow-up. The findings of our study can be summarised as follows (Central illustration): (1) no immediate changes occurred in terms of flow and flow reserve post-TAVI, and this remained consistent at 6-month follow-up; (2) TAVI induces a significant reverse remodelling of the LV with a significant reduction in the global myocardial mass; and (3) consequently, this reverse remodelling results in a significant improvement of hyperaemic perfusion at follow-up.
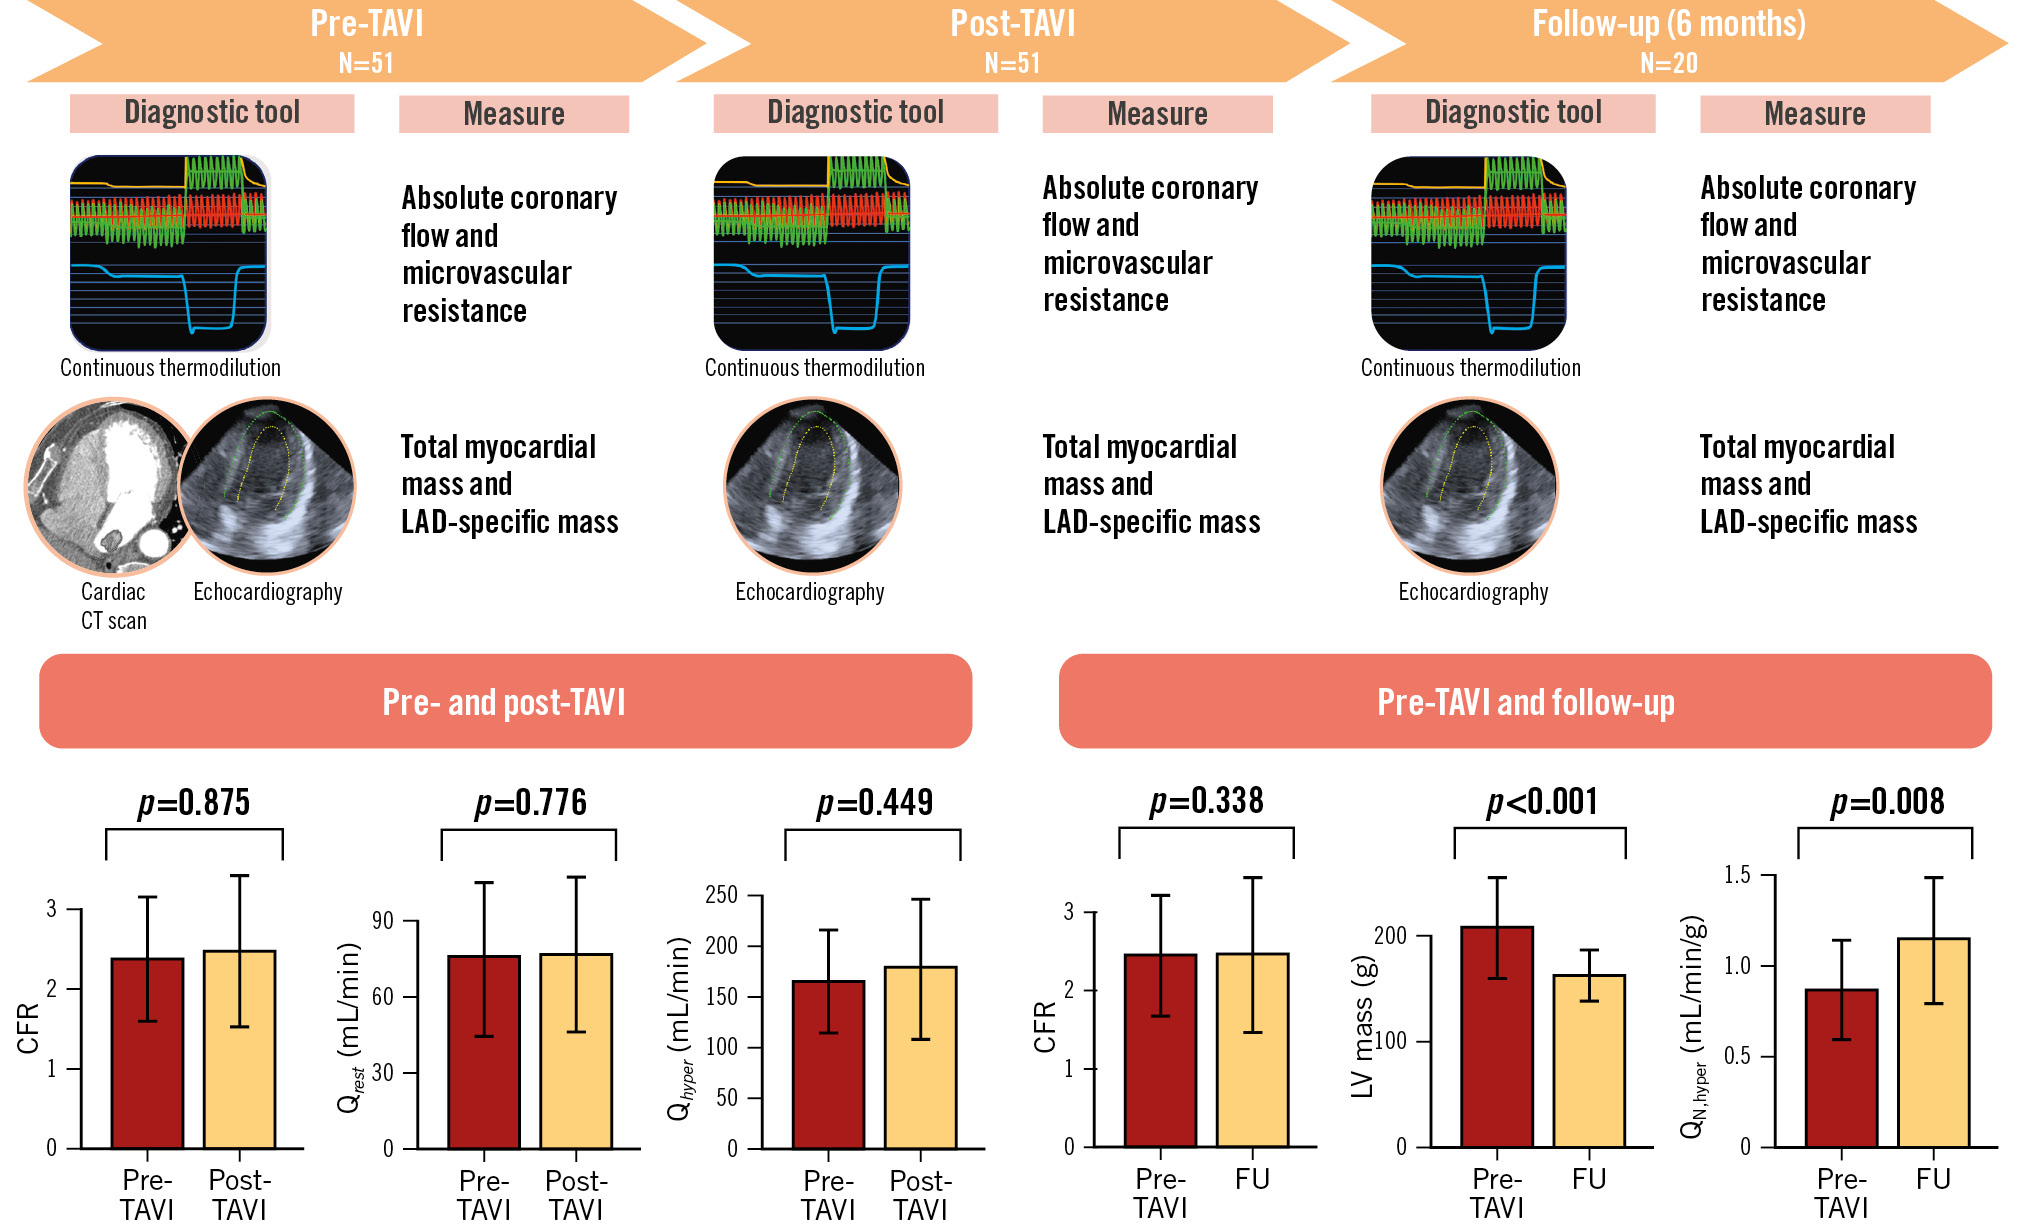
Central illustration. Summary and main results of the study. CFR: coronary flow reserve; CT: computed tomography; FU: follow-up; LAD: left anterior descending artery; LV: left ventricular; Qhyper: hyperaemic absolute coronary flow; QN,hyper: myocardial perfusion during hyperaemia; Qrest: resting absolute coronary flow; TAVI: transcatheter aortic valve implantation
ACUTE HAEMODYNAMIC CHANGES AFTER TAVI
In the haemodynamic model of aortic stenosis, the anatomical position of the valve precedes the coronary arteries resulting in increased afterload and reduced coronary perfusion pressure. It is theoretically expected that TAVI, by alleviating this obstruction, would acutely result in a significant increase in coronary perfusion pressure, thus enhancing coronary blood flow.
The evidence so far, however, remains controversial. One study utilising Doppler measurements supported this theoretical paradigm by showing an “instantaneous” effect of transcatheter aortic valve implantation on coronary flow velocities. This resulted in an increase in the hyperaemic average peak velocity and a decrease in hyperaemic microvascular resistance, while resting flow and resistance remained unchanged16. Furthermore, the observed changes were even more pronounced after excluding those patients with aortic regurgitation post-TAVI, resulting in a global increase of flow reserve. However, these findings were not confirmed by two small studies which showed that CFR was not affected by the immediate reduction in LV afterload after TAVI1718.
In our study, utilising a direct and quantitative assessment of coronary flow in mL/min, we found no significant acute changes in terms of absolute flow or microvascular resistance neither at rest nor during hyperaemia after TAVI, leaving both CFR and MRR substantially unchanged. Stated another way, the immediate impact of TAVI on coronary haemodynamics appears to be negligible, suggesting that the exertional angina experienced, despite the absence of coronary artery stenosis, cannot be fully attributed to a reduced coronary flow but rather to a mismatch between coronary blood flow and the increase in LV mass resulting from the concentric remodelling induced by the elevated afterload.
LONG-TERM CHANGES AFTER TAVI
As previously shown, aortic valve stenosis, by increasing the afterload, triggers a compensatory mechanism of concentric remodelling of the LV which aims to reduce the heightened wall stress. Consequently, at rest, coronary autoregulation works to augment coronary flow in order to maintain an adequate perfusion. However, during hyperaemia, these autoregulatory mechanisms are unable to increase coronary flow to a level that would provide sufficient myocardial perfusion for the increased left ventricular mass3.
So far, the results of studies assessing long-term changes in coronary haemodynamics after TAVI have been inconclusive. While earlier studies suggested that hyperaemic coronary blood flow increases acutely immediately after TAVI and also tends to increase over time after the procedure19, others have shown that resting coronary flow decreases while hyperaemic flow remains constant20.
In our study, we did not observe at follow-up any significant changes either in resting or in hyperaemic absolute coronary flow, resulting in an unchanged CFR. Notably, myocardial perfusion at rest remained unchanged, whereas hyperaemic perfusion significantly increased, mainly driven by the reverse remodelling of the LV rather than an increase in absolute hyperaemic flow (Figure 3).
PRACTICAL CONSIDERATIONS AND CLINICAL IMPLICATIONS
In the context of the pathophysiological changes observed in coronary microcirculation in patients with AS after TAVI, our study suggests that the reverse LV remodelling has a more significant impact than the acute LV unloading achieved by replacing the valve itself. The reverse remodelling plays a crucial role in improving hyperaemic myocardial perfusion and ensuring an adequate oxygen supply to the myocardium.
As mentioned previously, it was anticipated that patients undergoing TAVI would experience a decrease in baseline perfusion due to both acute changes in LV filling pressures and long-term regression of LV hypertrophy; however, among published studies, only one showed a decrease in resting parameters20. Despite the limitation of the small sample sizes, these studies, along with ours, do not demonstrate a substantial impact of TAVI on resting perfusion. These results highlight the remarkable ability of autoregulation to compensate for significant pathophysiological changes under resting conditions21, with the primary impact of TAVI only being observed at follow-up during hyperaemic conditions.
Second, the controversial and inconclusive results reported in previous studies may be attributed to the heterogeneity of the tools used to assess coronary microcirculation. In our study, we employed continuous intracoronary thermodilution, which is more operator independent and characterised by a lower intraobserver variability compared to intracoronary Doppler and bolus thermodilution222324. This variation in assessment methods may explain the divergent outcomes observed in our study compared to others20.
Third, it has been shown that coronary microvascular dysfunction in patients with severe AS is associated with advanced extravalvular cardiac damage and that coronary abnormalities detected in an end-stage of the natural history of AS might be a sign of adverse remodelling and disease severity525. Yet, in the present study, despite the reverse remodelling observed at follow-up, absolute flow and resistance as well as CFR and MRR remained unchanged, likely reflecting irreversible structural damage of the coronary microcirculation.
Finally, the value reported for resting myocardial perfusion (median 0.34 mL/min/g) appears to be relatively low compared to prior animal and human studies. This discrepancy might be related to (i) the selected study population of old patients with severe AS, LV hypertrophy, and likely a certain degree of myocardial fibrosis, which is hardly comparable with populations of previously published studies; and (ii) the method adopted for calculating the mass used to normalise the absolute flow. Specifically, we tried to solve an apparent divergence (likely due to LV concentric hypertrophy driven by AS) that was found between CT and echocardiography-derived myocardial mass (Supplementary Figure 3) by combining the two methods (Supplementary Appendix 1). On the other hand, it should be acknowledged that the main finding of our study regarding myocardial perfusion was the variation between baseline and 6-month follow-up; therefore, changing the method for relative mass derivation would not have challenged the robustness of this result, as the method remained the same for each timepoint of the study and for each patient.
AORTIC STENOSIS, CORONARY FLOW AND FUNCTIONAL INDICES
Another important clinical implication of our study pertains to the ongoing debate concerning the use of resting and hyperaemic pressure indices to evaluate the functional severity of epicardial stenosis in patients with aortic stenosis. The findings from different studies have been contradictory, with some studies suggesting that the non-hyperaemic pressure ratio (NHPR) may be less affected by AS, while more recent studies have demonstrated that FFR is a more stable and reliable index in this specific subgroup of patients192627282930.
As previously demonstrated, patients with AS often experience concentric remodelling which can lead to an increase in absolute resting flow compared to healthy control patients3. This increase in flow may affect the accuracy of resting pressure indices such as the NHPR. However, in our study, we did not observe any changes in NHPR or FFR after aortic valve implantation, which likely reflects the absence of significant changes in terms of absolute resting and hyperaemic flow.
What implications do these findings have for clinical practice? It is undeniably evident that the debate concerning the accuracy of FFR and NHPR in this subset of patients is far from settled, even considering our results. Notably, the recent ACTIVATION trial, which assessed the benefit of percutaneous coronary intervention (PCI) prior to transcatheter aortic valve implantation, demonstrated no benefit but instead an increased risk of bleeding for patients undergoing PCI prior to TAVI31. Therefore, it may be advisable to defer the physiological assessment and treatment of intermediate coronary stenosis until after the TAVI procedure, in order to avoid any potential bias related to the presence of AS.
Limitations
Although our study was adequately powered based on an anticipated mean difference in CFR before and after TAVI of approximately 15-20%, the final sample size, particularly for the subgroup undergoing follow-up assessment, remained small. This limitation precluded us from conducting specific subanalyses, thus necessitating further validation of our findings through larger-scale studies. In addition, approximately 60% of patients did not undergo a second coronary angiography at follow-up; in most cases, advanced age and patient frailty, along with the absence of symptoms, were among the primary reasons leading patients to decline a second coronary angiography, which, although recommended, was not mandatory for study enrolment.
Furthermore, the method we used to calculate myocardial perfusion, by normalising the absolute flow and myocardial mass subtended by the LAD, is based on the evidence of a strict correlation between flow and mass323334, but still needs further validation from larger studies with positron emission tomography-derived resting myocardial flow, both in normal patients as well as in specific settings such as patients with AS and LVH.
Finally, we opted to exclude patients with reduced ejection fraction, including those with low-flow, low-gradient aortic stenosis, who often exhibit microvascular dysfunction3536. This decision aimed to mitigate the confounding influence of reduced ejection fraction on coronary microcirculation37. Consequently, our findings are applicable solely to patients with normal-flow, high-gradient aortic stenosis.
Conclusions
There were no significant differences observed in absolute resting and hyperaemic coronary blood flow before, immediately after, and – in a small subgroup of 20 patients – at 6 months after TAVI in patients with severe aortic valve stenosis. Similarly, perfusion at rest remained unchanged over time. However, hyperaemic perfusion increased with time in patients with reverse LV remodelling. These findings suggest that coronary autoregulation remained preserved/intact at the different timepoints and cannot solely explain the underlying cause of exercise-induced angina in AS. Nevertheless, the inverse relationship between perfusion and regression of LVH during hyperaemia suggests that a mismatch between perfusion and LV mass could contribute to this phenomenon. It implies that the hyperaemic perfusion may not be sufficient to meet the demands of the increased LV mass in AS patients, leading to the development of symptoms.
These observations highlight the complex interplay between coronary perfusion, LV remodelling and exercise-induced angina in patients undergoing TAVI. Further investigations are needed to better understand the mechanisms involved and identify strategies to optimise the timing of interventions to alleviate symptoms in this patient population.
Impact on daily practice
Coronary microvascular dysfunction (CMD) is common among patients with severe aortic stenosis and has been shown to be related to the extent of extra-valvular cardiac damage. In the present study, we demonstrated that absolute resting and hyperaemic flow, as well as coronary flow reserve, remained unchanged before transcatheter aortic valve implantation (TAVI), after TAVI and at 6-month follow-up, likely reflecting irreversible structural damage of the microcirculation. Further investigations are needed to assess the prognostic impact of CMD in these patients and the potential role of microcirculatory function as a marker of early adverse cardiac remodelling requiring anticipated future interventions.
Conflict of interest statement
P. Paolisso, D.T. Bertolone, G. Esposito, M. Belmonte, A. Leone, and M.M. Viscusi are supported by a research grant from the CardioPaTh PhD programme. E. Barbato declares speaker fees from Abbott, Boston Scientific, and GE HealthCare. C. Collet reports receiving research grants from Biosensors, GE HealthCare, Medis Medical Imaging, Pie Medical Imaging, CathWorks, Boston Scientific, Siemens, HeartFlow, and Abbott; and consultancy fees from HeartFlow, Opsens, Pie Medical Imaging, Abbott, and Philips. B. De Bruyne has institutional consulting relationships with Boston Scientific, Abbott, CathWorks, Siemens, GE HealthCare, and Coroventis Research; receives institutional research grants from Abbott, Coroventis Research, CathWorks, and Boston Scientific; and holds minor equities in Philips, Siemens, GE HealthCare, Edwards Lifesciences, HeartFlow, Opsens, and Celiad. The other authors have no conflicts of interest to declare.
Supplementary data
To read the full content of this article, please download the PDF.