A 66-year-old male with diabetes, dyslipidaemia and arterial hypertension was referred because of Canadian Cardiovascular Society (CCS) class III stable angina, despite optimal medical treatment. Coronary angiography showed severe stenosis of the left circumflex artery, which was successfully treated during the index procedure with a drug-eluting stent, and of the left anterior descending artery (Moving image 1, Moving image 2), which was scheduled for staged percutaneous coronary intervention (PCI). Staged PCI consisted of predilatation and implantation of a 2.5x39 mm drug-eluting stent, which was postdilated in the proximal part with a 3.0x15 mm non-compliant (NC) balloon (Moving image 3). Stent expansion was evaluated by optical coherence tomography (OCT) (Moving image 4) and by 3DStent (GE HealthCare). 3DStent image acquisition was performed by a 200° rotational angiography with the balloon of the stent inside the implanted stent (Moving image 5). 3DStent images are shown as volume-rendering reconstruction (Figure 1A, Moving image 6) and as two orthogonal longitudinal views in which the operator may scroll to select a specific cross-section (Figure 1B, Figure 1C), where the area and diameters may be measured. OCT revealed a minimal stent area (MSA) of 5.5 mm2 in the proximal (Figure 1D, yellow line) and of 3.3 mm2 in the distal (Figure 1D, blue line) segment of the stent, respectively, with 100% stent expansion and a distal MSA/distal reference lumen area ratio of 0.96. 3DStent comparison analysis showed a corresponding MSA of 5.2 mm2 proximally (Figure 1B) and of 3.1 mm2 in the distal segment (Figure 1C). The patient was discharged the same day and was asymptomatic at 2-month follow-up. Stent underexpansion is a strong predictor of major adverse events, such as cardiac death, target lesion-related myocardial infarction, or stent thrombosis1. 3DStent is a new angiography-based tool, which may be used to assess stent expansion, in addition to intracoronary imaging.
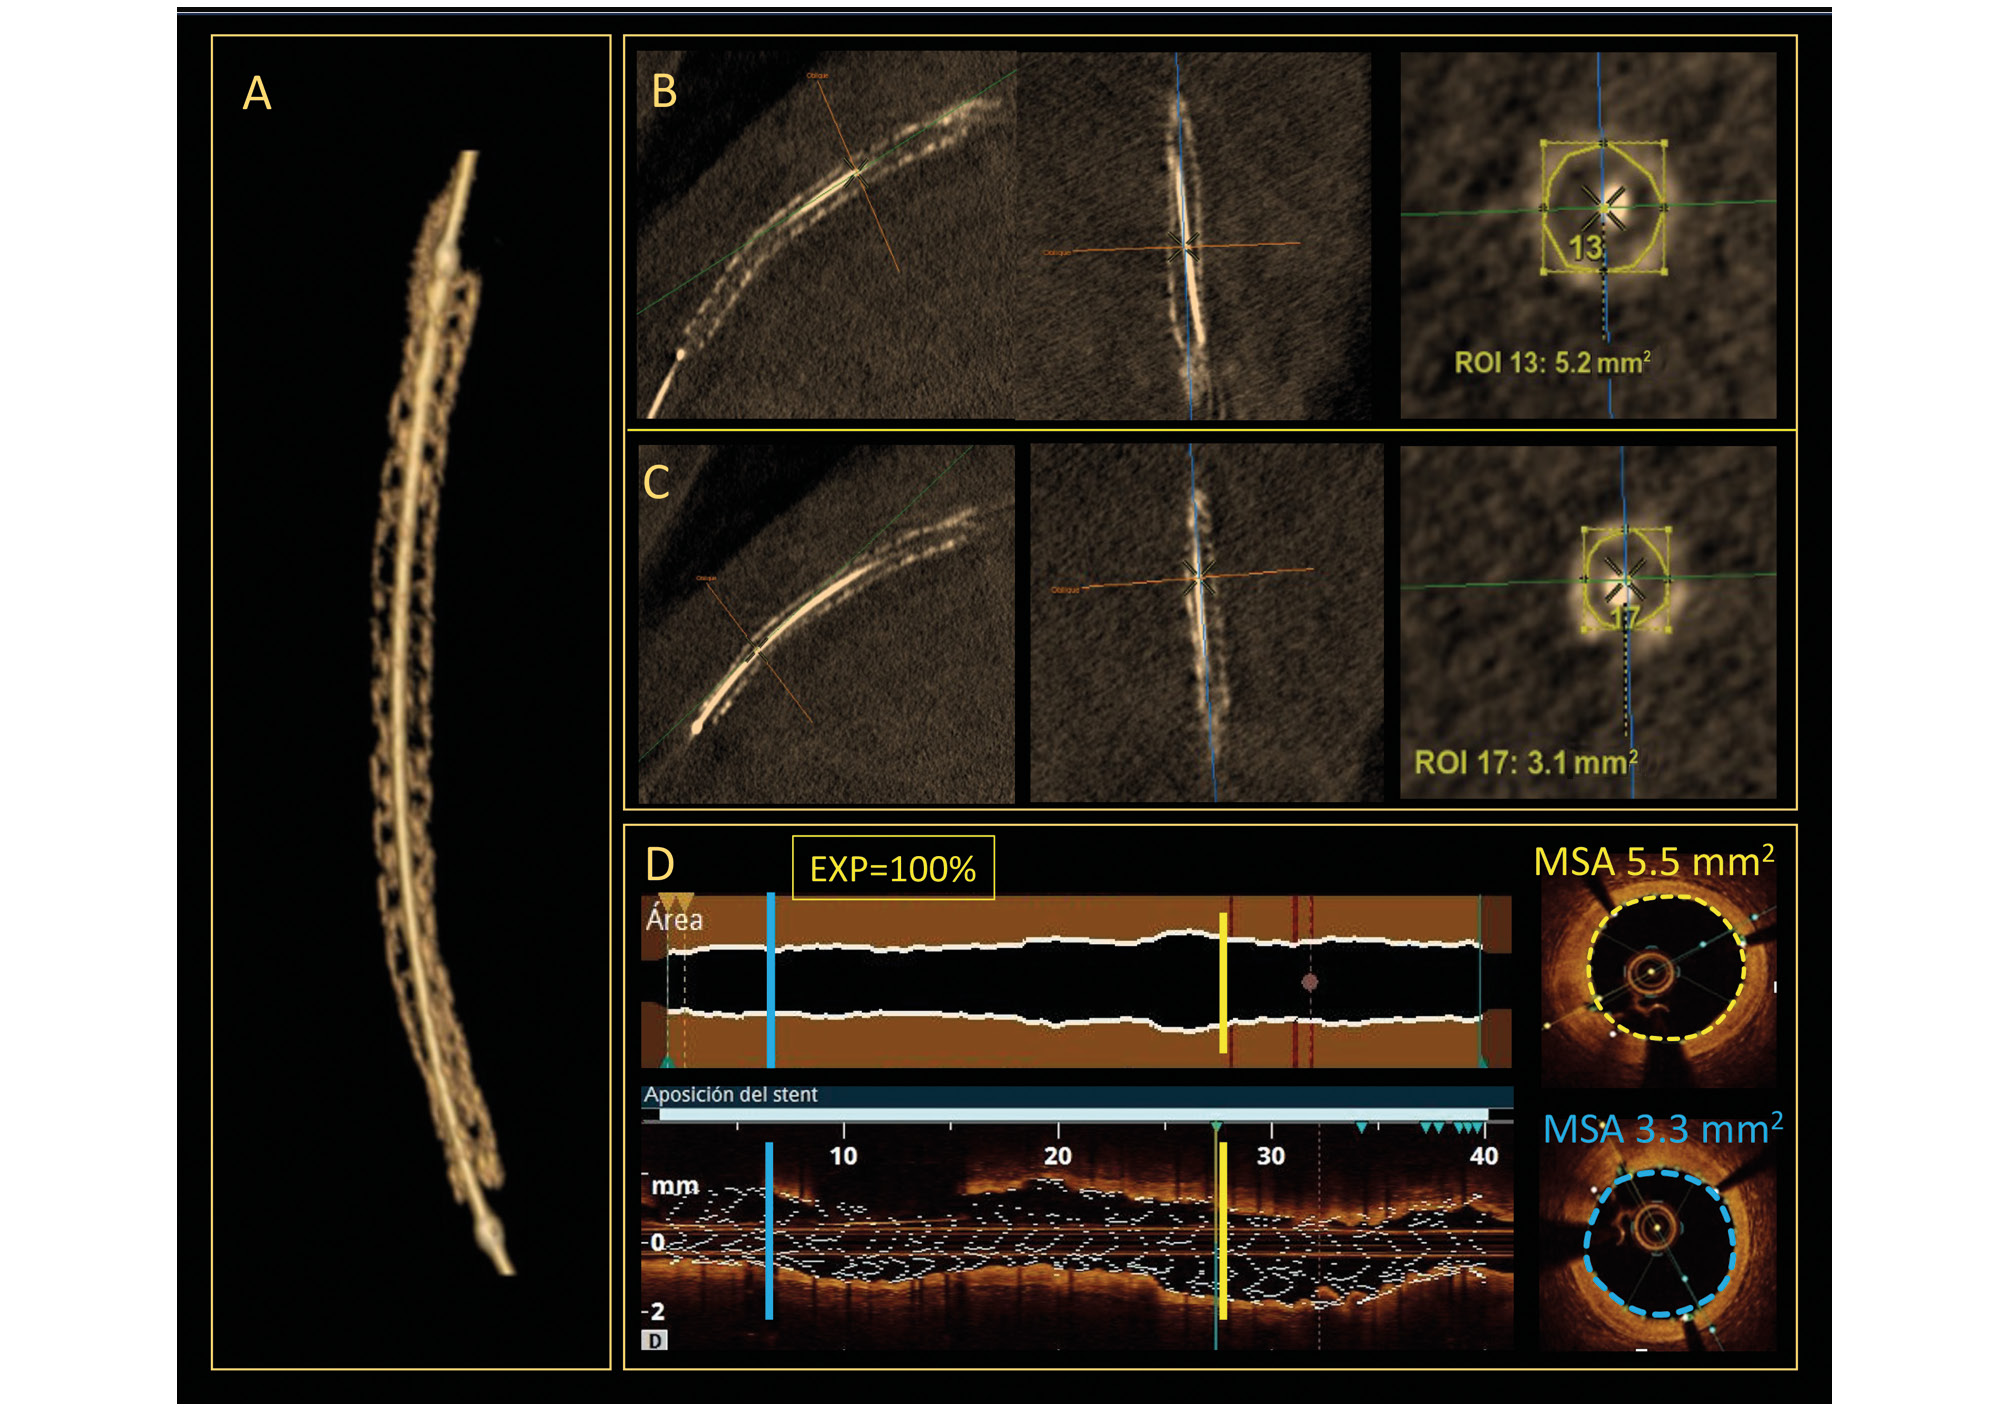
Figure 1. 3DStent and OCT images of the LAD after PCI. A) 3DStent volume-rendering reconstruction. B) 3DStent orthogonal views with stent area measurement of a proximal cross-section (right). C) 3DStent orthogonal views with stent area measurement of a distal cross-section (right). D) OCT showing 100% stent expansion (EXP) and stent area measurement of a proximal (yellow line) and a distal cross-section (blue line). LAD: left anterior descending artery; MSA: minimal stent area; OCT: optical coherence tomography; PCI: percutaneous coronary intervention; ROI: region of interest
Conflict of interest statement
The authors have no conflicts of interest to declare.
Supplementary data
To read the full content of this article, please download the PDF.
Moving image 1. Coronary angiography illustrating severe disease of LAD before PCI.
Moving image 2. OCT of LAD before PCI.
Moving image 3. Coronary angiography of LAD at the end of procedure.
Moving image 4. OCT of LAD after PCI.
Moving image 5. 200-degree rotational angiography acquisition with the balloon inside the stent after final post-dilatation.
Moving image 6. 3D volume-rendering reconstruction.