For improved risk stratification of carotid stenosis, it is necessary to incorporate factors beyond mere stenosis severity1. Biomechanics is a key factor contributing to plaque vulnerability2. Our study introduces angiography-derived radial wall strain (RWS) to analyse carotid stenosis biomechanics and their association with plaque composition and vulnerability.
We included consecutive patients with internal carotid artery stenosis undergoing both carotid 3.0T magnetic resonance imaging (MRI) and digital subtraction angiography (DSA) within 1 week between July 2019 and December 2021 (Supplementary Figure 1). RWS was calculated as the ratio of the difference between the maximum and minimum lumen diameter (i.e., max−min) to the maximum diameter after automatic lumen segmentation and registration of four representative DSA frames of the cardiac cycle3 (Central illustration). RWSmax represented the lesion’s maximum RWS value. Plaque composition and vulnerability were determined by carotid MRI (Supplementary Table 1, Supplementary Figure 2). A detailed description of the eligibility criteria, carotid DSA and RWS analysis, carotid MRI and image interpretation, and statistical analysis is provided in Supplementary Appendix 1.
After screening, 110 patients (mean age 67.7±7.2 years; 94 males; 79 symptomatic) with 135 plaques were studied (Supplementary Table 2). RWS analysis was feasible and reproducible, and the mean analysis time per lesion was 59±30 seconds (Supplementary Figure 3, Supplementary Appendix 2, Supplementary Figure 4). The majority of analysed plaques were based on the lateral view (119/135). RWSmax showed weak to moderate correlations with morphological features, such as percentage diameter stenosis (DS%) (Supplementary Figure 5). RWSmax was higher in plaques containing intraplaque haemorrhage or a large lipid-rich necrotic core, and in those developing fibrous cap rupture (Supplementary Figure 6). Overall, the median RWSmax value was 11.0% in vulnerable plaques versus 7.5% in stable plaques, with an area under the receiver operating characteristic curve (AUC) of 0.80 for discrimination (Central illustration). A cutoff value of 8.5% achieved the maximum Youden index (sensitivity=74.5%; specificity=75.6%) (Supplementary Table 3). Representative cases are illustrated in Supplementary Figure 7.
Similarly, in plaque subgroups with different degrees of stenosis (<50% and 50-99%) or symptomatic statuses (symptomatic and asymptomatic), vulnerable plaques all demonstrated higher RWSmax values than stable plaques (Supplementary Table 4, Supplementary Table 5). RWSmax maintained a high diagnostic performance (AUC=0.74-0.80), compared with DS% (AUC=0.55-0.71) and lesion length (AUC=0.60-0.70) (Supplementary Table 3, Supplementary Figure 8).
We performed logistic regression analyses to identify independent indicators of plaque vulnerability. The incidence of vulnerable plaque increased ~1.5 times for every 1% increase in RWSmax, in both plaque- and patient-level univariable analyses. Multivariable analysis showed RWSmax as a marker for plaque vulnerability at plaque level (adjusted odds ratio [OR] 1.45) − adjusting for DS% and lesion length − and at patient level (adjusted OR 1.48) − adjusting for age, sex, DS%, and lesion length (Table 1).
Plaque biomechanics can be assessed through elastograms derived from intravascular ultrasound measurements4. In our study, local radial strain was assessed with routine angiography by characterising the lumen diameter variation caused by pulsatile arterial pressure3. We found that angiography-based RWSmax increased in vulnerable plaques and could serve as an independent factor of plaque vulnerability. These findings were consistent with previous simulation-based or histology-based studies56, which demonstrated that atherosclerotic plaques predominantly comprised of soft tissues that destabilise the plaque integrity exhibited elevated strain values when subjected to mechanical forces. Extended exposure to high strain/stress on the lumen surface can precipitate endothelial dysfunction and diminish the strength of the lumen surface over time. Regions of high strain within plaques are reported to be colocalised preferentially to the plaque rupture site and are predictive of adverse events7.
The proposed method is simple, using just one angiographic view from routine DSA exams, which avoids extra radiation and contrast agent exposure. It offers interventionalists a potential real-time tool in the catheter laboratory to assess the mechanical properties of carotid plaques, aiding optimised procedures (Central illustration). Incorporating RWS into lesion-level risk assessment may facilitate the appropriate selection of embolic protection devices and stent types. It could also potentially serve as an alternative to judge plaque vulnerability when carotid MRI – often not routinely available – is absent. Furthermore, RWS may also have the capability to provide additional prognostic information beyond anatomical and functional assessments.
However, it is worth noting that the assessment of plaque vulnerability in this study, based on carotid MRI, does not always predict future rupture or adverse events. The prognostic value of RWSmax in carotid plaques still needs to be explored. The MRI features we used as a reference were not the only known non-invasive markers for increased neurological symptoms risk. Some other features, such as inflammation and neovascularisation, were not analysed. Additionally, different angiographic views, or even minor differences in the same view acquired at different timepoints or catheter laboratories, may affect the RWS results and require further research.
Other main limitations of this study included its retrospective design and suboptimal DSA frame rate, which have been fully discussed in Supplementary Appendix 3.
Angiography-based strain analysis proved feasible in carotid stenosis. RWSmax was correlated with vulnerable features and could identify high-risk plaques effectively regardless of stenosis severity or symptomatic status. Further validation and longitudinal studies are required to ascertain its clinical value in predicting events and guiding interventions.
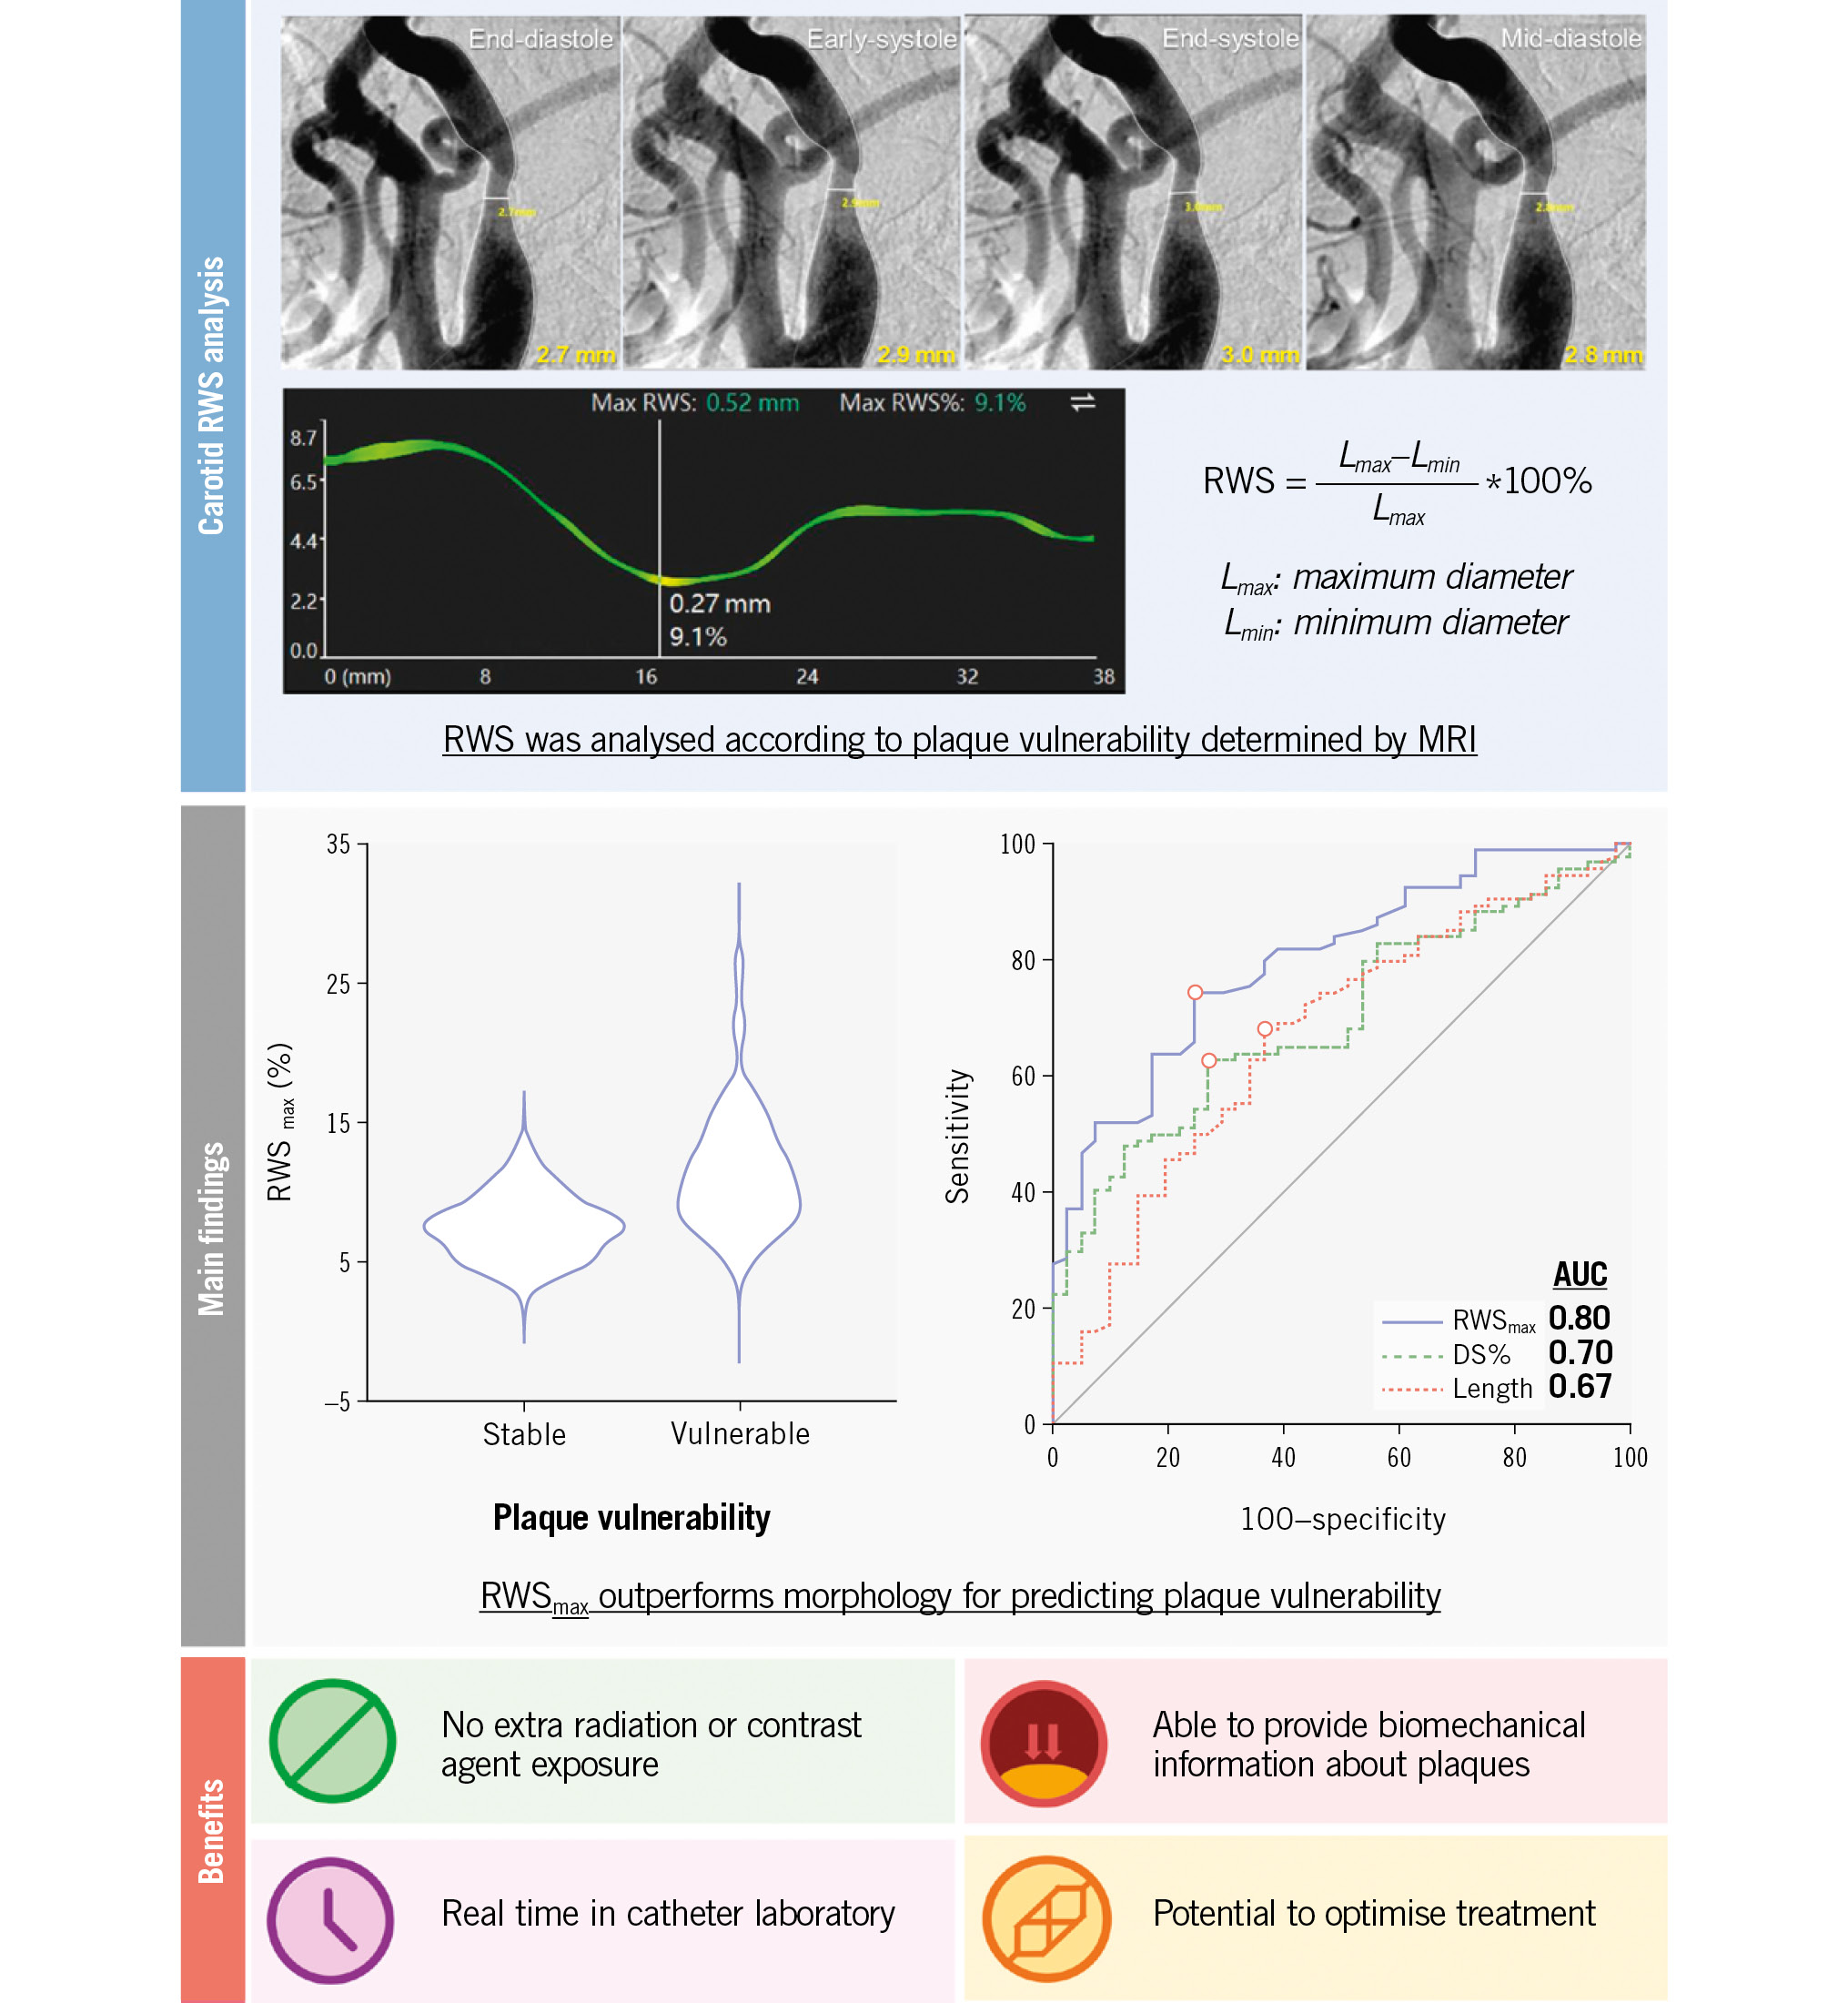
Central illustration. A summary of carotid RWS analysis, main findings and benefits of RWS. RWSmax allowed differentiation between vulnerable and stable plaques, as assessed by MRI, outperforming both DS% and lesion length in the evaluation. Angiography-derived RWS analysis provides a potential real-time and in-procedure method for evaluating plaque mechanics with no need for additional radiation or contrast agent exposure, thereby facilitating optimised procedures. Further longitudinal studies with predefined endpoints are needed to substantiate and validate these findings. AUC: area under the curve; DSA: digital subtraction angiography; DS%: percentage diameter stenosis; MRI: magnetic resonance imaging; RWS: radial wall strain; RWSmax: maximum RWS
Table 1. Unadjusted and adjusted associations between DSA parameters and carotid plaque vulnerability.
| Independent variable | Univariable analysis | Multivariable analysis† | ||
|---|---|---|---|---|
| OR | p-value | OR | p-value | |
| Per-plaque analysis* | ||||
| RWSmax | 1.53 (1.28-1.83) | <0.001 | 1.45 (1.18-1.77) | <0.001 |
| DS% | 1.04 (1.02-1.07) | 0.001 | 1.01 (0.98-1.04) | 0.66 |
| Lesion length | 1.11 (1.04-1.19) | 0.003 | 1.05 (0.98-1.13) | 0.15 |
| Per-patient analysis | ||||
| RWSmax | 1.52 (1.25-1.85) | <0.001 | 1.48 (1.17-1.85) | <0.001 |
| DS% | 1.04 (1.01-1.07) | 0.003 | 1.01 (0.98-1.04) | 0.60 |
| Lesion length | 1.09 (1.01-1.17) | 0.035 | 1.04 (0.96-1.13) | 0.34 |
| Age | 1.02 (0.96-1.08) | 0.58 | 1.00 (0.93-1.07) | 0.98 |
| Sex | 0.57 (0.15-2.17) | 0.41 | 0.44 (0.11-1.79) | 0.25 |
| Data in parentheses are 95% confidence intervals. *Adjusted for within-patient clustering by using mixed-effects logistic regression models. †The plaque-level multivariable model was adjusted by DS% and lesion length, and the patient-level model was adjusted by age, sex, DS% and lesion length. DS%: percentage diameter stenosis; OR: odds ratio; RWSmax: maximum radial wall strain | ||||
Funding
This study was supported by the Leading Talent Program of Shanghai Municipal Health Commission (2022LJ023), Science and Technology Commission of Shanghai Municipality Explorer Project (22TS1400600), National Natural Science Foundation of China (82271942), and Renji Hospital (RJKY23-004, IIT-2024-0068).
Conflict of interest statement
S. Tu is a cofounder of, has received research grants from, and been a consultant for Pulse Medical. The other authors have no conflicts of interest to declare relevant to the contents of this paper.
Supplementary data
To read the full content of this article, please download the PDF.