Cory:
Unlock Your AI Assistant Now!
Abstract
Background: Prolonged lipid-lowering therapy has demonstrated its ability to induce plaque regression and improve the plaque morphology of mild atherosclerotic lesions.
Aims: This trial aimed to assess the short-term effect of evolocumab in addition to high-intensity statin therapy (HIST) on relevant non-culprit coronary artery lesions using fractional flow reserve (FFR) measurements and multimodality intracoronary imaging.
Methods: Patients with an acute coronary syndrome (ACS) and relevant multivessel disease were randomised to receive either evolocumab or placebo for 12 weeks in addition to HIST. Patients underwent serial FFR and intravascular ultrasound (IVUS)-near-infrared spectroscopy imaging of a non-culprit vessel. The primary endpoints were the differences in the change in FFR and in the maximum lipid core burden index within any 4 mm segment (maxLCBI4mm). The secondary endpoints were the differences in the change in IVUS-derived atheroma volume parameters.
Results: Among 150 patients (mean age 64.2±8.5 years; 27 [18.0%] female) randomised to evolocumab (n=74) or placebo (n=76), 143 underwent follow-up coronary angiography. After 12 weeks of treatment, the adjusted mean change in FFR was 0.00 (95% confidence interval [CI]: −0.02 to 0.02) with evolocumab versus 0.01 (95% CI: −0.01 to 0.03) with placebo (adjusted mean difference: −0.01, 95% CI: −0.03 to 0.01; p=0.6). The adjusted mean change in the maxLCBI4mm was −27.8 (95% CI: −72.2 to 16.6) for evolocumab-treated patients versus −35.6 (95% CI: −82.5 to 11.4) for placebo-treated patients (adjusted mean difference: 7.8, 95% CI: −40.9 to 56.4; p=0.8). No between-group differences in any IVUS-derived parameter were found.
Conclusions: In patients with ACS and relevant non-culprit coronary artery lesions, the addition of evolocumab to HIST for 12 weeks, compared to placebo, did not result in improvement of FFR or maxLCBI4mm. (ClinicalTrials.gov: NCT04141579)
The risk of recurrent major adverse cardiac events (MACE) after acute coronary syndrome (ACS) remains high1. After initial treatment of the culprit lesion with percutaneous coronary intervention (PCI), the majority of recurrent myocardial infarctions (MIs) originate from other pre-existing, non-culprit atherosclerotic lesions2. The presence of severe non-culprit lesions (e.g., >70% diameter stenosis) is the strongest predictor of recurrent ischaemic events after MI3. A high plaque volume, assessed via intravascular ultrasound (IVUS), and a lipid-rich composition, assessed via near-infrared spectroscopy (NIRS), in less severe non-culprit lesions have also been shown to identify lesions at risk of new events34.
Immediate adjunctive pharmacotherapy with hydroxymethylglutaryl-CoA reductase inhibitors (statins) reduces recurrent events and has been shown to induce plaque regression and to improve plaque composition over time5678910. The introduction of proprotein convertase subtilisin/kexin type 9 (PCSK9) inhibitors leads to a further reduction in low-density lipoprotein cholesterol (LDL-C) levels within weeks after ACS1112. Multiple trials have demonstrated that the addition of PCSK9 inhibitors to high-intensity statin therapy (HIST) has favourable effects on atherosclerotic plaque by improving plaque dimensions and reducing lipid content131415. While these trials included non-target lesions with only mild visual obstruction, the effect on more severe lesions might be more pronounced. Consequently, short-term effects might influence the decision on additional PCI of these lesions. Fractional flow reserve (FFR) as a haemodynamic assessment of coronary lesions has served as an objective measurement to guide treatment decisions on PCI of visually indeterminate lesions16. Therefore, the “Functional Improvement of Non-infarcT relaTed Coronary Artery Stenosis by Extensive LDL-C Reduction With a PCSK9 Antibody” (FITTER) trial sought to evaluate the effect of 12 weeks of maximal LDL-C reduction by evolocumab in addition to HIST compared to placebo on non-culprit vessel FFR and on the plaque composition of haemodynamically relevant lesions in patients with ACS and multivessel disease.
Methods
Trial design
The FITTER trial (ClinicalTrials.gov: NCT04141579) was an investigator-initiated, multicentre, double-blind, placebo-controlled, randomised clinical trial conducted at seven centres in the Netherlands. The medical ethical committee (METC Oost-Nederland) approved the study protocol, and all patients provided written informed consent. The study protocol and statistical analysis plan are available in Supplementary Appendix 1 and Supplementary Appendix 2, respectively, and the study design has been previously described17. Patients 18 years or older hospitalised with ST-segment elevation myocardial infarction (STEMI), non-STEMI (NSTEMI), or unstable angina pectoris (UAP) were screened. In short, patients were deemed eligible if successful PCI of the infarct-related artery (IRA) was performed and if at least one epicardial coronary artery stenosis with an FFR of 0.67-0.85 amenable for PCI was present. Lesions in the non-IRA with a visually estimated angiographic stenosis exceeding 30% were considered suitable for FFR measurement. Major exclusion criteria were prior coronary artery bypass grafting, untreated functional left main stem stenosis (FFR ≤0.80), or severe kidney dysfunction. For detailed inclusion/exclusion criteria, see Supplementary Table 1. Written informed consent was preferably obtained before the index procedure. However, in some emergency cases (i.e., STEMI), oral informed consent was given for invasive study procedures during the index procedure, with full written informed consent for the entire study acquired afterwards. In preselected centres with the ability to perform additional IVUS-NIRS, baseline imaging acquisition was achieved after FFR measurement in a subset of the overall study population. After the index study procedure, patients were randomised in a 1:1 fashion into two groups (evolocumab or placebo) using a 2:4:6 random block randomisation algorithm. Randomisation was stratified per study site. The first study drug (biweekly 140 mg evolocumab or matching placebo) dose was given as soon as possible after randomisation, preferably within 24 hours after the index procedure. Patients received HIST as background therapy, e.g., atorvastatin 40 mg daily or rosuvastatin 20 mg daily. During the follow-up phase of the study, patients were contacted regularly (at weeks 1, 4, 6, and 8) to monitor clinical status, evaluate treatment adherence, and to screen for potential adverse events. At week 12, repeat coronary angiography with FFR measurement and IVUS-NIRS imaging of the non-IRA lesions was performed. Patients, treating physicians, and the research team were blinded to LDL-C measurements throughout the study.
FFR measurement and IVUS-NIRS imaging acquisition
Details about FFR measurements, as well as the acquisition and analysis of IVUS-NIRS imaging, have been described in the protocol and statistical analysis plan. At week 12, FFR measurements were repeated with the pressure wire at the exact same position as baseline. Hyperaemia was achieved similarly for baseline and follow-up measurements. When IVUS-NIRS imaging was performed at baseline, follow-up imaging of the same artery was also performed at week 12. IVUS and NIRS images were analysed offline by an independent core laboratory (Cardiovascular Research Institute, Dublin, Ireland). Core laboratory personnel were blinded to all other patient data, outcome data, and the sequence of imaging (baseline vs follow-up). For IVUS, frames were analysed every 1 mm in matched coronary artery segments. The arterial lumen and external elastic membrane (EEM) borders were delineated from IVUS images. For NIRS, the 4 mm segment with the maximum lipid core burden index (maxLCBI4mm) was identified within the same segments used for IVUS analyses. IVUS outcome parameters were derived as follows:
• Percent atheroma volume (PAV) was calculated according to the following equation:
[Σ(EEMarea – lumenarea) / ΣEEMarea] x 100
• Normalised total atheroma volume (TAV) was calculated according to the following equation:
[Σ(EEMarea – lumenarea) / number of images in pullback] × median number of images in cohort
• The maximum plaque burden (PB) was defined as the highest single-slice PB within the coronary artery segment:
[(EEMarea – lumenarea) / EEMarea] x 100
• The minimum lumen area (MLA) refers to the smallest lumen area within the coronary artery segment.
Outcomes
The two primary endpoints of this trial were the differences in the change in FFR (primary physiological endpoint) and in maxLCBI4mm (primary imaging endpoint) from baseline to follow-up in the non-IRA between evolocumab- and placebo-treated patients.
The secondary endpoints of this trial were the differences in change in IVUS-derived plaque characteristics of the non-IRA:
• percent atheroma volume
• normalised total atheroma volume
• maximum plaque burden
• minimum lumen area
A detailed list of all study endpoints is presented in Supplementary Table 2.
Statistical methods
The study was originally designed with a single primary endpoint (the change in FFR) and a powered secondary endpoint (the change in maxLCBI4mm). During the execution of the study, the importance of plaque composition as a predictor of non-culprit MACE and as a target for PCSK9 inhibitors was further recognised in contemporary publications313. Therefore, before completion of the trial and prior to unblinding, the powered secondary endpoint was upgraded to a second primary endpoint in an official amendment to the study protocol (version 8.0), which included a correspondingly updated statistical analysis plan.
Statistical comparisons of baseline to follow-up between the two groups were performed using an analysis of covariance (ANCOVA) model including the treatment and randomisation stratification centre as fixed factors, corrected for the baseline value of that specific outcome. The analysis of the first primary endpoint (the change in FFR) was performed on the full analysis set, which included all patients with available serial FFR data. The analyses of the second primary endpoint (the change in maxLCBI4mm) and IVUS-derived secondary endpoints included all patients in the full analysis set with available serial NIRS or IVUS data, respectively. Participants were grouped according to their randomised treatment group assignment. Analyses of adverse events included patients who had received at least one administration of the study drug.
The study was considered positive in the presence of a statistically significant difference in at least one primary endpoint. Both primary endpoints were tested independently. A Hochberg correction was performed to maintain the overall familywise error rate at 0.05. In short, if the largest p-value was <0.05, both null hypotheses were rejected; if the largest p-value was ≥0.05, the smaller p-value was compared with alpha=0.025. If the smallest p-value was <0.025, then the null hypothesis corresponding to that primary outcome variable was rejected. The p-values for the secondary endpoints were only interpreted (i.e., the subsequent null hypotheses can only be rejected) if at least one of the null hypotheses of both primary endpoints was rejected. The secondary endpoints were tested using a hierarchical procedure, and a p-value of <0.05 was considered statistically significant.
The overall changes from baseline to follow-up were also examined using paired t-tests. Analysis of the LDL-C measurements over time was carried out using a repeated measures model with an unstructured variance-covariance matrix. All reported p-values are two-sided. Statistical analyses were performed using SPSS Statistics, version 29.0 (IBM).
Sample size: power analysis of the primary endpoints
Details about the sample size calculation are provided in the statistical analysis plan (Supplementary Appendix 2). For our first primary endpoint (FFR), based on ANCOVA, a total sample size of 127 would provide 80% power to detect an expected between-group difference at follow-up of 0.03, using a 2-sided alpha level of 0.05. To compensate for a dropout rate of about 15%, a total of 150 patients were to be included at baseline. After upgrading the powered secondary endpoint to a second primary endpoint, no change was made to the initial sample size. In case the FFR had to be tested with an alpha of 0.025, this would result in less power (approximately 76%, under similar conditions and considering our eventual lower dropout ratio of 5.3%). For our second primary endpoint (maxLCBI4mm), based on ANCOVA, an expected 14.2% larger decrease in the evolocumab group, at a 2-sided alpha level of 0.025, and to compensate for a dropout rate of about 20%, a total of 84 patients were to be included at baseline to reach 90% power.
Results
Patient characteristics
Between 10 November 2020 and 17 August 2023, a total of 150 patients (35.3% STEMI, 60% NSTEMI, 4.7% UAP) were included and randomised to receive treatment with evolocumab (n=74) or placebo (n=76). The patient flowchart is presented in Figure 1. Overall, 143 patients underwent coronary angiography for follow-up endpoint measurements. At baseline, successful IVUS and NIRS pullbacks were performed in 95 and 94 patients, respectively (1 IVUS-NIRS catheter failed to record the NIRS signal). At follow-up, IVUS-NIRS was successfully repeated in 86 patients. All patients received at least one study drug administration, and a total of 138 patients received all study drug injections per protocol. The clinical characteristics of all randomised patients are presented in Table 1. At admission, 41 patients (27.3%) were receiving any statin therapy, of whom 15 patients (10.0%) were on HIST. At discharge and follow-up, 141 (94.6%) and 136 (93.8%) patients were on HIST, respectively (Supplementary Table 3, Supplementary Table 4). Overall, 142, 85, and 86 patients were included in the paired analyses of FFR, maxLCBI4mm, and IVUS-derived parameters, respectively. Patients with additional IVUS imaging at baseline were similar to the overall group of patients (Supplementary Table 5). Of the 143 patients who underwent repeat coronary angiography, additional PCI was performed in 60 (42.0%) patients.
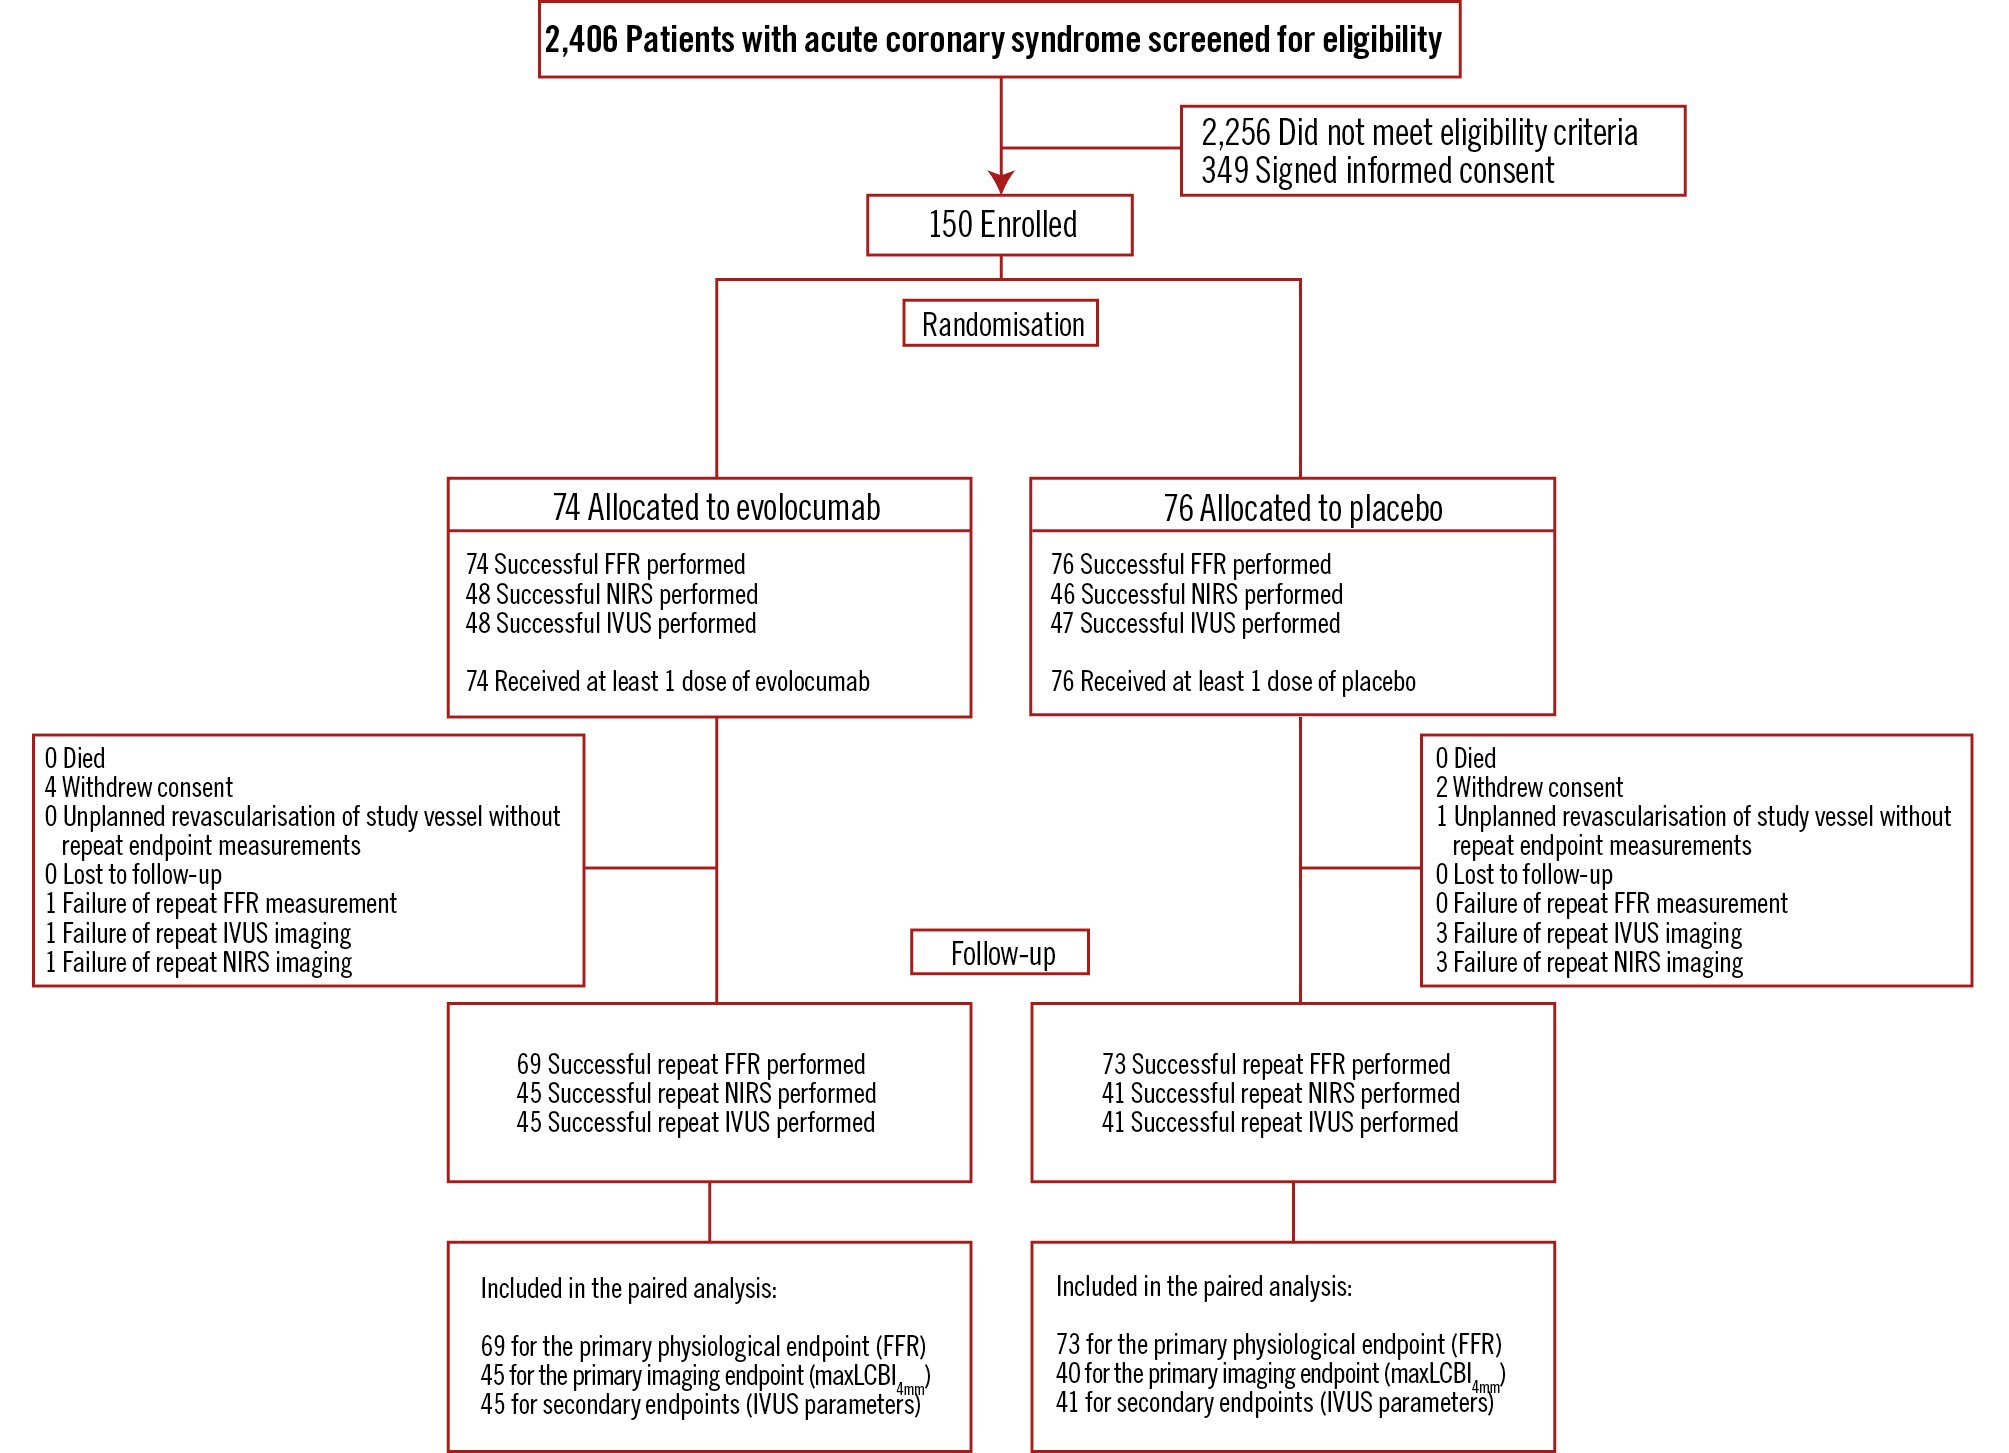
Figure 1. Flow of patients in the FITTER trial. Overall, 143 patients underwent coronary angiography for follow-up endpoint measurements. At baseline, successful IVUS and NIRS pullbacks were performed in 95 and 94 patients, respectively (one IVUS-NIRS catheter failed to record the NIRS signal). At follow-up, IVUS-NIRS was repeated in 86 patients. In 9 patients, repeat IVUS-NIRS was not available: 4 patients withdrew consent, the IVUS-NIRS catheter was unable to cross the lesion in 2 patients, repeat IVUS-NIRS was not possible in 2 patients due to a defective device, and 1 patient was revascularised at the request of the treating physician because of poor left ventricular function 2 weeks after inclusion (unplanned revascularisation of the study vessel without repeat endpoint measurements). FFR: fractional flow reserve; IVUS: intravascular ultrasound; maxLCBI4mm: maximum lipid core burden index within a 4 mm segment; NIRS: near-infrared spectroscopy
Table 1. Baseline characteristics of all patients randomised in the FITTER trial.
| Evolocumab (n=74) | Placebo (n=76) | |
|---|---|---|
| Demographics | ||
| Age, years | 63.5±8.3 | 65.0±8.8 |
| Male sex | 58 (78.4) | 65 (85.5) |
| Female sex | 16 (21.6) | 11 (14.5) |
| BMI, kg/m2 | 27.3±4.1 | 27.4±3.9 |
| Cardiovascular risk factors | ||
| Hypertension | 29 (39.2) | 30 (39.5) |
| Dyslipidaemia | 29 (39.2) | 34 (44.7) |
| Family history of premature CAD | 25 (34.7) | 32 (42.1) |
| Smoking history | 54 (73.0) | 56 (73.7) |
| Current smoker | 24 (32.4) | 21 (27.6) |
| Diabetes mellitus | 6 (8.1) | 9 (11.8) |
| Insulin-treated diabetes mellitus | 1 (1.4) | 3 (3.9) |
| Medical history | ||
| Stroke or TIA | 4 (5.4) | 3 (3.9) |
| Peripheral artery disease | 3 (4.1) | 0 (0) |
| Prior myocardial infarction | 7 (9.5) | 13 (17.1) |
| Prior PCI | 11 (14.9) | 13 (17.1) |
| Premature CVD (CAD/stroke/TIA/PAD) | 5 (6.8) | 3 (3.9 ) |
| Baseline lipid-lowering therapy | ||
| Any statins | 18 (24.3) | 23 (30.3) |
| High-intensity statin therapya | 8 (10.8) | 7 (9.2) |
| Ezetimibe | 2 (2.7) | 3 (3.9) |
| Fibrates | 1 (1.4) | 0 (0) |
| Niacin | 0 (0) | 0 (0) |
| Resins | 0 (0) | 0 (0) |
| Other cardiac medications | ||
| Aspirin | 14 (18.9) | 19 (25.0) |
| ADPRI (ticagrelor/clopidogrel/prasugrel) | 3 (4.1) | 5 (6.6) |
| DAPT | 1 (1.4) | 3 (3.9) |
| ACE inhibitor | 10 (13.5) | 8 (10.5) |
| ARB | 6 (8.1) | 7 (9.2) |
| Beta blocker | 11 (14.9) | 16 (21.1) |
| Type of ACS | ||
| STEMI | 26 (35.1) | 27 (35.5) |
| NSTEMI | 45 (60.8) | 45 (59.2) |
| UAP | 3 (4.1) | 4 (5.3) |
| Study vessel | ||
| LAD | 60 (81.1) | 49 (64.5) |
| RCA | 5 (6.8) | 9 (11.8) |
| Cx | 9 (12.2) | 18 (23.7) |
| Data are given as mean±SD or n (%). aAtorvastatin ≥40 mg, rosuvastatin ≥20 mg or simvastatin ≥80 mg. Note: BMI calculated as weight in kilograms divided by height in metres squared. ACE: angiotensin-converting enzyme; ACS: acute coronary syndrome; ADPRI: adenosine diphosphate receptor inhibitor; ARB: angiotensin receptor blocker; BMI: body mass index; CAD: coronary artery disease; CVD: cardiovascular disease; Cx: circumflex artery; DAPT: dual antiplatelet therapy; LAD: left anterior descending artery; NSTEMI: non-STEMI; PAD: peripheral artery disease; PCI: percutaneous coronary intervention; RCA: right coronary artery; SD: standard deviation; STEMI: ST-segment elevation myocardial infarction; TIA: transient ischaemic attack; UAP: unstable angina pectoris | ||
Biochemical measurements
The change in lipid levels for all patients who completed clinical follow-up of the study are summarised in Supplementary Table 6. As the majority of patients were not on any statin therapy at baseline, both the placebo and evolocumab group showed significant improvement in their lipid levels. After 12 weeks of treatment, evolocumab-treated patients demonstrated greater reductions in levels of triglycerides (adjusted mean difference: −0.2 mmol/L, 95% confidence interval [CI]: −0.4 to −0.0; p=0.03), total cholesterol (adjusted mean difference: −1.3 mmol/L, 95% CI: −1.5 to −1.0; p<0.001), non-high-density lipoprotein cholesterol (adjusted mean difference: −1.3 mmol/L, 95% CI: −1.5 to −1.0; p<0.001) and LDL-C (adjusted mean difference: −1.2 mmol/L, 95% CI: −1.4 to −1.0; p<0.001). Figure 2 emphasises the faster and larger reduction of LDL-C in the evolocumab group. After just 1 week, LDL-C was already significantly lower compared to the placebo group (between-group difference: −1.2 mmol/L, 95% CI: −1.4 to −1.0). This difference was maintained throughout the 12-week period.
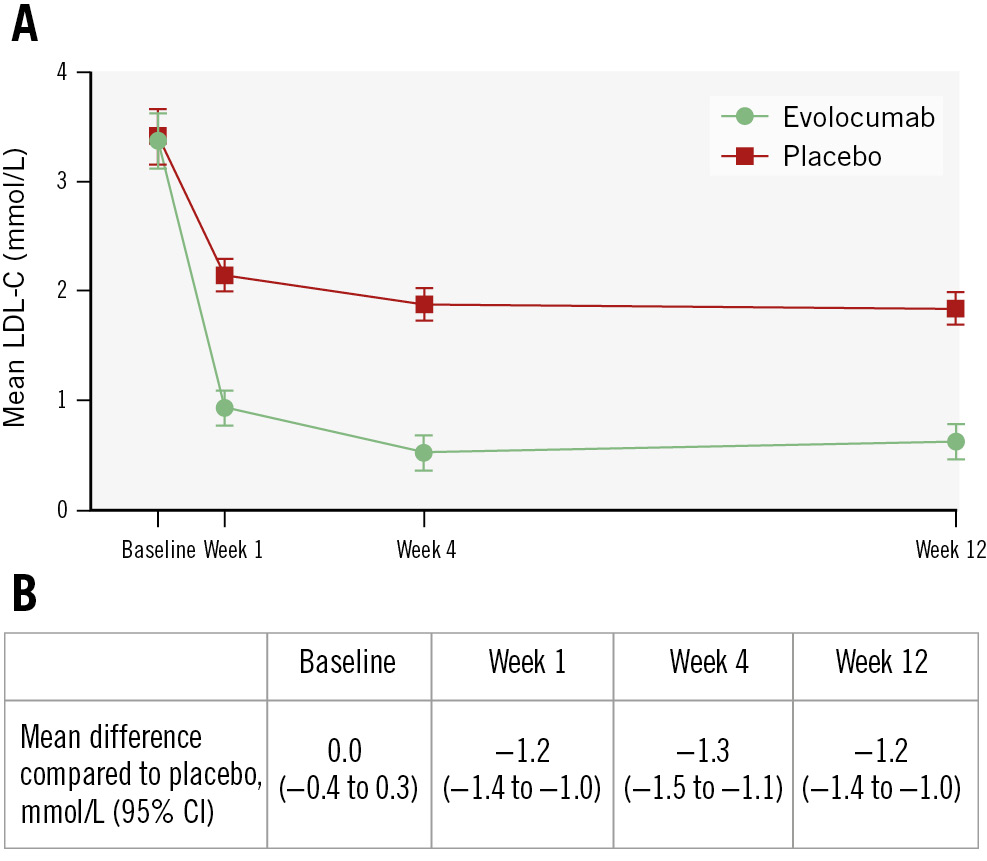
Figure 2. A) Mean LDL-C values in the two study groups over time; error bars indicate 95% CIs. B) Mean difference between the evolocumab and placebo groups. To convert LDL-C values to mg/dL, divide by 0.0259. CI: confidence interval; LDL-C: low-density lipoprotein cholesterol
Primary and secondary endpoints
Primary haemodynamic endpoint: FFR
At baseline, the mean FFR was 0.78±0.04 in the evolocumab group and 0.78±0.05 in the placebo group. After 12 weeks of treatment, the adjusted mean change in FFR was 0.00 (95% CI: −0.02 to 0.02) with evolocumab versus 0.01 (95% CI: −0.01 to 0.03) with placebo (adjusted mean difference: −0.01, 95% CI: −0.03 to 0.01; p=0.6) (Table 2, Figure 3, Central illustration). The overall difference in FFR from baseline to follow-up is listed in Supplementary Table 7. Thirty patients (12 in the evolocumab group and 18 in the placebo group) with an impaired FFR at baseline (≤0.80) improved to a level>0.80 at follow-up, which often resulted in cancelled PCI (Figure 3). Ten patients with a negative FFR at baseline had a positive FFR at follow-up.
Table 2. Primary and secondary outcome parameters of the FITTER trial.
| Intracoronary physiology | Evolocumab (n=69) | Placebo (n=73) | p-value |
|---|---|---|---|
| Fractional flow reserve | |||
| Baseline | 0.78±0.04 | 0.78±0.05 | |
| Follow-up | 0.77±0.06 | 0.79±0.08 | |
| Adjusted mean change | 0.00 (−0.02 to 0.02) | 0.01 (−0.01 to 0.03) | |
| Adjusted mean difference in change compared to placebo | −0.01 (−0.03 to 0.01) | 0.6 | |
| Near-infrared spectroscopy parameters | Evolocumab (n=45) | Placebo (n=40) | p-value |
| MaxLCBI4mm | |||
| Baseline | 357.4±177.2 | 359.9±175.7 | |
| Follow-up | 324.2±184.8 | 318.0±155.1 | |
| Adjusted mean change | −27.8 (−72.2 to 16.6) | −35.6 (−82.5 to 11.4) | |
| Adjusted mean difference in change compared to placebo | 7.8 (−40.9 to 56.4) | 0.8 | |
| LCBItotala | |||
| Baseline | 86.5±52.8 | 88.8±69.4 | |
| Follow-up | 73.6±47.8 | 70.8±56.0 | |
| Adjusted mean change | −14.9 (−29.2 to −0.5) | −19.1 (−34.4 to −3.8) | |
| Adjusted mean difference in change compared to placebo | 4.2 (−11.7 to 20.2) | ||
| Intravascular ultrasound parameters | Evolocumab (n=45) | Placebo (n=41) | p-value |
| Percent atheroma volume, % | |||
| Baseline | 48.3±6.8 | 47.0±7.7 | |
| Follow-up | 47.6±5.9 | 46.7±7.7 | |
| Adjusted mean change | −0.5 (−1.7 to 0.6) | −0.4 (−1.5 to 0.8) | |
| Adjusted mean difference in change compared to placebo | −0.2 (−1.4 to 1.0) | ||
| Normalised total atheroma volume, mm3 | |||
| Baseline | 381.7±135.1 | 370.7±123.6 | |
| Follow-up | 370.5±127.1 | 364.1±116.9 | |
| Adjusted mean change | −7.5 (−23.5 to 8.6) | −3.9 (−20.8 to 13.1) | |
| Adjusted mean difference in change compared to placebo | −3.6 (−21.1 to 13.9) | ||
| Maximum plaque burden, % | |||
| Baseline | 71.2±6.8 | 70.4±7.3 | |
| Follow-up | 70.2±6.7 | 69.8±7.2 | |
| Adjusted mean change | −0.6 (−2.1 to 0.9) | −0.3 (−1.8 to 1.3) | |
| Adjusted mean difference in change compared to placebo | −0.3 (−1.9 to 1.3) | ||
| Minimum lumen area, mm2 | |||
| Baseline | 3.7±1.1 | 3.7±0.7 | |
| Follow-up | 3.6±1.2 | 3.6±0.7 | |
| Adjusted mean change | 0.0 (−0.2 to 0.3) | −0.0 (−0.3 to 0.2) | |
| Adjusted mean difference in change compared to placebo | 0.1 (−0.2 to 0.3) | ||
| Data are presented as mean±SD or as mean (95% CI). aSerial LCBItotal values were missing for two evolocumab- (n=43) and two placebo-treated (n=38) patients. CI: confidence interval; LCBItotal: total segment lipid core burden index; maxLCBI4mm: maximum lipid core burden index within any 4 mm segment; SD: standard deviation | |||
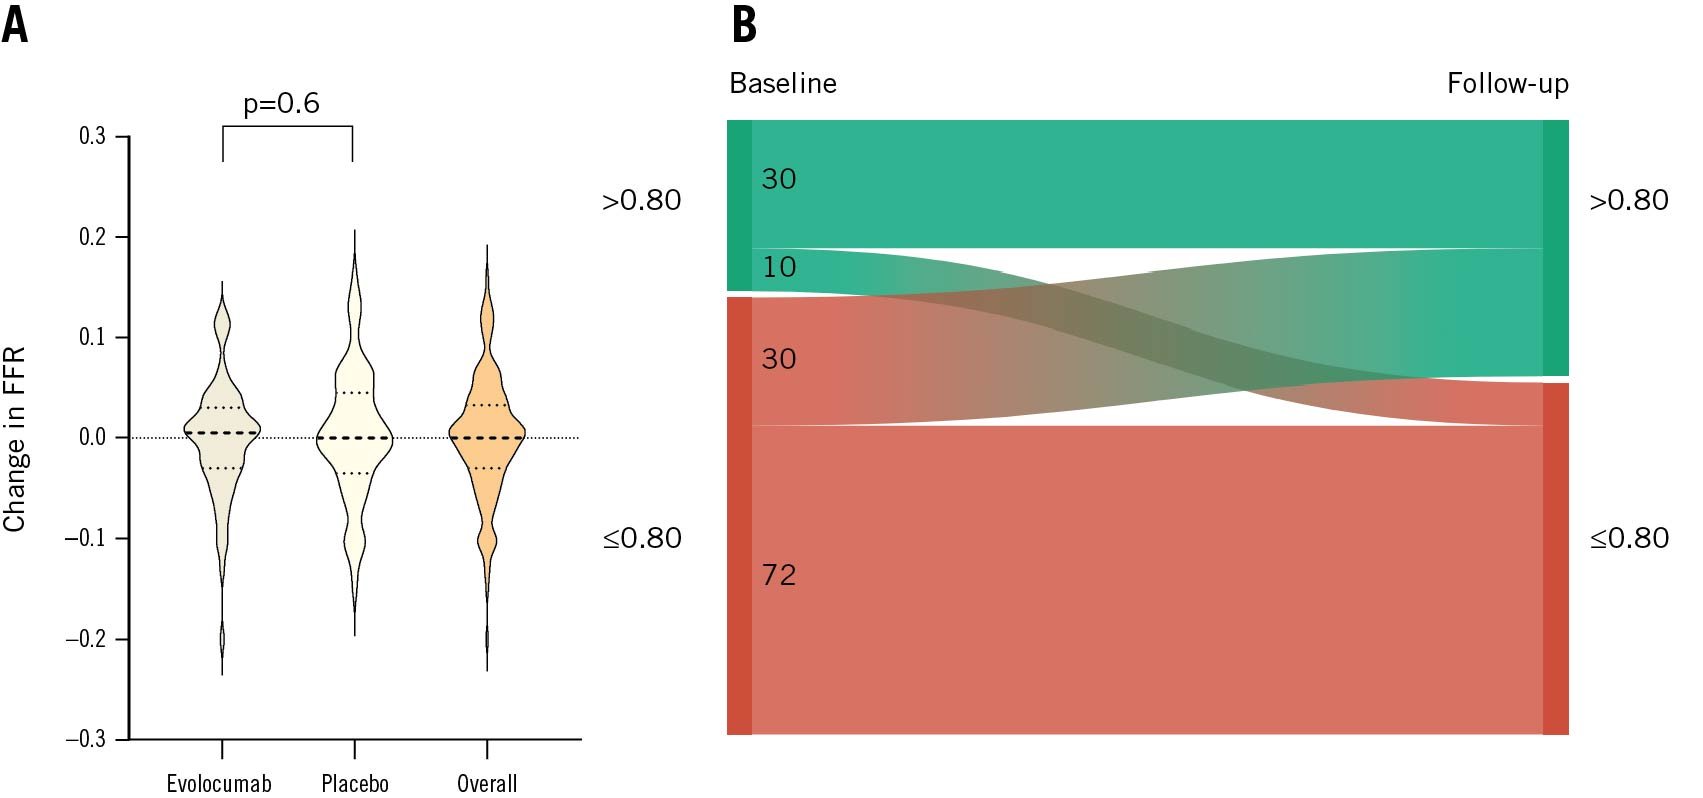
Figure 3. Changes in FFR (primary haemodynamic endpoint) and FFR reclassification of the patients in the FITTER trial. A) The violin plot displays the observed changes in FFR values from baseline to follow-up. Dotted lines within the violin plots present the median, 25th, and 75th percentiles. No difference in change between evolocumab- and placebo-treated patients was found (adjusted mean difference: −0.01, 95% CI: −0.03 to 0.01; p=0.6). Also, no overall change in FFR was observed (overall change: 0.00, 95% CI: 0.01 to −0.01). B) The Sankey diagram shows the overall change in the FFR group (>0.80 or ≤0.80) from baseline to follow-up. CI: confidence interval; FFR: fractional flow reserve
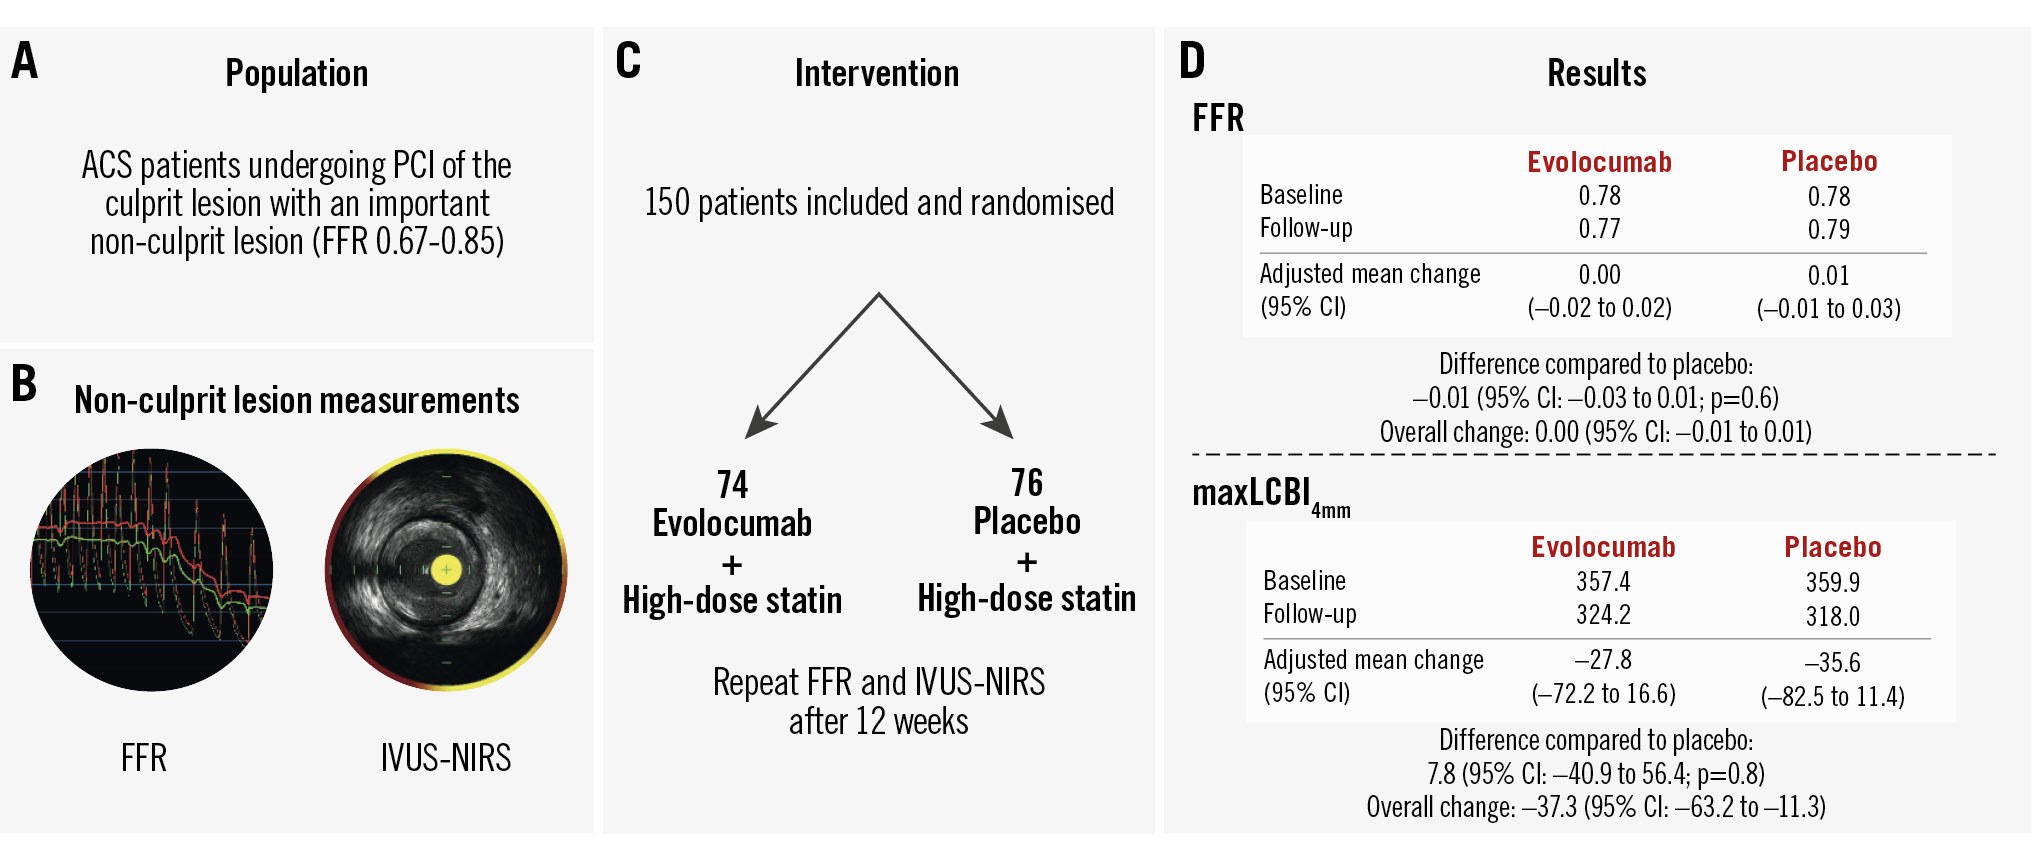
Central illustration. Efficacy of 12 weeks of evolocumab treatment in addition to high-intensity statin therapy to improve the functional and morphological characteristics of relevant non-culprit coronary artery stenosis. A) Trial population; (B) non-culprit lesion assessment: FFR and IVUS-NIRS; (C) trial design; (D) results. In this double-blind, placebo-controlled, randomised clinical trial among patients presenting with ACS and relevant multivessel disease, the addition of evolocumab to high-intensity statin therapy for 12 weeks, compared to placebo, did not result in the improvement of FFR or plaque lipid content. ACS: acute coronary syndrome; CI: confidence interval; FFR: fractional flow reserve; IVUS-NIRS: intravascular ultrasound-near-infrared spectroscopy; maxLCBI4mm; maximum lipid core burden index within a 4 mm segment; PCI: percutaneous coronary intervention
Primary imaging endpoint: maxLCBI4mm
The adjusted mean change in maxLCBI4mm was −27.8 (95% CI: −72.2 to 16.6) for patients treated with evolocumab versus −35.6 (95% CI: −82.5 to 11.4) for patients treated with placebo (adjusted mean difference: 7.8, 95% CI: −40.9 to 56.4; p=0.8) (Table 2, Figure 4, Central illustration). In line with this, no difference in the change in LCBItotal was found (adjusted mean difference: 4.2, 95% CI: −11.7 to 20.2) (Table 2). Supplementary Table 7 provides a summary of the overall differences observed in LCBI values. After 12 weeks of treatment, 13 out of 48 vessels (27.1%) displaying lipid-rich regions (in 7 and 6 patients randomised to evolocumab and placebo, respectively) were reclassified as non-lipid rich according to the previous reported cutoff of 324.7 (Figure 4)3.
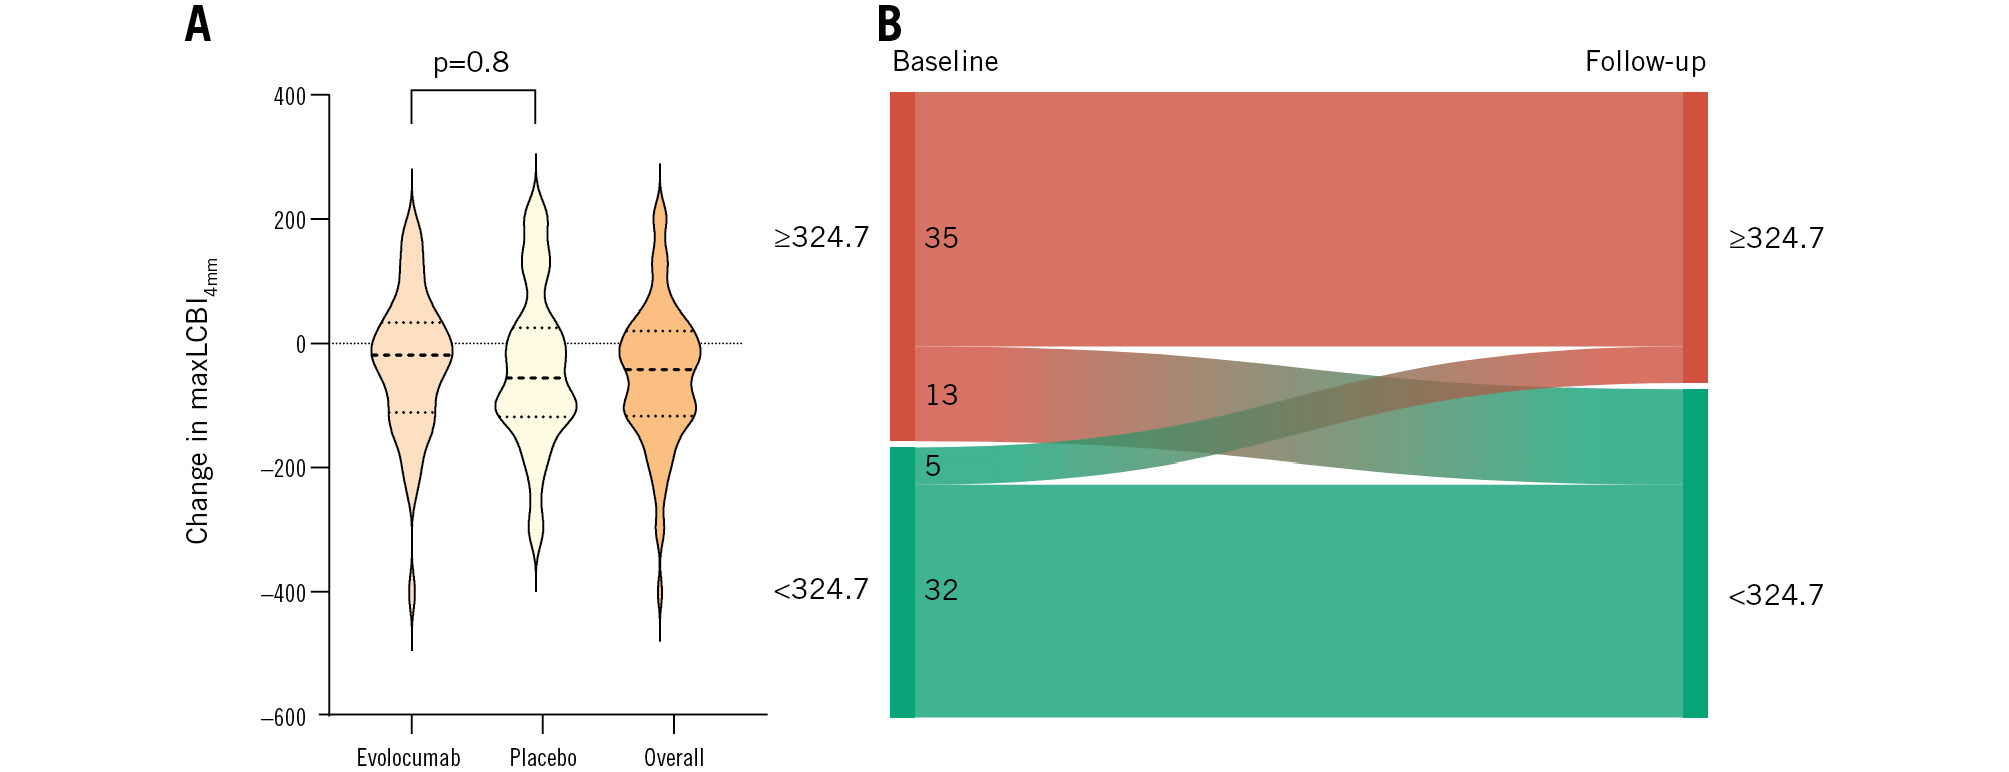
Figure 4. Changes in maxLCBI4mm (primary imaging endpoint) and maxLCBI4mm reclassification of the patients in the FITTER trial. A) The violin plot displays the observed changes in maxLCBI4mm values from baseline to follow-up. Dotted lines within the violin plots present the median, 25th, and 75th percentiles. There was no significant difference between the change in evolocumab- and placebo-treated patients (adjusted mean difference: 7.8, 95% CI: −40.9 to 56.4; p=0.8). An overall reduction in maxLCBI4mm was observed (overall change: −37.3, 95% CI: −63.2 to −11.3). B) The Sankey diagram shows the overall transition of lipid-rich plaque (maxLCBI4mm ≥324.7) to non-lipid rich (maxLCBI4mm <324.7) from baseline to follow-up. CI: confidence interval; maxLCBI4mm: maximum lipid core burden index within any 4 mm segment
Secondary endpoints: IVUS parameters
At baseline, the mean PAV was 48.3±6.8% in the evolocumab group and 47.0±7.7% in the placebo group. At follow-up, the adjusted mean change in PAV was −0.5% (95% CI: −1.7 to 0.6) for evolocumab-treated patients versus −0.4% (95% CI: −1.5 to 0.8) for placebo-treated patients (adjusted mean difference: −0.2%, 95% CI: −1.4 to 1.0). Similarly, no significant differences between patients treated with evolocumab or placebo were found in normalised TAV (adjusted mean difference: −3.6 mm3, 95% CI: −21.1 to 13.9), maximum PB (adjusted mean difference: -0.3%, 95% CI: −1.9 to 1.3), or MLA (adjusted mean difference: 0.1 mm2, 95% CI: −0.2 to 0.3) (Table 2). The overall changes from baseline to follow-up are presented in Supplementary Table 7.
Safety and clinical events
During the execution of the study, clinical events were scarce. No myocardial infarction due to a culprit lesion in the study vessel occurred. One patient experienced a stroke after the index procedure. Two patients had an expedited follow-up procedure due to progressive chest pain. However, in one of the patients, the chest pain was likely of non-cardiac origin, as the FFR results were not significant. One patient died due to an unknown cause nine days after the follow-up procedure and PCI of the study vessel.
Discussion
The FITTER trial aimed to investigate the full potential of intensive lipid-lowering therapy on relevant non-culprit lesions in ACS patients at very short follow-up. A more profound reduction in LDL-C was already achieved after 1 week of evolocumab therapy compared to the placebo group. Regarding the trial's primary and secondary outcomes, no between-group differences were found between evolocumab- and placebo-treated patients. Deferral of PCI of non-culprit lesions with an FFR of 0.67-0.85 did not result in safety issues in this trial.
Few studies have examined the impact of lipid-lowering therapy on change in intracoronary physiology. In the YELLOW trial, patients with chronic stable angina and a non-target lesion with an FFR ≤0.80 were imaged with IVUS-NIRS and randomised to HIST or a moderate statin-therapy dose7. After 6-8 weeks, FFR and IVUS-NIRS were repeated. A non-significant increase in FFR was observed in patients on HIST, while no improvement was noted in those treated with moderate statin therapy. The non-randomised FORTE trial assessed the effect of 12-month atorvastatin therapy on non-significant lesions in 95 patients18. Overall, no significant change in FFR was found. However, patients who achieved optimal LDL-C targets did demonstrate a significant increase in FFR. Furthermore, an inverse correlation between achieved LDL-C and change in FFR was found. In a substudy of the PACMAN-AMI trial, in which ACS patients were also randomised to PCSK9 inhibitors or placebo in addition to HIST, no significant improvement of quantitative flow ratio (QFR) in any group was found after 52 weeks of therapy19. Theoretically, LDL-C lowering reduces non-culprit plaque size, which in turn could increase FFR. In our study, a substantial fraction of non-culprit lesions improved from an impaired FFR to a non-significant FFR at follow-up. However, since the baseline FFR was close to the normal cutoff value, slight improvements and minimal variability might have contributed to this transition. Plaque size did not significantly differ after 12 weeks of therapy in either group, which may partially explain the absence of any observed differences on a continuous scale. Yet, patients in the FORTE trial and in the QFR substudy of PACMAN-AMI demonstrated no physiological improvement despite significant plaque size reduction. Therefore, greater plaque size reductions appear to be necessary to achieve improvements in intracoronary physiology. In addition, variability in non-culprit physiology between acute and late stages have been reported before20. It is hypothesised that the adenosine response is blunted to some degree in STEMI patients at presentation20. In addition, myocardial oedema and elevated left ventricular filling pressures might decrease initial hyperaemic non-culprit flow in the acute setting2122. However, data are conflicting. Multiple trials have reported stable non-culprit FFR measurements in STEMI and NSTEMI patients between the acute and stabilised phases232425. Therefore, the impact of ACS on non-culprit FFR seems to be reserved for patients presenting with large STEMI at very early stages. This appears to apply only minimally to the FITTER trial population, as only 35.3% of the patients presented with STEMI, and study vessel assessment was often performed during a second coronary angiography at the index hospitalisation. Nevertheless, the physiological differences between the acute and chronic phases after ACS might have masked slight changes.
The overall decreases of maxLCBI4mm and LCBItotal align with previous trials investigating the effect of lipid-lowering therapy on plaque composition71326. The reduction of intraplaque lipid occurs rapidly after intensification of lipid-lowering therapy726. In the YELLOW trial, the median change in maxLCBI4mm was 149.1 points in patients treated with HIST, while the moderate statin-therapy group demonstrated no improvement7. Moreover, a recent, small, single-arm trial by Kataoka et al observed a significant maxLCBI4mm reduction, from 387 to 315, in only 2 to 6 weeks after a single dose of a PCSK9 inhibitor26. In the FITTER trial, maxLCBI4mm decreased by 37.3 overall, which represents a markedly smaller reduction compared to the other trials assessing the short-term impact of LDL-C reduction726. The FITTER trial differs from other trials by including ACS patients in whom atherosclerotic disease has become destabilised, potentially featuring more vulnerable plaques that are less likely to show improvement27. Surprisingly, no between-group differences were found in maxLCBI4mm or LCBItotal in the FITTER trial. The short timeframe conceivably plays a major role. Also, only 41 patients (27.3%) were on any statin therapy at baseline. This is notably lower compared to the YELLOW trial and the study by Kataoka et al, in which approximately 82% and 85% of the patients, respectively, were on statin therapy at baseline726. Our findings may suggest a maximum speed of “lipid washout” when HIST is initiated. Over time, prolonged LDL-C reduction through PCSK9 inhibition has been shown to lead to a more profound decrease in maxLCBI4mm, as observed in the PACMAN-AMI trial13.
The GLAGOV, PACMAN-AMI, and HUYGENS trials reported incremental plaque regression when patients were treated with PCSK9 inhibitors in addition to HIST compared to HIST alone131415. Moreover, the HUYGENS and PACMAN-AMI trials observed a greater decline in PAV than the GLAGOV study, possibly due to a higher PAV at baseline131415. Since these trials only included patients with ≤50% visual lumen obstruction, we hypothesised that an even greater effect could be expected when significant lesions were included. Despite focusing on relevant lesions, baseline PAV was only modestly higher (47.6%) compared to PACMAN-AMI and HUYGENS (approximately 42% and 45%, respectively). On the other hand, baseline normalised TAV was notably greater (376.5 mm3 vs approximately 256 mm3 and 245 mm3 in PACMAN-AMI and HUYGENS, respectively), suggesting longer diseased arterial segments assessed by the FITTER trial. Moreover, vessels undergo positive remodelling in response to plaque growth, which preserves lumen area and limits initial PAV increase28. We observed an overall trend toward a reduction in normalised TAV and maximum PB; however, this was not statistically significant. Also, no between-group differences were found. In line with our results, no significant improvement of plaque volume parameters were reported in the YELLOW trial or the study by Kataoka et al, which also investigated the immediate impact on plaque volume726.
In view of current results and contemporary related trials, plaque stabilisation seems to precede plaque volume reduction when lipid-lowering therapy is intensified71326. The short-term overall reduction of plaque lipid content observed in the FITTER trial reinforces the fundamental importance of implementing lipid-lowering therapy immediately after ACS to mitigate future risk associated with vulnerable lipid-rich lesions. Our findings suggest that continuous treatment is required to induce significant plaque regression and further lipid content reduction. The potential of improving FFR within a very short timeframe seems limited. Further research with extended follow-up is needed to explore the long-term effects of an aggressive lipid-lowering therapy regimen on non-critical but relevant coronary artery lesions.
Limitations
This study has some limitations. First, baseline LDL-C values were lower compared to the PACMAN-AMI and HUYGENS trials (3.4 mmol/L vs approximately 4.0 mmol/L and 3.7 mmol/L, respectively), reducing treatment potential1314. On the other hand, the lack of LDL-C thresholds in the FITTER trial indicates that the current population represents a typical ACS population. Second, non-culprit FFR measurements might be overestimated in the ACS setting, particularly in patients presenting with large STEMI, potentially obscuring small effects on the changes in FFR. Third, despite focusing on relevant coronary artery lesions, baseline PAV was only moderately higher compared to other trials, curtailing therapeutic efficacy. Fourth, quantitative coronary analysis was not performed, which could have been useful in comparing current lesions with those from other trials. Finally, although the target sample size for the primary imaging endpoint was achieved, the cohort with serial IVUS imaging was still relatively small, limiting power to demonstrate significant overall and between-group differences.
Conclusions
Among patients presenting with ACS and relevant multivessel disease, the addition of evolocumab to HIST for 12 weeks, compared to placebo, did not result in the improvement of FFR or plaque lipid content. Further studies with extended follow-up are necessary to evaluate the impact of prolonged very high-intensity lipid-lowering therapy.
Impact on daily practice
In this multicentre, double-blind, placebo-controlled, randomised clinical trial of patients presenting with acute coronary syndrome and relevant non-culprit lesions, immediate introduction of intensive lipid-lowering therapy resulted in significant non-culprit plaque lipid regression in only 12 weeks. No short-term additional reduction of plaque lipid content by proprotein convertase subtilisin/kexin type 9 inhibition was found. Non-culprit plaque volume and coronary physiology showed no significant improvement after 12 weeks. Further studies with longer follow-up are needed to assess the effect and clinical outcomes of very high-intensity lipid-lowering therapy on significant non-critical, non-culprit coronary artery lesions.
Funding
The Radboud University Medical Center received funding from Amgen Europe B.V., Infraredx Inc., and Health Holland to execute this study. The funding providers were not involved in the study protocol design, data acquisition, or data analysis. Amgen Europe B.V. provided the investigational medical product, evolocumab, and matching placebo for the study and funding for the study management. Infraredx Inc. provided the Makoto Intravascular Imaging Platform (Infraredx) and IVUS-NIRS catheters and supported funding of the core lab analysis.
Conflict of interest statement
M.M. Reda Morsy reports funding from the European Association of Percutaneous Cardiovascular Interventions (EAPCI) Education and Training Grants Programme. R.M. Oemrawsingh reports speaker fees from Abbott and Terumo. C. von Birgelen reports institutional research grants from Abbott, Boston Scientific, Biotronik, and Medtronic, outside the current study. A.J.J. IJsselmuiden reports institutional fees from Medtronic, Meril Life Sciences, and Abbott; and consulting fees from Meril Life Sciences, Angiocare, Abbott, Philips, and Translumina. P.C. Smits reports institutional research grants from Abbott and SMT; and consulting or speaker fees from Abbott, MicroPort, SMT, and Terumo; he participates on a data safety monitoring board or advisory board of the LEGACY trial, PROCTOR trial, and on the global coronary advisory board of Abbott; he is a minor shareholder of the European Cardiovascular Research Center. V. Paradies reports institutional grants from Abbott; and personal consulting or speaker fees from Abbott, Boston Scientific, Elixir, and Novo Nordisk; she participates on advisory boards or committees of Boston Scientific, EAPCI Chair Congress Committee, and is an ESC CPC member. C. Camaro reports institutional speaker fees from AstraZeneca and from regional interventional cardiology meetings. P. Damman reports research grants from Abbott, Philips, Pie Medical Imaging, and AstraZeneca; and consulting fees from Philips and Abbott. M.H. van Wely reports consulting fees from Boston Scientific and Abbott. R.A. Byrne reports grants received by the institutions of employment for research or education from Abbott, Biosensors, Boston Scientific, and Translumina, without impact on personal remuneration, and he does not accept personal payments from the medical device or pharmaceutical industry. N. van Royen reports research grants from Biotronik, Abbott, Medtronic, and Philips; and speaker fees from Abbott, RainMed, MicroPort, and Bayer. R.-J.M. van Geuns reports consulting and speaker fees from Abbott and AstraZeneca; and has received institutional research grants from Amgen, InfraRedx, AstraZeneca, and Sanofi. The other authors have no conflicts of interest to declare.
Supplementary data
To read the full content of this article, please download the PDF.