Cory:
Unlock Your AI Assistant Now!
Abstract
Background: Clinical data are scarce comparing supra-annular self-expanding valves (SA-SEVs) and intra-annular (IA)-SEVs after transcatheter aortic valve implantation (TAVI), particularly in patients with a small aortic annulus (SAA).
Aims: We aimed to compare early clinical outcomes, including echocardiographic parameters, between the latest generation of IA-SEV and SA-SEV after TAVI in patients with SAA.
Methods: Focused on patients with SAA, defined as an annulus area ≤430 mm2, the data of 919 patients who underwent TAVI with an IA-SEV (n=518, Navitor) or an SA-SEV (n=401, Evolut FX) were retrospectively extracted. Differences in valve design on postprocedural results were investigated between the two groups and in the propensity score-matched (PSM) cohort.
Results: The postprocedural effective orifice area (EOA), indexed EOA, and mean pressure gradient (mPG) were similar in the overall cohort between the two groups (allp>0.05), whereas the mPG was higher with IA-SEVs than with SA-SEVs (8.74±5.01 mmHg vs 7.84±4.43 mmHg; p=0.049) after PSM (n=219 patients/group). There were no significant differences in the incidence of severe prosthesis-patient mismatch (1.9% vs 0.9%; p=0.405) or paravalvular leakage ≥mild (34.1% vs 42.2%; p=0.084) between the 2 groups in the PSM cohort. The rates of technical success (95.9% vs 95.8%), device success at discharge (91.3% vs 87.8%), and in-hospital death (1.4% vs 0.5%) were comparable in the overall cohort (allp>0.05). These results were not changed in the PSM cohort (allp>0.05).
Conclusions: The latest-generation IA-SEV and SA-SEV demonstrated similar clinical results except for a few echocardiographic findings after TAVI in patients with SAA.
With increased clinical evidence, transcatheter aortic valve implantation (TAVI) has been widely indicated in patients with severe aortic stenosis12. The main products of transcatheter heart valve (THV) design are balloon-expandable valves (BEVs) and supra-annular self-expanding valves (SA-SEVs). However, a recent pivotal randomised trial raised clinical concerns about the different echocardiographic parameters after BEV and SA-SEV implantation, especially in patients with a small aortic annulus (SAA)3. An intra-annular self-expanding valve (IA-SEV), Navitor (Abbott), was launched as the next-generation device for the predecessor Portico valve (Abbott). A larger effective orifice area (EOA), low postprocedural mean pressure gradient (mPG), and low rate of prosthesis-patient mismatch (PPM) were demonstrated in the overall cohort of our previous study4. Nonetheless, the higher position of the valve leaflet in the SEV series appeared to result in better echocardiographic parameters, particularly in patients with SAA. To date, the comparative data have not been fully validated in the SAA cohort after implantation of the latest generation of SEV. Therefore, the current study aimed to evaluate the postprocedural echocardiographic parameters and compare the latest-generation IA-SEV and SA-SEV in patients undergoing TAVI for SAA.
Methods
Study population
Data from this study were retrospectively extracted from the Optimized TransCathEter vAlvular iNtervention-Transcatheter Aortic Valve Implantation (OCEAN-TAVI) registry56. This study was registered with the University Hospital Medical Information Network Clinical Trials Registry and approved by the International Committee of Medical Journal Editors (UMIN000020423). The study protocol was developed in accordance with the Declaration of Helsinki and was approved by the ethics committee of each participating hospital. Informed consent was obtained from all enrolled patients before participating in the study. Navitor, an IA-SEV, became available in April 2022. Evolut FX (Medtronic), the latest generation of SA-SEV, was launched at the beginning of March 2023. According to the previous pivotal randomised trial, the definition of an SAA was a cutoff annulus size ≤430 mm2 assessed by preprocedural multidetector computed tomography (MDCT)3. From the time of launch of these THVs until March 2024, 1,034 patients underwent TAVI using an IA-SEV (n=518) or an SA-SEV (n=516). Patients who underwent TAVI for surgical bioprosthetic failure (n=71) and those who underwent haemodialysis (n=44) were excluded from the SA-SEV group because the indication of TAVI for such subsets was not approved for IA-SEV usage in Japan. The remaining 401 patients were treated using an SA-SEV. The initial study population comprised 512 and 398 patients in the IA-SEV and SA-SEV groups, respectively. Since a second valve implantation could have influenced postoperative echocardiographic data, these cases were excluded from the analysis. Specifically, 6 of 518 patients (1.2%) in the IA-SEV group and 3 of 410 patients (0.7%) in the SA-SEV group required a second valve, with no significant difference between the groups.
Device description
The valve sizes of the IA-SEVs were 23, 25, 27, and 29 mm, whereas those of the SA-SEVs were 23, 26, 29, and 34 mm. Device selection between an IA-SEV and an SA-SEV was determined by the local Heart Team. The size of a THV was typically determined using a conventional manufacturing sizing chart. The features of the IA-SEV (Navitor) include a cylindrical frame and an intracellular valve. The latest generation of SA-SEV (Evolut FX) changed the previous feature of two spines to a single spine. The minimum waist and maximum outflow diameters were as follows: 20 mm and 34 mm, respectively, for the 23 mm SA-SEV; 22 mm and 32 mm, respectively, for the 26 mm SA-SEV; and 23 mm and 34 mm, respectively, for the 29 mm SA-SEV. The 23 mm SA-SEV had the structure with the smallest waist and comparably largest outflow, which is unique among the SA-SEVs compared to other sizes.
Data definitions and study endpoints
The OCEAN-TAVI database includes baseline patient characteristics, laboratory data, transthoracic echocardiography (TTE) findings, and MDCT parameters. The severity of aortic stenosis was determined by the aortic valve area (AVA), indexed AVA, peak aortic valve velocity, or mPG. The postprocedural degree of paravalvular leakage (PVL) was classified as none-trace, mild, moderate, or severe. The postprocedural TTE was performed during the hospital index before discharge. Furthermore, procedural complications, such as stroke, bleeding, vascular complications, acute kidney injury, and newly required pacemaker implantation (PMI), were evaluated. All procedure-related variables and complications were defined using Valve Academic Research Consortium (VARC)-3 criteria7. According to the VARC-3 criteria, severe PPM was classified as an indexed EOA ≤0.65 cm2 in patients with a body mass index (BMI) <30 kg/m2, whereas severe PPM was defined as an indexed EOA ≤0.55 cm2 in patients with a BMI ≥30 kg/m2. The primary endpoint of this study was composed of the following TTE findings: postprocedural mPG, the degree of PVL, and the presence of severe PPM. The secondary endpoints were VARC-3 technical success and VARC-3 device success, and the other echocardiographic parameters such as EOA, indexed EOA, postprocedural peak velocity, and prevalence of mPG ≥20 mmHg after TAVI. For subgroup analysis, similar clinical findings were compared between the 23 mm sized IA-SEV and SA-SEV after propensity score (PS) matching. VARC-3 device success was tabulated at the time of discharge, but it was not evaluated 30 days after TAVI. Especially in patients with an SA-SEV, the predicted EOA was calculated in accordance with the previous formula8. Based on the predicted indexed EOA value, the predicted PPM was also evaluated in the overall cohort and the PS-matched cohort.
Statistical analysis
Continuous variables are expressed as mean±standard deviation or median with interquartile range. Categorical data were compared between the groups using chi-square tests. Differences in non-categorical data were tested using the unpaired Student’s t-test or the Mann-Whitney U test, depending on the variable distribution. Owing to the non-randomised nature of this study, a propensity score matching (PSM) analysis was adopted to minimise the numerous differences in baseline clinical characteristics and procedural variables. The PS was created using multivariate logistic regression analysis. The following significant variables were entered into the model as clinically important factors: significantly different clinical variables in the baseline characteristics, BMI, Clinical Frailty Scale, New York Heart Association Class III/IV, hypertension, diabetes, previous history of percutaneous coronary intervention, previous myocardial infarction, atrial fibrillation, coronary artery disease, prior pacing device implantation, mPG, left ventricular ejection fraction (LVEF), transfemoral approach, MDCT-derived annulus perimeter, and valve oversizing ratio relative to baseline perimeter. One-to-one PSM was performed using the nearest-neighbour match on the PS with a calliper width of 0.01. The discrimination and calibration abilities of the PSM were assessed using the receiver operating characteristic curve (0.60, 95% confidence interval [CI]: 0.56-0.64; p<0.001). Mixed models of logistic regression analysis were used to examine whether the clinical variables of SA-SEVs compared with those of IA-SEVs differed across centres.
Results
Baseline characteristics
The baseline patient characteristics are presented in Table 1. The average age, body size, and the number of males were similar between the two groups. The baseline annulus area and perimeter were also similar between the two groups, whereas the baseline peak velocity and mPG were significantly different in the two groups. However, there were no statistically significant differences in the baseline patient characteristics, including the TTE parameters, in the PSM cohort that had 219 patients per group. One-third of the patients received a 23 mm IA-SEV, whereas 20.2% received a 23 mm SA-SEV. The 25 mm IA-SEV (55.2%) and 26 mm SA-SEV (69.3%) were the main SEVs deployed in this cohort. Only 0.4% of the patients were implanted with a 29 mm IA-SEV, whereas 10.5% were implanted with a 29 mm SA-SEV.
Table 1. Patient characteristics and procedural variables.
| Overall cohort | SMD | Propensity score-matched cohort | SMD | |||||
|---|---|---|---|---|---|---|---|---|
| Characteristics | IA-SEV n=518 | SA-SEV n=401 | p-value | IA-SEV n=219 | SA-SEV n=219 | p-value | ||
| Age, years | 86.0±5.2 | 85.7±5.1 | 0.388 | 0.058 | 86.2±5.4 | 85.7±5.3 | 0.398 | 0.081 |
| Male | 65 (12.5) | 51 (12.7) | >0.99 | 0.005 | 27 (12.3) | 21 (9.6) | 0.445 | 0.088 |
| BSA, m2 | 1.39±0.14 | 1.40±0.15 | 0.138 | 0.098 | 1.39±0.15 | 1.40±0.15 | 0.395 | 0.081 |
| BMI, kg/m2 | 21.9±3.6 | 21.9±3.5 | 0.943 | 0.005 | 22.0±3.7 | 22.0±3.6 | 0.860 | 0.017 |
| BMI >30 kg/m2 | 11 (2.1) | 5 (1.2) | 0.447 | 0.068 | 6 (2.7) | 3 (1.4) | 0.503 | 0.097 |
| STS-PROM, % | 7.5±6.0 | 7.8±5.6 | 0.435 | 0.053 | 7.3±4.7 | 7.9±6.1 | 0.227 | 0.117 |
| Clinical Frailty Scale | 3.8±1.2 | 3.9±1.2 | 0.204 | 0.085 | 3.9±1.3 | 3.9±1.2 | 0.430 | 0.076 |
| NYHA Class III/IV | 140 (27.1) | 117 (29.3) | 0.487 | 0.053 | 52 (23.7) | 61 (27.9) | 0.382 | 0.094 |
| Diabetes | 156 (30.1) | 94 (23.4) | 0.025 | 0.151 | 57 (26.0) | 57 (26.0) | >0.99 | 0.043 |
| Hypertension | 417 (80.5) | 298 (74.3) | 0.031 | 0.148 | 168 (76.7) | 166 (75.8) | 0.445 | 0.088 |
| COPD or lung disease | 52 (10.1) | 45 (11.6) | 0.450 | 0.051 | 20 (9.1) | 25 (11.7) | 0.433 | 0.084 |
| Previous stroke | 57 (11.0) | 41 (10.2) | 0.747 | 0.025 | 25 (11.5) | 23 (10.6) | 0.879 | 0.029 |
| Previous CABG | 14 (2.7) | 6 (1.5) | 0.259 | 0.084 | 2 (0.9) | 3 (1.4) | >0.99 | 0.043 |
| Previous PCI | 99 (19.1) | 52 (13.0) | 0.015 | 0.166 | 33 (15.1) | 30 (13.8) | 0.785 | 0.016 |
| Previous myocardial infarction | 20 (3.9) | 17 (4.2) | 0.866 | 0.019 | 8 (3.7) | 8 (3.7) | >0.99 | <0.001 |
| Atrial fibrillation or flutter | 91 (17.6) | 84 (21.0) | 0.204 | 0.087 | 43 (19.6) | 46 (21.0) | >0.99 | <0.001 |
| History of RBBB | 41 (7.9) | 47 (11.7) | 0.055 | 0.128 | 15 (6.8) | 28 (12.8) | 0.053 | 0.200 |
| Coronary artery disease | 168 (32.4) | 98 (24.4) | 0.008 | 0.178 | 48 (26.9) | 59 (26.9) | 0.266 | 0.117 |
| Any pacemaker device | 37 (7.1) | 15 (3.8) | 0.031 | 0.149 | 9 (4.1) | 9 (4.1) | >0.99 | <0.001 |
| Bicuspid valve | 5 (1.0) | 5 (1.2) | 0.755 | 0.027 | 1 (0.5) | 3 (1.4) | 0.623 | <0.001 |
| TTE data before TAVI | ||||||||
| LVEF, % | 63.4±15.6 | 64.6±10.1 | 0.186 | 0.090 | 64.0±16.4 | 64.3±9.8 | 0.846 | 0.019 |
| Stroke volume, ml | 64.2±18.5 | 65.2±18.3 | 0.478 | 0.050 | 64.9±18.4 | 64.0±16.8 | 0.631 | 0.048 |
| Stroke volume index | 46.3±12.8 | 46.5±13.3 | 0.853 | 0.013 | 46.8±12.7 | 45.7±12.5 | 0.417 | 0.082 |
| AVA with Doppler, cm2 | 0.64±0.19 | 0.62±0.18 | 0.226 | 0.081 | 0.62±0.18 | 0.64±0.17 | 0.325 | 0.094 |
| Indexed AVA, cm2/m22 | 0.46±0.13 | 0.45±0.13 | 0.078 | 0.118 | 0.45±0.12 | 0.46±0.12 | 0.416 | 0.071 |
| Peak velocity, m/sec | 4.4±0.70 | 4.6±0.74 | <0.001 | 0.244 | 4.6±0.75 | 4.4±0.68 | 0.077 | 0.170 |
| Mean PG, mmHg | 46.0±16.1 | 50.5±17.8 | <0.001 | 0.268 | 49.4±17.5 | 46.8±16.5 | 0.106 | 0.155 |
| CT data before TAVI | ||||||||
| Annulus area, mm2 | 358.7±41.7 | 359.7±42.5 | 0.730 | 0.023 | 360.2±46.0 | 360.3±41.5 | 0.993 | 0.001 |
| Annular perimeter, mm | 68.8±4.0 | 68.7±4.2 | 0.764 | 0.020 | 68.8±4.4 | 68.9±3.8 | 0.970 | 0.004 |
| Perimeter <19 mm | 9 (1.7) | 10 (2.5) | 0.487 | 0.053 | 8 (3.7) | 1 (0.5) | 0.037 | 0.227 |
| Perimeter ≥23 mm | 118 (22.8) | 84 (20.9) | 0.521 | 0.044 | 54 (24.7) | 40 (18.3) | 0.130 | 0.156 |
| Procedural information | ||||||||
| Transfemoral approach | 506 (97.7) | 384 (95.8) | 0.127 | 0.108 | 214 (97.7) | 214 (97.7) | >0.99 | <0.001 |
| Valve size | ||||||||
| 23 mm | 174 (33.6) | 81 (20.2) | 45 (20.5) | 68 (31.1) | ||||
| 25 mm | 286 (55.2) | - | 125 (57.1) | - | ||||
| 26 mm | - | 278 (69.3) | - | 145 (66.2) | ||||
| 27 mm | 56 (10.8) | - | 47 (21.5) | - | ||||
| 29 mm | 2 (0.4) | 42 (10.5) | 2 (0.9) | 6 (2.7) | ||||
| Valve oversizing ratio | 1.12±0.04 | 1.18±0.06 | <0.001 | 1.064 | 1.14±0.04 | 1.15±0.04 | 0.430 | 0.076 |
| Categorical variables are shown as numbers (percentages), and continuous variables are shown as mean±SD. AVA: aortic valve area; BMI: body mass index; BSA: body surface area; CABG: coronary artery bypass graft; COPD: chronic obstructive pulmonary disease; CT: computed tomography; IA-SEV: intra-annular self-expanding valve; LVEF: left ventricle ejection fraction; NYHA: New York Heart Association; PCI: percutaneous coronary intervention; PG: pressure gradient; RBBB: right bundle branch block; SA-SEV: supra-annular self-expanding valve; SD: standard deviation; SMD: standardised mean difference; STS-PROM: Society of Thoracic Surgeons Predicted Risk of Mortality; TAVI: transcatheter aortic valve implantation; TTE: transthoracic echocardiography | ||||||||
Procedural complications, outcomes, and echocardiographic parameters
Procedural variables and outcomes are presented in Table 2. The incidence of procedural complications was similar between the two groups, and these trends were not attenuated in the PSM model. In-hospital deaths in the two groups were similar in the PSM cohort (1.8% vs 0.5%; p=0.372). The main findings of this study are summarised in the Central illustration. The average EOA, indexed EOA (iEOA), peak velocity, mPG, and prevalence of mPG ≥20 mmHg were not different between the IA-SEV and SA-SEV groups in both the overall and PSM cohorts (allp>0.05). The average mPG showed a statistically significant difference after PSM analysis (8.74±5.01 mmHg vs 7.84±4.43 mmHg; p=0.049). A trend towards a higher incidence of severe PPM was observed in the IA-SEV group compared to the SA-SEV group in the overall cohort (2.9% vs 1.0%; p=0.060). After PSM, the incidence of severe PPM was similar between the two groups (1.9% vs 0.9%; p=0.405). The predicted EOA and iEOA were higher than the measured EOA and iEOA. As a result, the predicted incidence of severe PPM was 0% in the overall and PSM cohorts. The distributions of PVL grade and rates of PVL ≥mild significantly differed in the overall cohort. The incidence of PVL ≥mild tended to be lower with IA-SEVs than with SA-SEVs in the PSM cohort (34.1% vs 42.2%; p=0.084). The incidence of new PMI was similar between the two groups in the PSM cohort (15.2% vs 9.5%; p=0.075). The rates of VARC-3-defined technical and device success were almost equal between the IA-SEV and SA-SEV groups. The centre bias in terms of clinical variables between the two groups was analysed in Supplementary Table 1. Comparing SA-SEVs with IA-SEVs, there was no centre bias in terms of technical success, device success, mPG ≥20 mmHg, PVL ≥mild, newly required PMI, and severe PPM (all Pr [>|z|]>0.05).
Table 2. Periprocedural complications and TTE findings.
| Overall cohort | Propensity score-matched cohort | |||||
|---|---|---|---|---|---|---|
| Parameters | IA-SEV n=518 | SA-SEV n=401 | p-value | IA-SEV n=219 | SA-SEV n=219 | p-value |
| Periprocedural complications | ||||||
| Major vascular complication | 11 (2.1) | 15 (3.7) | 0.163 | 5 (2.9) | 7 (3.2) | 0.771 |
| Major or life-threatening bleeding | 25 (4.8) | 17 (4.2) | 0.751 | 16 (7.3) | 7 (3.2) | 0.085 |
| Ischaemic stroke | 13 (2.5) | 11 (2.8) | 0.836 | 7 (3.2) | 8 (3.7) | 0.799 |
| Coronary occlusion | 2 (0.4) | 2 (0.5) | >0.99 | 0 (0) | 1 (0.5) | >0.99 |
| Conversion to open surgery | 0 (0) | 1 (0.5) | 0.225 | (0.0) | 1 (0.5) | >0.99 |
| New PMI | 65/481 (13.5) | 38/386 (9.8) | 0.097 | 32/210 (15.2) | 20/210 (9.5) | 0.075 |
| Acute kidney injury | 17 (3.3) | 12 (3.0) | 0.851 | 4 (1.8) | 6 (2.7) | 0.751 |
| Second valve implantation | 6 (1.2) | 3 (0.7) | 0.531 | 2 (0.9) | 0 (0) | 0.156 |
| In-hospital death | 7 (1.4) | 2 (0.5) | 0.313 | 4 (1.8) | 1 (0.5) | 0.372 |
| Technical success | 497 (95.9) | 384 (95.8) | >0.99 | 208 (95.0) | 212 (96.9) | 0.471 |
| Device success | 473 (91.3) | 352 (87.8) | 0.099 | 196 (89.5) | 197 (90.0) | >0.99 |
| TTE after TAVI* | IA-SEV n=512 | SA-SEV n=398 | IA-SEV n=217 | SA-SEV n=219 | ||
| EOA, cm2 | 1.78±0.45 | 1.81±0.50 | 0.257 | 1.77±0.44 | 1.79±0.47 | 0.574 |
| Indexed EOA, cm2/m2 | 1.29±0.34 | 1.30±0.35 | 0.727 | 1.28±0.32 | 1.29±0.34 | 0.876 |
| Peak velocity, m/sec | 1.95±0.43 | 1.96±0.59 | 0.818 | 2.00±0.48 | 1.91±0.68 | 0.127 |
| mPG, mmHg | 8.32±4.27 | 8.28±4.44 | 0.895 | 8.74±5.01 | 7.84±4.43 | 0.049 |
| mPG ≥20 mmHg | 6/511 (1.2) | 9/396 (2.3) | 0.294 | 5/216 (2.3) | 4/218 (1.8) | 0.726 |
| PVL ≥mild | 185/509 (36.3) | 175/396 (44.2) | 0.020 | 73/214 (34.1) | 92/218 (42.2) | 0.084 |
| PVL grade | ||||||
| None or trace | 324/509 (63.7) | 221/396 (55.8) | 141/214 (65.9) | 126/218 (57.8) | ||
| Mild | 171/509 (33.6) | 157/396 (39.6) | 0.038 | 68/214 (31.8) | 84/218 (38.5) | 0.204 |
| ≥Moderate | 14/509 (2.8) | 18/396 (4.5) | 5/214 (2.3) | 8/218 (3.7) | ||
| PPM incidence | ||||||
| Moderate | 27/511 (5.3) | 23/396 (5.8) | 0.770 | 11/216 (5.1) | 14/218 (6.4) | 0.601 |
| Severe | 15/511 (2.9) | 4/396 (1.0) | 0.060 | 4/216 (1.9) | 2/218 (0.9) | 0.405 |
| Predicted EOA | 1.75±0.12 | 1.75±0.12 | ||||
| Predicted indexed EOA | 1.26±0.14 | 1.27±0.15 | ||||
| Predicted severe PPM | 0/396 (0) | 0/218 (0) | ||||
| Categorical variables are shown as n (%) or n/N (%), and continuous variables are shown as mean±SD. *Data excluding the second valve cases in the 2 groups. EOA: effective orifice area; IA-SEV: intra-annular self-expanding valve; mPG: mean pressure gradient; PMI: pacemaker implantation; PPM: prosthesis-patient mismatch; PVL: paravalvular leakage; SA-SEV: supra-annular self-expanding valve; SD: standard deviation; TAVI: transcatheter aortic valve implantation; TTE: transthoracic echocardiography | ||||||
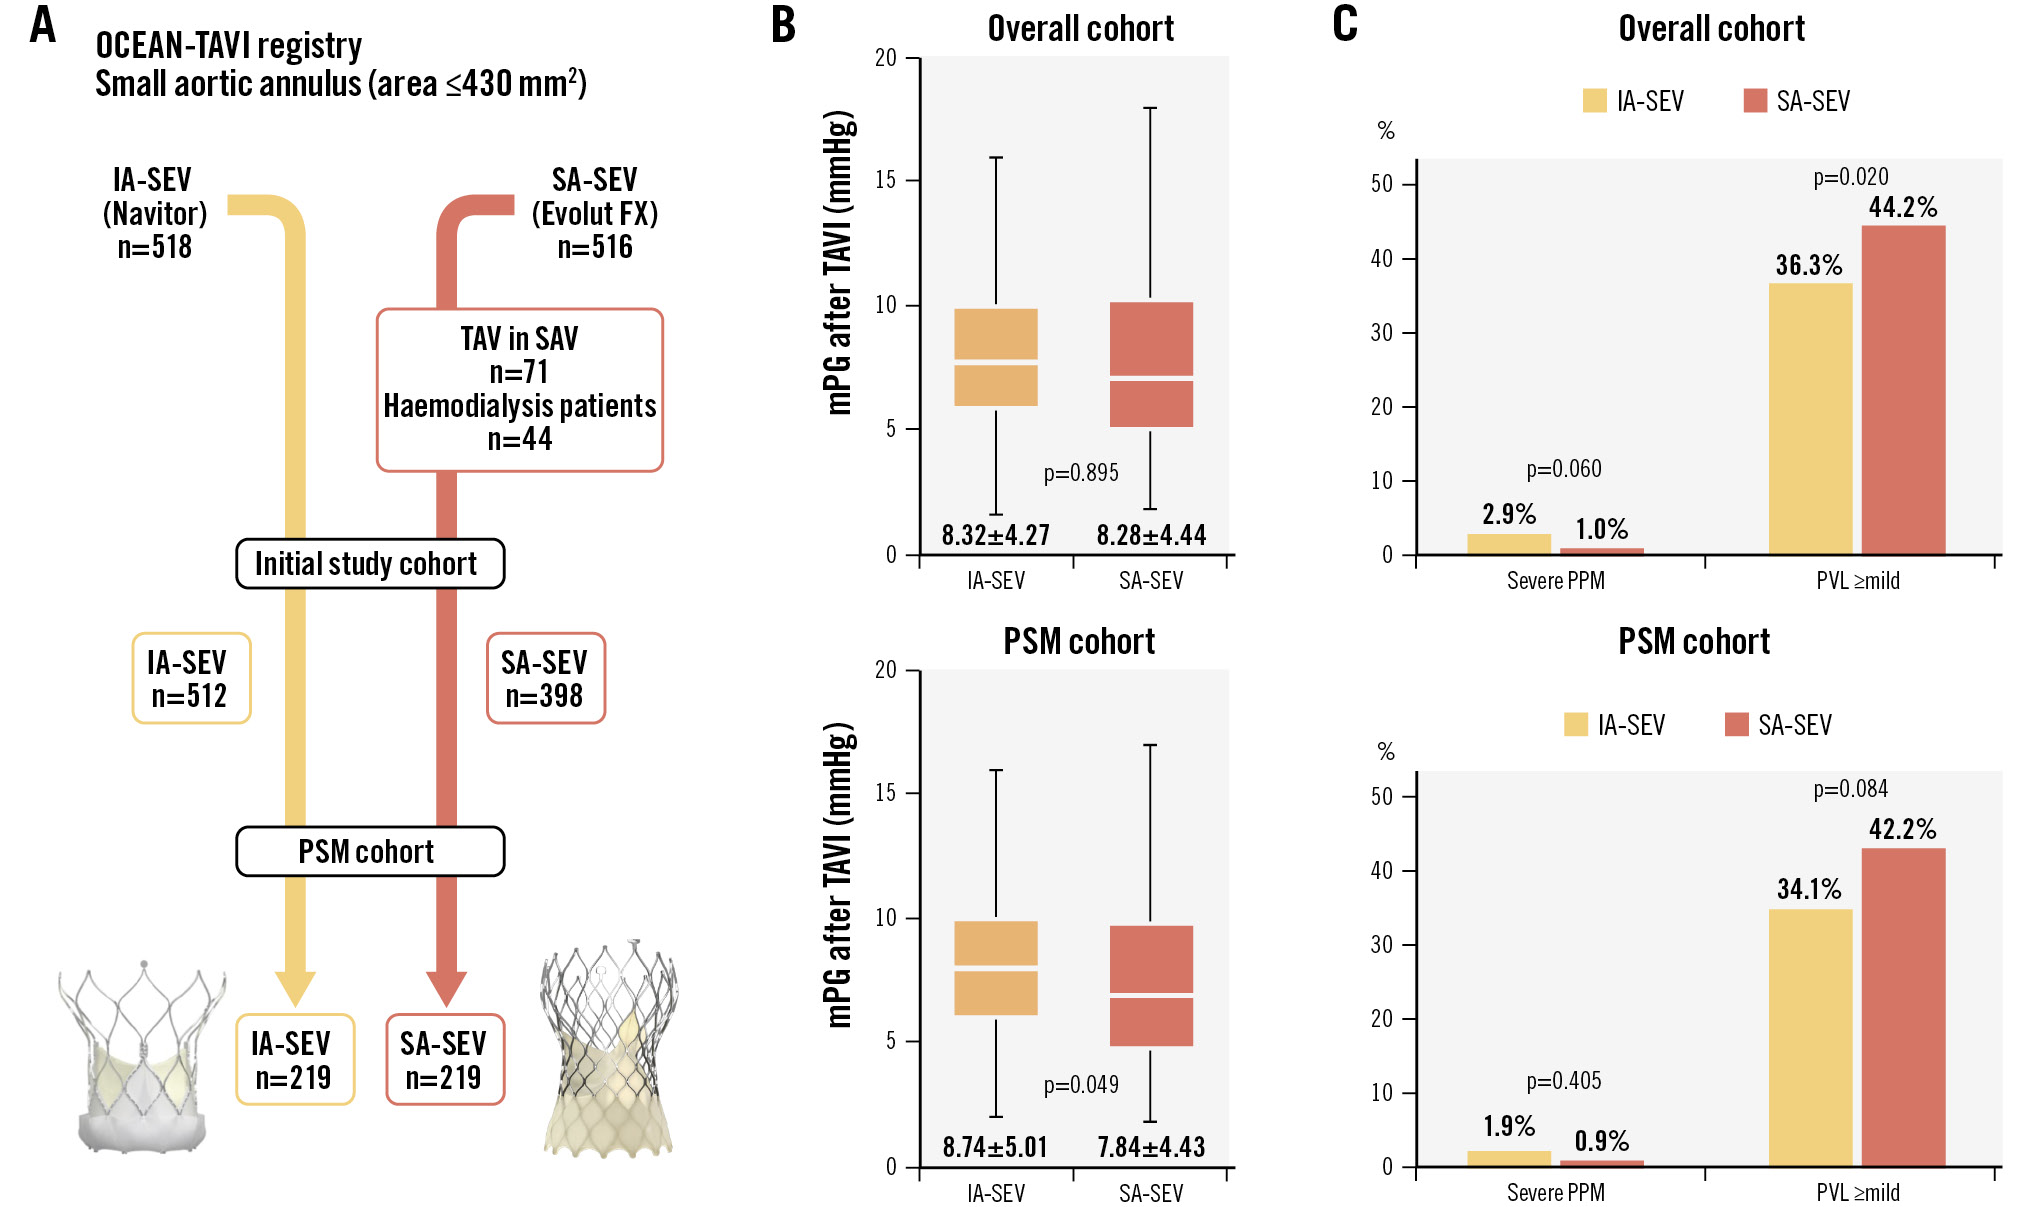
Central illustration. IA-SEV and SA-SEV performance in the overall and PSM cohorts. A) Patient populations in the IA-SEV and SA-SEV groups in this study. B) Box-and-whisker plots of the average mPG between the IA-SEV and SA-SEV groups (overall cohort and PSM cohort). C) The incidence of severe PPM and PVL ≥mild between IA-SEV and SA-SEV (overall cohort and PSM cohort). IA-SEV: intra-annular self-expanding valve; mPG: mean pressure gradient; PPM: prosthesis-patient mismatch; PSM: propensity score matching; PVL: paravalvular leakage; SA-SEV: supra-annular self-expanding valve; SAV: surgical aortic valve; TAV: transcatheter aortic valve; TAVI: transcatheter aortic valve implantation
Valve size differences in echocardiographic and clinical outcomes
The postprocedural assessment by valve size between the IA-SEV and SA-SEV groups is shown in Table 3. Smaller-sized SEVs (23 mm) were associated with smaller EOAs, higher mPGs, and higher rates of severe PPM among patients with SAAs. All of these parameters showed a similar trend with increasing THV size. Focusing only on the 23 mm size THVs, similar echocardiographic parameters were compared between the IA-SEV and SA-SEV groups using PSM analysis (Table 4). Except for slight differences in the EOA and indexed EOA, no significant differences were observed for the measured parameters between the IA-SEV and SA-SEV groups when using the 23 mm valve.
Table 3. Postprocedural echocardiographic assessments by valve size between the IA-SEV and SA-SEV.
| Overall cohort | ||||||
|---|---|---|---|---|---|---|
| IA-SEV n=512 | SA-SEV n=398 | |||||
| Patient numbers for each group* | n=174 | n=281 | n=57 | n=81 | n=277 | n=40 |
| Valve size, mm | 23 | 25 | 27 & 29 | 23 | 26 | 29 |
| EOA, cm2 | 1.67±0.42 | 1.81±0.46 | 1.94±0.40 | 1.49±0.33 | 1.88±0.48 | 2.00±0.58 |
| Indexed EOA, cm2/m2 | 1.26±0.34 | 1.31±0.35 | 1.30±0.27 | 1.13±0.26 | 1.33±0.35 | 1.35±0.38 |
| Peak velocity, m/sec | 2.02±0.46 | 1.90±0.38 | 1.98±0.38 | 2.30±0.40 | 1.89±0.63 | 1.72±0.40 |
| mPG, mmHg | 8.9±5.2 | 7.9±3.7 | 8.5±3.2 | 12.1±4.9 | 7.4±3.8 | 6.7±3.0 |
| mPG ≥20 mmHg | 3/174 (1.7) | 3/280 (1.1) | 0/57 (0) | 6/80 (7.5) | 3/276 (1.1) | 0/42 (0) |
| PVL grade | ||||||
| None or trace | 107/173 (61.8) | 182/279 (65.2) | 35/57 (61.4) | 46/80 (57.5) | 156/276 (56.5) | 19/40 (47.5) |
| Mild | 63/173 (36.4) | 89/279 (31.9) | 19/57 (33.3) | 29/80 (36.3) | 109/276 (39.5) | 19/40 (47.5) |
| ≥Moderate | 3/173 (1.7) | 8/279 (2.9) | 3/57 (5.3) | 5/80 (6.3) | 11/276 (4.0) | 2/40 (5.0) |
| PPM incidence | ||||||
| None | 155/174 (89.1) | 260/280 (92.9) | 54/57 (94.7) | 68/80 (85.0) | 264/276 (95.7) | 37/40 (92.5) |
| Moderate | 13/174 (7.5) | 12/280 (4.3) | 2/57 (3.5) | 11/80 (13.8) | 9/276 (3.3) | 3/40 (7.5) |
| Severe | 6/174 (3.4) | 8/280 (2.9) | 1/57 (1.8) | 1/80 (1.3) | 3/276 (1.1) | 0/40 (0) |
| Categorical variables are shown as n (%) or n/N (%), and continuous variables are shown as mean±SD. *Data excluding the second valve cases in the 2 groups. EOA: effective orifice area; IA-SEV: intra-annular self-expanding valve; mPG: mean pressure gradient; PPM: prosthesis-patient mismatch; PVL: paravalvular leakage; SA-SEV: supra-annular self-expanding valve; SD: standard deviation | ||||||
Table 4. Postprocedural echocardiographic assessments for 23 mm size valves between the IA-SEV and SA-SEV after PSM analysis.
| Propensity score-matched cohort | |||
|---|---|---|---|
| Parameters on TTE after TAVI | IA-SEV n=64 | SA-SEV n=64 | p-value |
| EOA, cm2 | 1.61±0.45 | 1.49±0.31 | 0.087 |
| Indexed EOA, cm2/m2 | 1.23±0.37 | 1.13±0.25 | 0.060 |
| Peak velocity, m/sec | 2.13±0.59 | 2.28±0.40 | 0.102 |
| mPG, mmHg | 10.2±7.4 | 11.7±4.7 | 0.178 |
| mPG ≥20 mmHg | 3 (4.7) | 4/63 (6.3) | 0.718 |
| PVL ≥mild | 22/63 (34.9) | 25/63 (39.7) | 0.713 |
| PVL grade | |||
| None or trace | 41/63 (65.1) | 38/63 (60.3) | |
| Mild | 21/63 (33.3) | 22/63 (34.9) | 0.641 |
| ≥Moderate | 1/63 (1.6) | 3/63 (4.8) | |
| PPM incidence | |||
| Moderate | 8 (12.5) | 9 (14.3) | 0.800 |
| Severe | 3 (4.7) | 0 (0) | 0.244 |
| Categorical variables are shown as n (%) or n/N (%), and continuous variables are shown as mean±SD. EOA: effective orifice area; IA-SEV: intra-annular self-expanding valve; mPG: mean pressure gradient; PPM: prosthesis-patient mismatch; PSM: propensity score matching; PVL: paravalvular leakage; SA-SEV: supra-annular self-expanding valve; SD: standard deviation; TAVI: transcatheter aortic valve implantation; TTE: transthoracic echocardiography | |||
Discussion
The current study compared clinical outcomes, including echocardiographic parameters, in terms of SEV design differences in patients with SAAs who underwent TAVI. The main findings of this study were as follows: (1) the primary and secondary endpoints evaluated by postprocedural TTE were largely similar between IA-SEVs and SA-SEVs. Although the mPG value showed a difference, the variation was marginal and unlikely to raise major clinical concerns. 2) Technical success and device success rates were not significantly different between the two groups. 3) TTE measurements differed depending on the size of the THV. However, when focusing on the 23 mm size, there was no significant difference between IA-SEVs and SA-SEVs in either the primary or secondary endpoints.
Echocardiographic parameters after IA-SEV and SA-SEV implantation
Patients with aortic stenosis (AS) with an SAA were associated with an increased risk of mortality after surgical aortic valve replacement (SAVR)910. A larger postprocedural EOA and lower mPG derived by echocardiography are generally observed over 5 years after TAVI with SA-SEVs and BEVs compared to SAVR1112. A recent randomised trial concluded that an SA-SEV was superior to a BEV with respect to echocardiographic parameters and bioprosthetic valve dysfunction over 12 months, although the clinical outcomes were similar between the two groups3. Whether the acquisition of better results with SEVs is specific to the SA design or whether similar benefits can be applied to other IA designs of SEVs is uncertain. The results of this study revealed that several echocardiographic parameters, such as EOA, indexed EOA, peak aortic velocity, and the prevalence of an mPG ≥20 mmHg, were similar between IA-SEVs and SA-SEVs. Although they demonstrated statistically significant differences, the higher absolute value of the mPG, 0.9 mmHg, may be considered marginal. In addition, parameters such as peak velocity and mPG are dependent on cardiac flow. The difference in mPG after any THV implantation should be traced to how cardiac flow changed before and after TAVI. However, this study did not evaluate parameters such as postoperative LVEF or stroke volume. In this context, it should be stated that the differences in mPG might not be adequately discussed in the results of this study.
Early procedural results after IA-SEV and SA-SEV implantation
Other important postprocedural parameters were the degree of PVL and the rates of PMI after TAVI. The degree of PVL showed differences between the two groups, and the incidence of PVL ≥mild was lower in the IA-SEV group than in the SA-SEV group. Due to the use of registry data, SEVs tend to be selected for patients with heavily calcified AS in real-world clinical practice. Although adjusted for PS matching, the IA-SEV was an earlier-generation device, and the SA-SEV may have been chosen more frequently for patients with greater calcification than those selected for the IA-SEV. Therefore, further validation is required to determine whether the lower incidence of mild PVL in the IA-SEV group compared to the SA-SEV group is genuinely significant. After PSM analysis, the incidence of PMI was comparable between the IA-SEV group and the SA-SEV group. Although the rates of PMI in our study are comparable to those of previous reports using IA-SEVs, the relatively higher rate of new PMI is due to the early learning curve of our daily practice using IA-SEVs41314. Given the differences in postprocedural variables and complications, in-hospital mortality, as well as the VARC-3-defined technical success and device success, did not differ between the IA-SEV and SA-SEV groups. Therefore, early procedural safety and high success rates are guaranteed with both SEV series.
Incidences of severe PPM after IA-SEV and SA-SEV implantation
Applied to the individual definition of SAA cutoff, many studies indicate a higher incidence of severe PPM after TAVI in patients with SAAs than in those without SAAs1516. The rates of TTE-derived severe PPM were similarly observed in 2.9% (1.9% in the PSM cohort) of the IA-SEV group and 1.0% (0.9% in the PSM cohort) of the SA-SEV group. It is known that the percentage of measured severe PPM is significantly lower in Asian cohorts compared to Western cohorts, likely due to body size differences345. In this study, the predicted EOA was larger than the measured EOA, resulting in a predicted severe PPM of 0%. Although it is difficult to interpret the meaning of 0% predicted PPM, even in the Western multicentre data of 38,808 patients, the predicted severe PPM was very low at 0.6%17. This difference between the measured versus the predicted PPM incidence may be explained by the lack of a core laboratory employing a uniform method for evaluating TTE findings, which may have introduced errors in the measurement, such as those involving the left ventricular outflow tract8. The incidence of PPM varies depending on the method of assessment, and caution should be exercised when interpreting the results and their clinical significance.
Valve size differences between the IA-SEV and SA-SEV
As expected, smaller-sized SEVs had a smaller EOA, higher mPG, and higher incidence of severe PPM among patients with SAA in this study compared to larger SEVs. Although it was originally expected that the supra-annular position of the THV would have better echocardiographic data, among the SA-SEVs, the 23 mm SA-SEV showed a significant difference in echocardiographic data compared to the 26 mm and 29 mm SA-SEVs. This discrepancy may be due to the very small waist (20 mm) in the design of the 23 mm SA-SEV, which results in a squeezed-out morphology. It is important to emphasise that this study’s sample size for these comparisons was small. Furthermore, we found no difference between the IA-SEV and 23 mm SA-SEV. Beyond the differences in echocardiographic parameters, our previous study revealed no incremental risk of long-term mortality between patients treated with small-sized SA-SEVs (23 mm) and those treated with large-sized SA-SEVs (26-29 mm), and the rate of severe PPM was more prevalent in the small-sized SA-SEV group18. In addition to estimating the parameters of postprocedural echocardiographic findings after TAVI in patients with an SAA using a smaller THV, the THV choice for the SEV series and the BEV may be determined based on multiple factors to ensure the best approach for an individual patient’s care.
Limitations
This study used observational, unblinded, and non-randomised registry data. Thus, many differences in baseline clinical characteristics and echocardiographic parameters were observed between the IA-SEV and SA-SEV groups. The SA-SEV is the only treatment option for patients with extremely small or large annulus diameters, which means these cases are inevitably excluded during PSM. Additionally, patients with a significantly high preoperative pressure gradient are more likely to undergo TAVI with an SA-SEV, preventing their inclusion in the PS-matched cohort. Consequently, the number of cases obtained through PSM was relatively low, making it difficult to draw definitive conclusions from the results. Even after adjusting for many differences in the PSM analysis, important clinical variables that were not fully captured in the current model may be present. For example, the ellipticity index of the aortic annulus, rates of predilatation or post-dilatation, and the calcium score of the aortic valve may have affected the postoperative echocardiographic data. These valuable factors were missing in this study. In particular, the calcium score – a crucial parameter obtained from computed tomography (CT) information was not analysed. Furthermore, preoperative CT imaging methods, including slice thickness, were not standardised in this study. In addition, the registry had no core laboratory using the same software. The single Japanese population data in this registry made it difficult to prove its applicability to other populations. The body size of our patients who underwent TAVI was smaller than that of the Western cohort19. Therefore, the generalisability of our results should be validated in a Western cohort. Although the OCEAN-TAVI registry shares a consensus document with each centre regarding echocardiographic assessment based on the guidelines and VARC-3 criteria, there is no independent core laboratory. This study focused only on early outcomes after TAVI, as both SEV series were recently introduced into clinical practice. Further mid- to long-term follow-up data, including valve durability data, are required to validate the clinical impact of the THV design differences.
Conclusions
This study investigated the early clinical outcomes, including echocardiographic parameters, between IA-SEVs and SA-SEVs in patients with SAA post-TAVI. Although the mPG value and prevalence of PVL ≥mild showed statistical differences, these variations were marginal and unlikely to have major clinical concerns. Further clinical investigations are required to validate our results and elucidate the clinical impact of THV design differences in patients with or without SAAs after TAVI.
Impact on daily practice
Better echocardiographic parameters were observed in patients with a small aortic annulus (SAA) who underwent transcatheter aortic valve implantation (TAVI) using a balloon-expandable valve compared to those treated with a supra-annular self-expanding valve (SA-SEV). Although slightly different echocardiographic data were found after TAVI using SA-SEVs compared to intra-annular (IA)-SEVs, similar clinical results were confirmed in patients with SAA treated with either an IA-SEV or an SA-SEV.
Acknowledgements
The authors thank all OCEAN-TAVI investigators participating in this study.
Funding
The OCEAN-TAVI registry is supported by Edwards Lifesciences, Medtronic, Abbott Vascular, Boston Scientific, and Daiichi Sankyo. The sponsors were not involved in the study conduct, data collection, statistical analysis, or manuscript writing.
Conflict of interest statement
K. Nishioka is a clinical proctor for Edwards Lifesciences. M. Izumo is a screening proctor for Edwards Lifesciences. F. Yashima, M. Asami, and H. Nishina are clinical proctors for Medtronic. T. Naganuma, K. Mizutani, and K. Takagi are clinical proctors for Edwards Lifesciences and Medtronic. Y. Ohno is a clinical proctor for Medtronic and Abbott. M. Yamamoto, S. Shirai, Y. Watanabe, H. Ueno, K. Yamasaki, D. Hachinohe, Y. Fuku, and K. Hayashida served as clinical proctors for Edwards Lifesciences, Abbott, and Medtronic. The other authors have no conflicts of interest relevant to the content of this manuscript to declare.
Supplementary data
To read the full content of this article, please download the PDF.
