Abstract
BACKGROUND: Data on the performance of the latest-generation SAPIEN 3 Ultra RESILIA (S3UR) valve in patients who undergo transcatheter aortic valve replacement (TAVR) are scarce.
AIMS: We aimed to assess the clinical outcomes, including valve performance, of the S3UR.
METHODS: Registry data of 618 consecutive patients with S3UR and of a historical pooled cohort of 8,750 patients who had a SAPIEN 3 (S3) valve and underwent TAVR were collected. The clinical outcomes and haemodynamics, including patient-prosthesis mismatch (PPM), were compared between the 2 groups and in a propensity-matched cohort.
RESULTS: The incidence of in-hospital death, vascular complications, and new pacemaker implantation was similar between the S3UR and the S3 groups (allp>0.05). However, both groups showed significant differences in the degrees of paravalvular leakage (PVL) (none-trivial: 87.0% vs 78.5%, mild: 12.5% vs 20.5%, ≥moderate: 0.5% vs 1.1%; p<0.001) and the incidence of PPM (none: 94.3% vs 85.1%, moderate: 5.2% vs 12.8%, severe: 0.5% vs 2.0%; p<0.001). The prevalence of a mean pressure gradient ≥20 mmHg was significantly lower in the S3UR group (1.6% vs 6.2%; p<0.001). Better haemodynamics were observed with the smaller 20 mm and 23 mm S3UR valves. The results were consistent in a matched cohort of patients with S3UR and with S3 (n=618 patients/group).
CONCLUSIONS: The S3UR has equivalent procedural complications to the S3 but with lower rates of PVL and significantly better valve performance. The better valve performance of the S3UR, particularly in smaller valve sizes, overcomes the remaining issue of balloon-expandable valves after TAVR.
Transcatheter aortic valve replacement (TAVR) has become an established treatment option for patients with severe aortic stenosis (AS), regardless of surgical risk12. Less invasive, simplified TAVR procedures with fewer complications have been accomplished in conjunction with improvements in operator learning curves and devices in recent decades34. The Edwards SAPIEN series (Edwards Lifesciences) is the most commonly used balloon-expandable transcatheter heart valve (THV), and the fourth-generation SAPIEN 3 Ultra (S3Ultra), which has demonstrated significant reductions in paravalvular leakage (PVL), is commercially available in Western countries567. The latest-generation SAPIEN 3 Ultra RESILIA (S3UR) was recently launched. The S3UR includes new features such as dry tissue storage in combination with the anticalcification technology of RESILIA tissue, which blocks calcium from binding to the tissue. The external textured polyethylene terephthalate (PET) skirt extends 40% higher above the valve inflow than the classic SAPIEN 3 (S3) and 29 mm S3Ultra skirts. The unique modification of the S3UR also changed the sewing manoeuvres for each of the 3 leaflets at the commissural positions, especially for the smaller 20 mm and 23 mm valve sizes. Although many considerable clinical advantages of the S3UR have arisen, clinical data regarding patients who underwent TAVR using the S3UR are still scarce. Therefore, this study aimed to clarify the performance of the latest-Âgeneration S3UR THV with respect to early clinical outcomes and valve performance, using large-scale Japanese multicentre TAVR registry data.
Methods
STUDY DESIGN AND POPULATION
This study was performed using data from the ongoing prospective Japanese multicentre Optimized CathEter vAlvular iNtervention-Transcatheter Aortic Valve Implantation (OCEAN-TAVI) study38. The diagnosis of AS, indications for TAVR, and THV selection were determined by individual local cardiology team members. The previous-generation S3Ultra was not commercially available in Japan, but the latest-generation S3UR was launched at the end of March 2023. In total, 633 consecutive patients had undergone TAVR using the S3UR by the end of June 2023. As a control group for S3UR, a historical pooled cohort of 9,602 patients from our database who had undergone TAVR with the classic S3 valve, between May 2016 and March 2023, was evaluated. In both groups, patients who had received a transcatheter aortic valve (TAV) in a surgical aortic valve (TAV-in-SAV) procedure were excluded from the initial analysis (n=15 and n=90). In the S3 group, patients who had undergone TAVR with transapical and direct aortic approaches (n=305) were also excluded as well as those with inadequate datasets (n=457). The patient selection flowchart is shown in Figure 1. The study proÂtocol of the OCEAN-TAVI registry was approved by the local institutional review boards of the participating centres and registered with the University Hospital Medical Information Network (UMIN000020423). Written informed consent was obtained from all patients before undergoing TAVR.
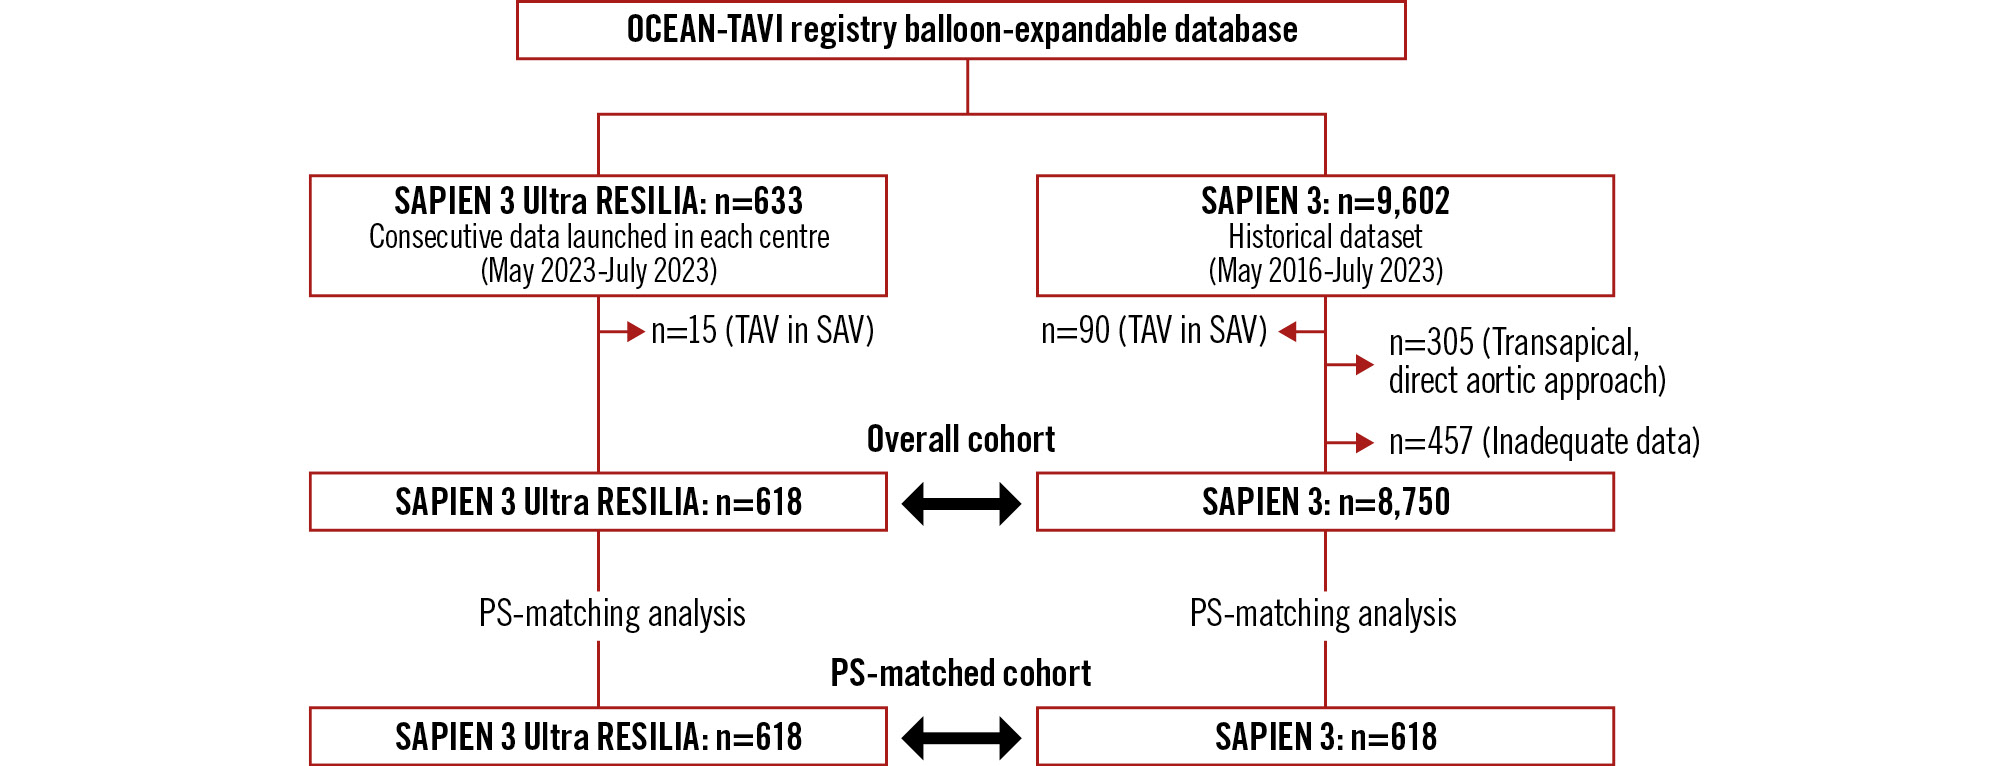
Figure 1. Study flowchart. PS: propensity score; TAV in SAV: transcatheter aortic valve in surgical aortic valve
DEVICE DESCRIPTION
The valve sizes of the S3 and S3UR were 20 mm, 23 mm, 26 mm, and 29 mm. The features of balloon-expandable S3 THVs have been reported previously38. The newest-generation S3UR carries bovine pericardial leaflets in dry storage and incorporates the anticalcification technology of RESILIA tissue. All S3UR THVs, regardless of size, have PET skirts extending 40% higher above the valve inflow than the former S3. In the smaller sizes of the S3UR, 20 mm and 23 mm, a specific new sewing manoeuvre is implemented (Supplementary Figure 1), and the leaflet sewing margin in each of the 3 commissural positions is smaller than the margin in the 26 mm and 29 mm S3UR valves. S3UR THVs are delivered through an eSheath+ (Edwards Lifesciences). The eSheath+ differs slightly from the previous eSheath with a locking system between the introducer and sheath. This sheath is adapted for transfemoral (TF) and transseptal (TS) approaches but not for transapical and direct aortic approaches. Thus, this system can be used only for TF and TS approaches.
DATA COLLECTION AND CLINICAL ENDPOINTS
The OCEAN-TAVI registry dataset included baseline patient characteristics, laboratory data, echocardiographic data, procedural variables, and clinical outcomes with respect to mortality, rehospitalisation, and other clinical adverse events. Information regarding the occurrence and/or causes of adverse events was obtained from the medical records of each centre or treating hospital or by contacting the patient’s family members. An electronic data capture system was used for the collection of the required data, and all data were checked via a self-audit by each site. Data committee members also confirmed the completeness and consistency of the database and regularly sent queries to each centre when necessary. All clinical endpoints, procedural data, periprocedural complications, postprocedural parameters, and in-hospital events were defined using the Valve Academic Research Consortium (VARC)-3 criteria9]. The severity of periprocedural complications was categorised in grades such as minor, major, or more. The definition of major bleeding was considered equal to or more than type 2 according to the previous formula noted in the VARC-3 guidelines. Conventional echocardiography was performed for all patients, and the echocardiographic parameters obtained before and after TAVR, and during index hospitalisation were evaluated according to the recommendations of the American Society of Echocardiography’s guidelines10. The degree of PVL was classified into 3 grades as none-trivial, mild, and greater than or equal to moderate (≥moderate). Postprocedural valve performance was evaluated using the effective orifice area (EOA), indexed EOA (iEOA), peak flow velocity, mean pressure gradient (mPG), and incidence of patient-prosthesis mismatch (PPM). PPM severity was categorised as no PPM, moderate PPM, or severe PPM, based on the iEOA values and patient body mass index (BMI) according to the VARC-3 definition9. The primary clinical endpoint was to evaluate early clinical outcomes including valve performance such as the degree of PVL, prevalence of postprocedural mPG >20 mmHg, and incidence of PPM after S3UR and S3 implantation.
STATISTICAL ANALYSIS
Continuous variables were expressed as the mean±standard deviation and as the median with interquartile range. Differences were tested using the unpaired Student’s t-test or Mann-Whitney U test, depending on the variable distribution. Considering the registry-based, non-randomised design of this study, a propensity score (PS)-matching analysis was adopted to minimise the numerous differences in baseline clinical characteristics and procedural variables. The PS was created using multivariate logistic regression analysis; the following significant variables were entered into the model as explanatory variables: age, sex, height, BMI, body surface area (BSA), peripheral artery disease, chronic obstructive pulmonary disease, New York Heart Association Class 3 and 4, chronic kidney disease, haemodialysis, baseline aortic valve area, baseline mPG, perimeter of the annulus calculated by computed tomography (CT), predilatation, post-dilatation, access route, and valve size (20-29 mm). According to the previous data, average BSA of 1.6 m2 and 1.8-1.9 m2 were reported in the Korean and Western TAVR cohorts, respectively567. The estimated iEOA of S3UR in each non-Japanese cohort was calculated, and the rates of PPM in the Korean (BSA 1.6 m2), Western 1 (BSA 1.8 m2), and Western 2 (BSA 1.9 m2) cohorts were estimated. One-to-one PS matching was performed using the nearest neighbour match on the PS with the calliper width of 0.01. The discrimination and calibration abilities of the PS were assessed using C-statistics (0.68, 95% confidence interval [CI]: 0.66-0.70; p<0.001) and the Hosmer-Lemeshow test (p=0.53). The validity of the model to balance variables between the matched groups was analysed using significance testing and standardised difference. A standardised difference of <0.1 suggests adequate variable balance after PS matching. Finally, 2 matched groups of S3UR and S3 including 618 patients per group were created. To minimise the differences in operator experience and temporal trends at each centre, the subgroup analysis concerning the postprocedural echocardiographic findings was also investigated for the data concerning S3UR (March 2023-July 2023) and S3 implanted in recent years (January 2022-March 2023). Thereafter, the PS-matching analysis was tested between the 2 groups (C-statistics: 0.64, 95% CI: 0.61-0.67; p<0.001). All statistical analyses were performed using SPSS Statistics v22 (IBM). All statistical tests were 2-sided, and a p-value of <0.05 was considered statistically significant.
Results
BASELINE PATIENT AND PROCEDURAL CHARACTERISTICS
Several clinical variables, such as body characteristics, baseline comorbidities, and laboratory data, were significantly different between the S3UR and S3 groups. In addition, the echocardiographic parameters of AS severity, annulus size of the perimeter defined by CT, access route approach, predilatation, post-dilatation, and THV valve size were significantly different between the 2 groups. However, after PS matching, all variables except for valve size showed adequate balance between the groups with their standardised differences of <0.1. The baseline patient and procedural characteristics are shown in Table 1. Considering the data for S3UR and S3 implanted in 2022-2023, the postprocedural echocardiographic findings are shown in Supplementary Table 1. Significantly better valve performances were still observed in the S3UR group than in the S3 group, and the results remained the same in the PS-matched cohort.
Table 1. Baseline characteristics between the overall and matched cohorts.
| Overall cohort | p-value | Propensity score-matched cohort | p-value | Standardised difference* | |||
|---|---|---|---|---|---|---|---|
| S3UR (n=618) | S3 (n=8,750) | S3UR (n=618) | S3 (n=618) | ||||
| Clinical variables | |||||||
| Age, years | 83.8±5.9 | 83.7±6.0 | 0.54 | 83.8±5.9 | 83.6±6.3 | 0.79 | 0.02 |
| Male | 249 (40.3) | 3,417 (39.1) | 0.55 | 249 (40.3) | 244 (39.5) | 0.77 | 0.02 |
| Height, cm | 153.8±9.9 | 152.5±9.5 | 0.002 | 153.8±9.9 | 154.2±6.3 | 0.86 | 0.01 |
| Body weight, kg | 52.6±11.0 | 52.3±10.9 | 0.51 | 52.6±11.0 | 53.1±10.9 | 0.41 | 0.05 |
| BMI, kg/m2 | 22.2±3.7 | 22.4±3.8 | 0.098 | 22.2±3.7 | 22.2±3.7 | 0.25 | 0.07 |
| BSA, m2 | 1.49±0.18 | 1.47±0.17 | 0.093 | 1.49±0.18 | 1.49±0.17 | 0.56 | 0.03 |
| Hypertension | 502 (81.2) | 7,076 (80.9) | 0.83 | 502 (81.2) | 489 (79.1) | 0.35 | 0.05 |
| Diabetes | 199 (32.2) | 2,553 (29.2) | 0.11 | 199 (32.2) | 178 (28.8) | 0.20 | 0.08 |
| Coronary artery disease | 203 (32.8) | 2,947 (33.7) | 0.67 | 203 (32.8) | 216 (35.0) | 0.44 | 0.04 |
| Peripheral artery disease | 103 (16.7) | 1,116 (12.8) | 0.005 | 103 (16.7) | 99 (16.0) | 0.76 | 0.02 |
| Atrial fibrillation | 143 (23.1) | 1,910 (21.8) | 0.45 | 143 (23.1) | 133 (21.5) | 0.50 | 0.04 |
| Previous stroke | 64 (10.4) | 1,036 (11.8) | 0.27 | 64 (10.4) | 81 (13.1) | 0.11 | 0.09 |
| NYHA III/IV | 203 (32.8) | 3,167 (36.2) | 0.094 | 203 (32.8) | 230 (37.2) | 0.11 | 0.09 |
| Chronic kidney disease | 478 (77.3) | 6,396 (73.1) | 0.021 | 478 (77.3) | 469 (74.9) | 0.55 | 0.03 |
| Haemodialysis | 136 (22.0) | 1,074 (12.3) | <0.001 | 136 (22.0) | 126 (20.4) | 0.49 | 0.04 |
| COPD | 66 (10.7) | 608 (6.9) | 0.001 | 66 (10.7) | 63 (10.2) | 0.78 | 0.02 |
| Previous CABG | 23 (3.7) | 324 (3.7) | 0.98 | 23 (3.7) | 28 (4.5) | 0.48 | 0.04 |
| Blood examinations | |||||||
| Creatinine, mg/dl | 1.08±0.62 | 1.04±0.59 | 0.17 | 1.08±0.62 | 1.05±0.60 | 0.38 | 0.06 |
| Estimated GFR, ml/min/1.73 m2 | 49.5±18.0 | 51.3±18.7 | 0.034 | 49.5±18.0 | 51.2±19.4 | 0.16 | 0.09 |
| Echocardiographic variables | |||||||
| AVA, cm2 | 0.69±0.20 | 0.67±0.20 | 0.026 | 0.69±0.20 | 0.69±0.20 | 0.65 | 0.03 |
| Indexed AVA, cm2/m2 | 0.47±0.14 | 0.46±0.13 | 0.11 | 0.47±0.14 | 0.47±0.13 | 0.53 | 0.04 |
| Peak flow velocity, m/sec | 4.3±0.63 | 4.4±0.76 | 0.002 | 4.3±0.63 | 4.3±0.74 | 0.66 | 0.03 |
| Peak pressure gradient, mmHg | 75.2±22.5 | 78.7±27.6 | <0.001 | 75.2±22.5 | 76.3±26.2 | 0.43 | 0.05 |
| Mean pressure gradient, mmHg | 43.5±14.5 | 45.9±17.3 | <0.001 | 43.5±14.5 | 44.1±16.8 | 0.47 | 0.04 |
| Left ventricular ejection fraction, % | 58.8±12.4 | 58.9±12.9 | 0.83 | 58.8±12.4 | 58.9±13.3 | 0.90 | 0.007 |
| Stroke volume, ml | 66.2±19.0 | 66.8±21.6 | 0.48 | 66.2±19.0 | 66.1±20.9 | 0.97 | 0.002 |
| CT variables | |||||||
| Area of annulus, mm2 | 422.7±78.7 | 420.9±77.6 | 0.58 | 422.7±78.7 | 425.6±79.6 | 0.53 | 0.04 |
| Perimeter of annulus, mm | 74.4±6.8 | 73.8±6.7 | 0.050 | 74.4±6.8 | 74.4±7.0 | 0.89 | 0.01 |
| Procedural variables | |||||||
| Transfemoral | 587 (95) | 8,609 (98.4) | <0.001 | 587 (95) | 587 (95) | >0.99 | <0.001 |
| Transsubclavian | 31 (5) | 141 (1.6) | 31 (5) | 31 (5) | |||
| Predilatation | 100 (16.2) | 2,051 (23.4) | <0.001 | 100 (16.2) | 115 (18.6) | 0.26 | 0.06 |
| Post-dilatation | 69 (11.2) | 2,123 (24.3) | <0.001 | 69 (11.2) | 70 (11.3) | >0.99 | 0.005 |
| Valve size | |||||||
| 20 mm | 49 (7.9) | 480 (5.5) | 0.048 | 49 (7.9) | 29 (4.7) | 0.12 | 0.14 |
| 23 mm | 330 (53.4) | 4,594 (52.5) | 330 (53.4) | 352 (57.0) | |||
| 26 mm | 198 (32.0) | 3,003 (34.3) | 198 (32.0) | 196 (31.7) | |||
| 29 mm | 41 (6.6) | 673 (7.7) | 41 (6.6) | 41 (6.6) | |||
| Values are n (%) or mean±SD. *Standardised difference for categorical variables and standardised mean difference for continuous variables. A standardised difference of <0.1 suggests adequate variable balance after propensity score matching. AVA: aortic valve area; BMI: body mass index; BSA: body surface area; CABG: coronary artery bypass grafting; COPD: chronic obstructive pulmonary disease; CT: computed tomography; GFR: glomerular filtration rate; NYHA: New York Heart Association; SD: standard deviation; S3: SAPIEN 3; S3UR: SAPIEN 3 Ultra RESILIA | |||||||
POSTPROCEDURAL ECHOCARDIOGRAPHY AND PROCEDURAL COMPLICATIONS
The results of postprocedural echocardiography and details of procedural complications are shown in Table 2. Both EOA (1.86±0.47 cm2 vs 1.67±0.46 cm2; p<0.001) and iEOA (1.26±0.31 cm2/m2 vs 1.14±0.30 cm2/m2; p<0.001) were significantly larger in the S3UR group than in the S3 group. The average peak velocity, peak pressure gradient (PG), and mPG were significantly lower in the S3UR group than in the S3 group (all p<0.05). Representative findings of valve performance are summarised in the Central illustration. The rates of PPM were significantly different between the S3UR and S3 groups (none: 94.3% vs 85.1%, moderate: 5.2% vs 12.8%, severe: 0.5% vs 2.0%; p<0.001). The rates of PVL ≥mild (13.0% vs 21.5%; p<0.001) and mPG ≥20 mmHg (1.6% vs 6.2%; p<0.001) were significantly lower in the S3UR group than in the S3 group. These significant differences remained in the PS-matched cohort (all p<0.05). The prevalence of in-hospital deaths was comparable between the 2 groups. Except for acute kidney injury, the rates of procedural complications were also similar between the 2 groups. After PS-matched analysis, the incidence of in-hospital death and procedural complications, including acute kidney injury, were not significantly different between the S3UR and the S3 groups.
Table 2. Postprocedural echocardiography and procedural complications.
| Overall cohort | p-value | Propensity-matched cohort | p-value | Standardised difference* | |||
|---|---|---|---|---|---|---|---|
| S3UR (n=618) | S3 (n=8,750) | S3UR (n=618) | S3 (n=618) | ||||
| Postprocedural echocardiographic variables | |||||||
| Effective orifice area, cm2 | 1.86±0.47 | 1.67±0.46 | <0.001 | 1.86±0.47 | 1.69±0.47 | <0.001 | 0.38 |
Indexed effective orifice area, cm2/m2 |
1.26±0.31 | 1.14±0.30 | <0.001 | 1.26±0.31 | 1.14±0.30 | <0.001 | 0.37 |
| Peak flow velocity, m/sec | 2.05±0.43 | 2.35±0.44 | <0.001 | 2.05±0.43 | 2.34±0.43 | <0.001 | 0.66 |
| Peak pressure gradient, mmHg | 17.6±7.3 | 22.8±8.7 | <0.001 | 17.6±7.3 | 22.6±8.2 | <0.001 | 0.64 |
| Mean pressure gradient, mmHg | 9.0±4.0 | 11.9±4.8 | <0.001 | 9.0±4.0 | 11.8±4.8 | <0.001 | 0.63 |
| Mean pressure gradient ≥20 mmHg | 10/615 (1.6) | 535/8,681 (6.2) | <0.001 | 10/615 (1.6) | 31/613 (5.1) | 0.001 | 0.19 |
| Paravalvular leakage ≥mild | 80/615 (13.0) | 1,870/8,681 (21.5) | <0.001 | 80/615 (13.0) | 143/613 (23.3) | <0.001 | 0.27 |
| Paravalvular leakage | |||||||
| None-trivial | 535/615 (87.0) | 6,811/8,681 (78.5) | <0.001 | 535/615 (87.0) | 470/613 (76.7) | <0.001 | 0.28 |
| Mild | 77/615 (12.5) | 1,778/8,681 (20.5) | 77/615 (12.5) | 133/613 (21.7) | |||
| ≥Moderate | 3/615 (0.5) | 92/8,681 (1.1) | 3/615 (0.5) | 10/613 (1.6) | |||
| Patient-prosthesis mismatch | |||||||
| None | 580/615 (94.3) | 7,390/8,682 (85.1) | 580/615 (94.3) | 526/613 (85.8) | <0.001 | 0.29 | |
| Moderate | 32/615 (5.2) | 1,115/8,682 (12.8) | <0.001 | 32/615 (5.2) | 72/613 (11.7) | ||
| Severe | 3/615 (0.5) | 177/8,682 (2.0) | 3/615 (0.5) | 15/613 (2.4) | |||
| Procedural complications (in-hospital) | |||||||
| In-hospital death | 10 (1.6) | 160 (1.8) | 0.71 | 10 (1.6) | 16 (2.6) | 0.23 | 0.07 |
| Conversion to open heart surgery | 3 (0.5) | 33 (0.4) | 0.67 | 3 (0.5) | 1 (0.2) | 0.32 | 0.03 |
| Major stroke | 5 (0.8) | 71 (0.8) | 0.99 | 5 (0.8) | 3 (0.2) | 0.48 | 0.04 |
| ≥Major bleeding | 37 (6.4) | 542 (6.2) | 0.84 | 37 (6.4) | 36 (5.8) | 0.90 | 0.007 |
| Major vascular complication | 9 (1.5) | 184 (2.1) | 0.27 | 9 (1.5) | 9 (1.5) | >0.99 | <0.001 |
| Cardiac tamponade | 3 (0.5) | 58 (0.7) | 0.60 | 3 (0.5) | 1 (0.2) | 0.12 | 0.06 |
| Acute kidney injury | 14 (2.3) | 339 (3.9) | 0.042 | 14 (2.3) | 15 (2.4) | 0.85 | 0.01 |
| Acute kidney injury stage 3 | 5 (0.8) | 64 (0.7) | 0.83 | 5 (0.8) | 4 (0.6) | 0.74 | 0.02 |
| New pacemaker implantation | 33/587 (5.6) | 496/8,258 (6.0) | 0.70 | 33/587 (5.6) | 35/584 (6.0) | 0.79 | 0.02 |
| Values are n (%), n/N (%) or mean±SD. *Standardised difference for categorical variables and standardised mean difference for continuous variables. SD: standard deviation; S3: SAPIEN 3; S3UR: SAPIEN 3 Ultra RESILIA | |||||||
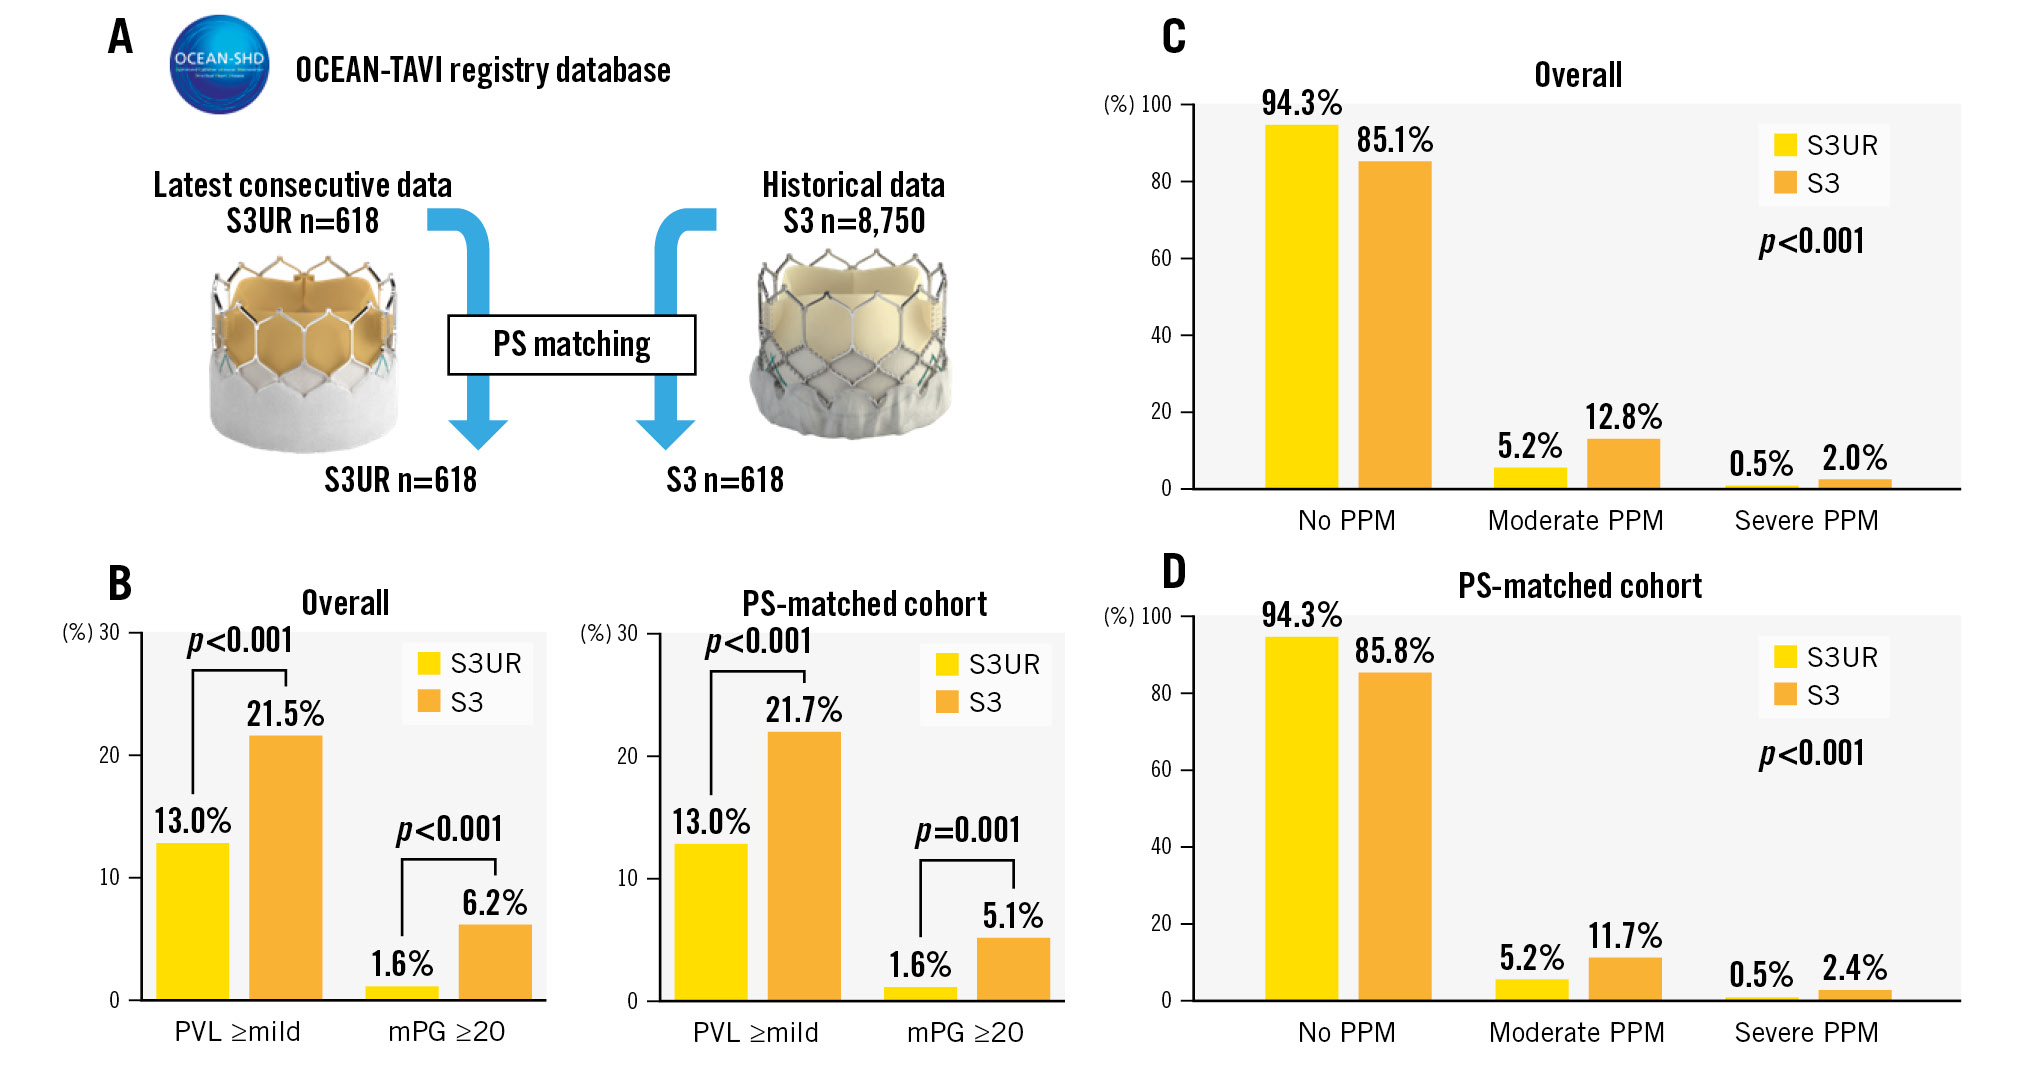
Central illustration. Comparison of valve performance between S3UR and S3 THVs as evaluated according to the incidence of PPM, PVL ≥mild, and mPG ≥20 mmHg in the entire cohort and in the PS-matched cohort. A) The patient population between the S3UR and S3 in this study. B) The incidence of PVL ≥mild and mPG ≥20 between the S3UR and S3 (Right: overall cohort, Left: PS-matched cohort). C) The incidence of PPM between the S3UR and S3 in the overall cohort. D) The incidence of PPM between the S3UR and S3 in the PS-matched cohort. mPG: mean pressure gradient; PPM: patient-prosthesis mismatch; PS: propensity score; PVL: paravalvular leakage; S3: SAPIEN 3; S3UR: SAPIEN 3 Ultra RESILIA; THV: transcatheter heart valve
HAEMODYNAMIC DIFFERENCES BETWEEN S3UR AND S3 BY VALVE SIZE
The postprocedural echocardiographic findings by valve size are shown in Table 3. EOA and iEOA were larger in the S3UR group than in the S3 group (all p<0.05). Regardless of the valve size, peak velocity, peak PG, and mPG were lower in the S3UR group than in the S3 group (all p<0.05). The results above did not change in the PS-matched analysis (all p<0.05). The incidence of moderate PPM, severe PPM, PVL ≥mild, and mPG ≥20 mmHg differed by valve size between the S3UR and S3 groups (Figure 2). The absolute percentages of these parameters were lower for S3UR than for S3 for each valve size. The PPM rates for the 20 mm valve were significantly different between the S3UR and S3 groups (none: 91.8% vs 65.7%, moderate: 8.2% vs 27.6%, severe: 0% vs 6.6%; all p=0.001). Similar results were obtained for the 23 mm valve (none: 93.6% vs 83.0%, moderate: 5.5% vs 14.6%, severe: 0.9% vs 2.4%; all p<0.001). The incidence of PPM for the 20 mm and 23 mm valves also differed between the 2 groups (all p<0.05). However, these trends were not similar to those of the 26 mm and 29 mm valves in the overall and PS-matched cohorts. Figure 3A shows the relationship between the baseline CT annulus area and postprocedural EOA, and Figure 3B shows the relationship between the baseline CT annulus area and iEOA. The line of best fit, based on the scatter plot, shows the differences between the S3UR and S3. The average EOA was significantly larger for the S3UR than for the S3 (1.86±0.47 cm2 vs 1.68±0.45 cm2; p<0.001). The average iEOA was also larger for the S3UR than for the S3 (1.26±0.31 cm2/m2 vs 1.14±0.30 cm2/m2; p<0.001). The estimated PPM rates of the S3UR were stratified by each BSA size of the Japanese and non-Japanese cohorts (Figure 4), and even in patients with a large BSA, lower rates of severe PPM were observed, from 0.5% to 3.1%.
Table 3. Postprocedural echocardiographic findings for each valve size.
| Device size | Overall cohort | p-value | Propensity-matched cohort | p-value | ||
|---|---|---|---|---|---|---|
| S3UR 20 mm (n=49) | S3 20 mm (n=467) | S3UR 20 mm (n=49) | S3 20 mm (n=29) | |||
| Postprocedural echocardiographic variables | ||||||
| Effective orifice area, cm2 | 1.54±0.31 | 1.28±0.32 | <0.001 | 1.54±0.31 | 1.22±0.28 | <0.001 |
| Indexed effective orifice area, cm2/m2 | 1.17±0.28 | 0.97±0.26 | <0.001 | 1.17±0.28 | 0.94±0.23 | <0.001 |
| Peak flow velocity, m/sec | 2.38±0.44 | 2.71±0.50 | <0.001 | 2.38±0.45 | 2.87±0.56 | <0.001 |
| Peak pressure gradient, mmHg | 23.5±8.3 | 30.5±10.9 | <0.001 | 23.5±8.3 | 34.2±11.9 | <0.001 |
| Mean pressure gradient, mmHg | 12.4±5.2 | 16.5±6.2 | <0.001 | 12.4±5.2 | 18.9±8.3 | <0.001 |
| Mean pressure gradient ≥20 mmHg | 3 (6.1) | 123 (26.3) | 0.002 | 3 (6.1) | 12 (41.4) | 0.001 |
| Paravalvular leakage ≥mild | 9 (18.4) | 153 (32.8) | 0.039 | 9 (18.4) | 14 (48.3) | 0.009 |
| Paravalvular leakage | ||||||
| None-trivial | 40 (81.6) | 314 (67.2) | 40 (81.6) | 15 (51.7) | ||
| Mild | 8 (16.3) | 145 (31.0) | 0.10 | 8 (16.3) | 13 (44.8) | 0.019 |
| ≥Moderate | 1 (2.0) | 8 (1.7) | 1 (2.0) | 1 (3.4) | ||
| Patient-prosthesis mismatch | ||||||
| None | 45 (91.8) | 307 (65.7) | 45 (91.8) | 17 (58.6) | ||
| Moderate | 4 (8.2) | 129 (27.6) | 0.001 | 4 (8.2) | 10 (34.5) | 0.002 |
| Severe | 0 (0) | 31 (6.6) | 0 (0) | 2 (6.9) | ||
| Device size | Overall cohort | Propensity-matched cohort | ||||
| S3UR 23 mm(n=339) | S3 23 mm(n=4,520) | S3UR 23 mm(n=330) | S3 23 mm(n=352) | |||
| Postprocedural echocardiographic variables | ||||||
| Effective orifice area, cm2 | 1.73±0.40 | 1.53±0.37 | <0.001 | 1.73±0.40 | 1.57±0.39 | <0.001 |
| Indexed effective orifice area, cm2/m2 | 1.23±0.30 | 1.10±0.51 | <0.001 | 1.22±0.30 | 1.11±0.30 | <0.001 |
| Peak flow velocity, m/sec | 2.13±0.41 | 2.44±0.42 | <0.001 | 2.13±0.41 | 2.39±0.40 | <0.001 |
| Peak pressure gradient, mmHg | 18.9±7.2 | 24.5±8.5 | <0.001 | 18.9±7.2 | 23.6±7.8 | <0.001 |
| Mean pressure gradient, mmHg | 9.8±3.9 | 12.8±4.7 | <0.001 | 9.8±3.9 | 12.4±4.5 | <0.001 |
| Mean pressure gradient ≥20 mmHg | 7/327 (2.1) | 320/4,519 (7.1) | <0.001 | 7/327 (2.1) | 16/350 (4.6) | 0.081 |
| Paravalvular leakage ≥mild | 41 (12.5) | 982/4,519 (21.7) | <0.001 | 41/327 (12.5) | 77/350 (22.0) | 0.001 |
| Paravalvular leakage | ||||||
| None-trivial | 286/327 (87.5) | 3,537/4,519 (78.3) | 286/327 (87.5) | 273/350 (78.0) | ||
| Mild | 39/327 (11.9) | 934/4,519 (20.7) | <0.001 | 39/327 (11.9) | 72/350 (20.6) | 0.005 |
| ≥Moderate | 2/327 (0.6) | 40/4,519 (0.9) | 2/327 (0.6) | 5/350 (1.4) | ||
| Patient-prosthesis mismatch | ||||||
| None | 306/327 (93.6) | 3,752/4,519 (83.0) | 306/327 (93.6) | 292/350 (83.4) | ||
| Moderate | 18/327 (5.5) | 659/4,519 (14.6) | <0.001 | 18/327 (5.5) | 47/350 (13.4) | <0.001 |
| Severe | 3/327 (0.9) | 108/4,519 (2.4) | 3/327 (0.9) | 11/350 (3.1) | ||
| Device size | Overall cohort | Propensity-matched cohort | ||||
| S3UR 26 mm(n=198) | S3 26 mm(n=2948) | S3UR 26 mm(n=198) | S3 26 mm(n=196) | |||
| Postprocedural echocardiographic variables | ||||||
| Effective orifice area, cm2 | 2.04±0.43 | 1.83±0.44 | <0.001 | 2.04±0.43 | 1.83±0.40 | <0.001 |
| Indexed effective orifice area, cm2/m2 | 1.31±0.32 | 1.19±0.31 | <0.001 | 1.31±0.32 | 1.18±0.27 | <0.001 |
| Peak flow velocity, m/sec | 1.90±0.39 | 2.20±0.40 | <0.001 | 1.90±0.39 | 2.19±0.36 | <0.001 |
| Peak pressure gradient, mmHg | 15.1±6.0 | 20.1±7.3 | <0.001 | 15.1±6.0 | 19.8±6.4 | <0.001 |
| Mean pressure gradient, mmHg | 7.6±3.1 | 10.3±3.9 | <0.001 | 7.6±3.1 | 10.2±3.5 | <0.001 |
| Mean pressure gradient ≥20 mmHg | 0 (0) | 64/2,946 (2.2) | 0.036 | 0 (0) | 3/193 (1.6) | 0.078 |
| Paravalvular leakage ≥mild | 26 (13.1) | 574/2,946 (19.5) | 0.028 | 26 (13.1) | 143/193 (23.3) | <0.001 |
| Paravalvular leakage | ||||||
| None-trivial | 172 (86.9) | 2,372/2,946 (80.5) | 172 (86.9) | 150/193 (77.7) | ||
| Mild | 26 (13.1) | 549/2,946 (18.6) | 0.058 | 26 (13.1) | 41/193 (21.2) | 0.033 |
| ≥Moderate | 0 (0) | 25/2,946 (0.8) | 0 (0) | 2/193 (1.0) | ||
| Patient-prosthesis mismatch | ||||||
| None | 189 (95.5) | 2,622/2,947 (89.0) | 189 (95.5) | 176/193 (91.2) | ||
| Moderate | 9 (4.5) | 293/2,947 (9.9) | 0.013 | 9 (4.5) | 15/193 (7.8) | 0.14 |
| Severe | 0 (0) | 32/2,947 (1.1) | 0 (0) | 2/193 (1.0) | ||
| Device size | Overall cohort | Propensity-matched cohort | ||||
| S3UR 29 mm(n=41) | S3 29 mm(n=655) | S3UR 29 mm(n=41) | S3 29 mm(n=41) | |||
| Postprocedural echocardiographic variables | ||||||
| Effective orifice area, cm2 | 2.38±0.59 | 2.11±0.53 | 0.002 | 2.38±0.59 | 2.28±0.46 | 0.41 |
| Indexed effective orifice area, cm2/m2 | 1.39±0.36 | 1.29±0.35 | 0.094 | 1.39±0.36 | 1.40±0.30 | 0.83 |
| Peak flow velocity, m/sec | 1.74±0.35 | 2.13±0.37 | <0.001 | 1.74±0.35 | 2.14±0.37 | <0.001 |
| Peak pressure gradient, mmHg | 12.6±4.6 | 18.7±6.3 | <0.001 | 12.6±4.6 | 19.0±6.4 | <0.001 |
| Mean pressure gradient, mmHg | 6.5±2.4 | 9.5±3.6 | <0.001 | 6.5±2.4 | 9.8±3.5 | <0.001 |
| Mean pressure gradient ≥20 mmHg | 0 (0) | 6 (0.9) | 0.54 | 0 (0) | 0 (0) | >0.99 |
| Paravalvular leakage ≥mild | 4 (9.8) | 134 (20.5) | 0.095 | 4 (9.8) | 9 (22.0) | 0.23 |
| Paravalvular leakage | ||||||
| None-trivial | 37 (90.2) | 521 (79.5) | 37 (90.2) | 32 (78.0) | ||
| Mild | 4 (9.8) | 123 (18.9) | 0.23 | 4 (9.8) | 7 (17.1) | 0.20 |
| ≥Moderate | 0 (0) | 10 (1.5) | 0 (0) | 2 (4.9) | ||
| Patient-prosthesis mismatch | ||||||
| None | 40 (97.6) | 615 (93.9) | 40 (97.6) | 41 (100) | ||
| Moderate | 1 (2.4) | 34 (5.2) | 0.60 | 1 (2.4) | 0 (0) | 0.31 |
| Severe | 0 (0) | 6 (0.9) | 0 (0) | 0 (0) | ||
| Values are n (%), n/N (%) or mean±SD. SD: standard deviation; S3: SAPIEN 3; S3UR: SAPIEN 3 Ultra RESILIA | ||||||
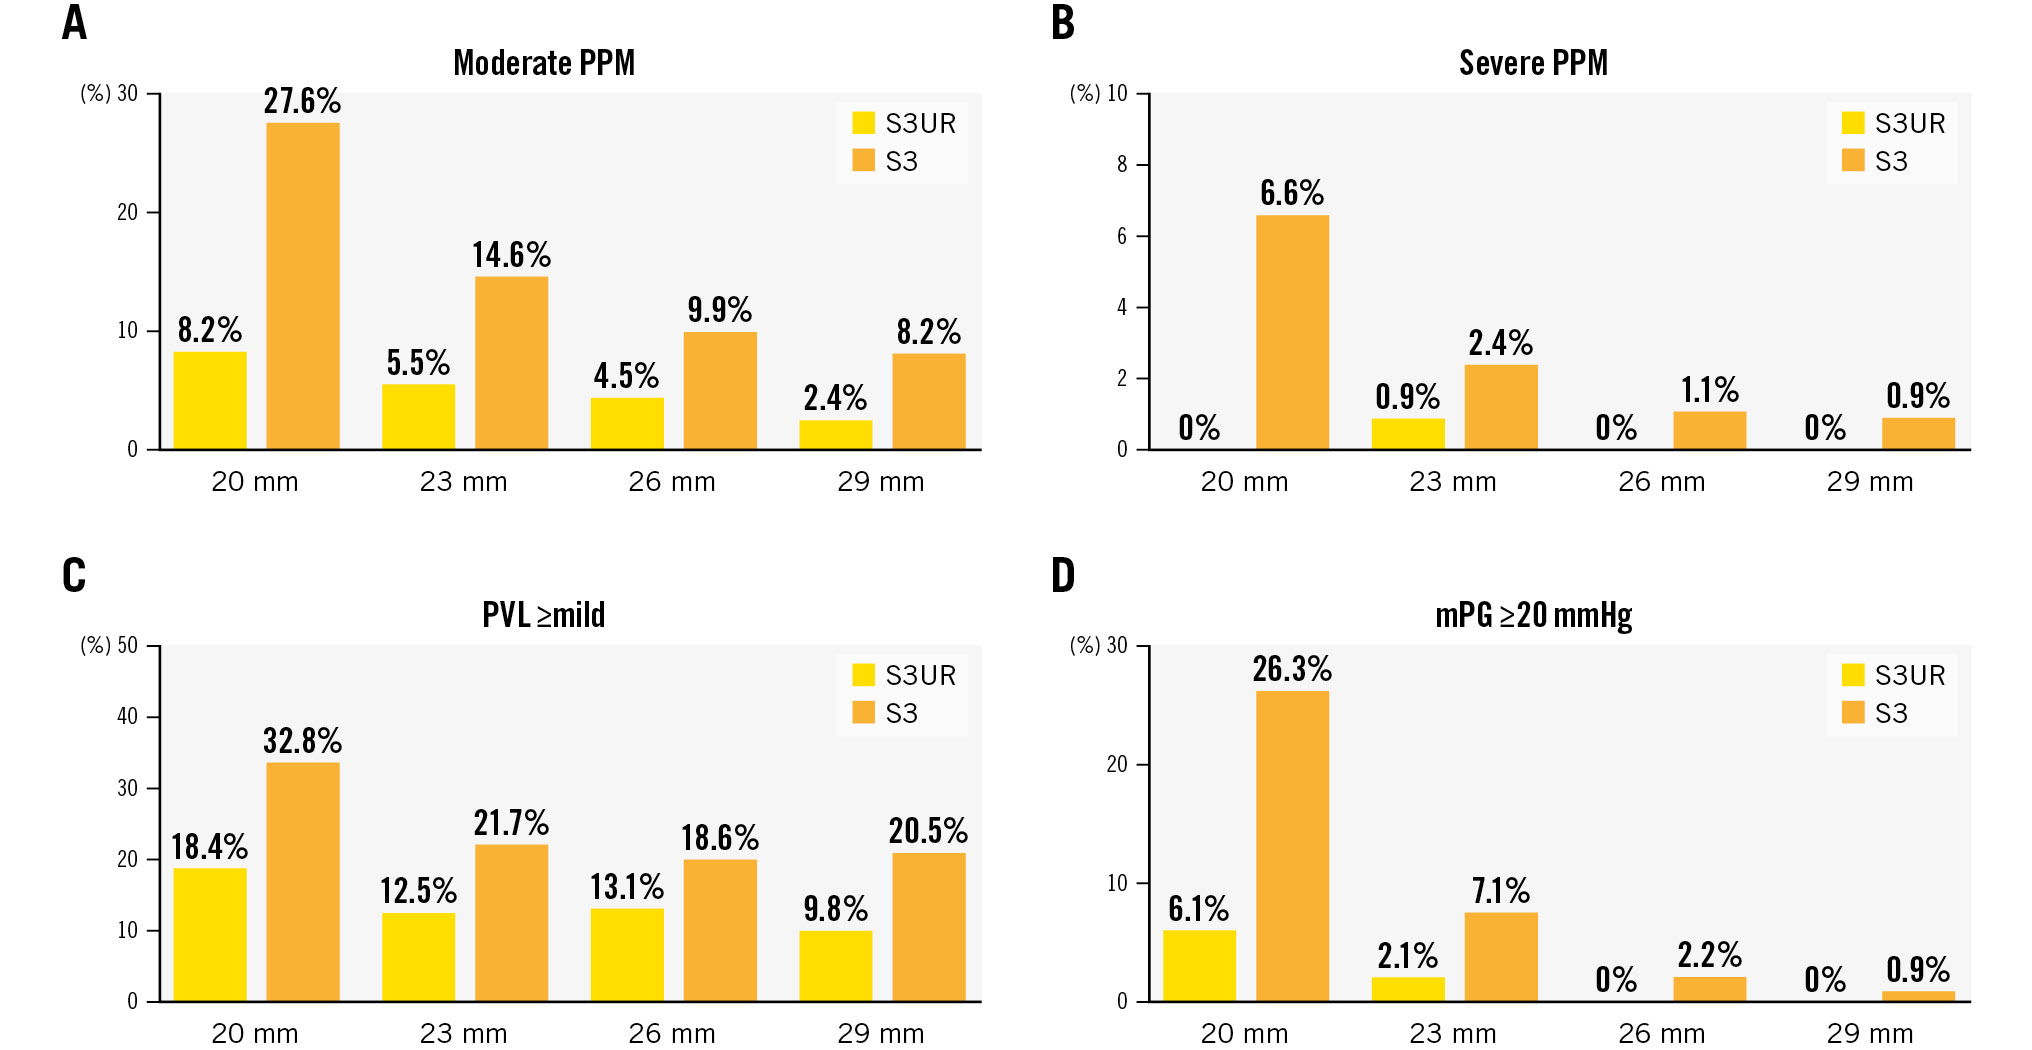
Figure 2. Incidence of moderate PPM, severe PPM, PVL ≥mild, and mPG ≥20 mmHg by valve size of S3UR and S3 THVs. A) Moderate PPM; B) Severe PPM; C) PVL ≥mild; D) mPG ≥20 mmHg. mPG: mean pressure gradient; PPM: patient-prosthesis mismatch; PVL: paravalvular leakage; S3: SAPIEN 3; S3UR: SAPIEN 3 Ultra RESILIA; THV: transcatheter heart valve
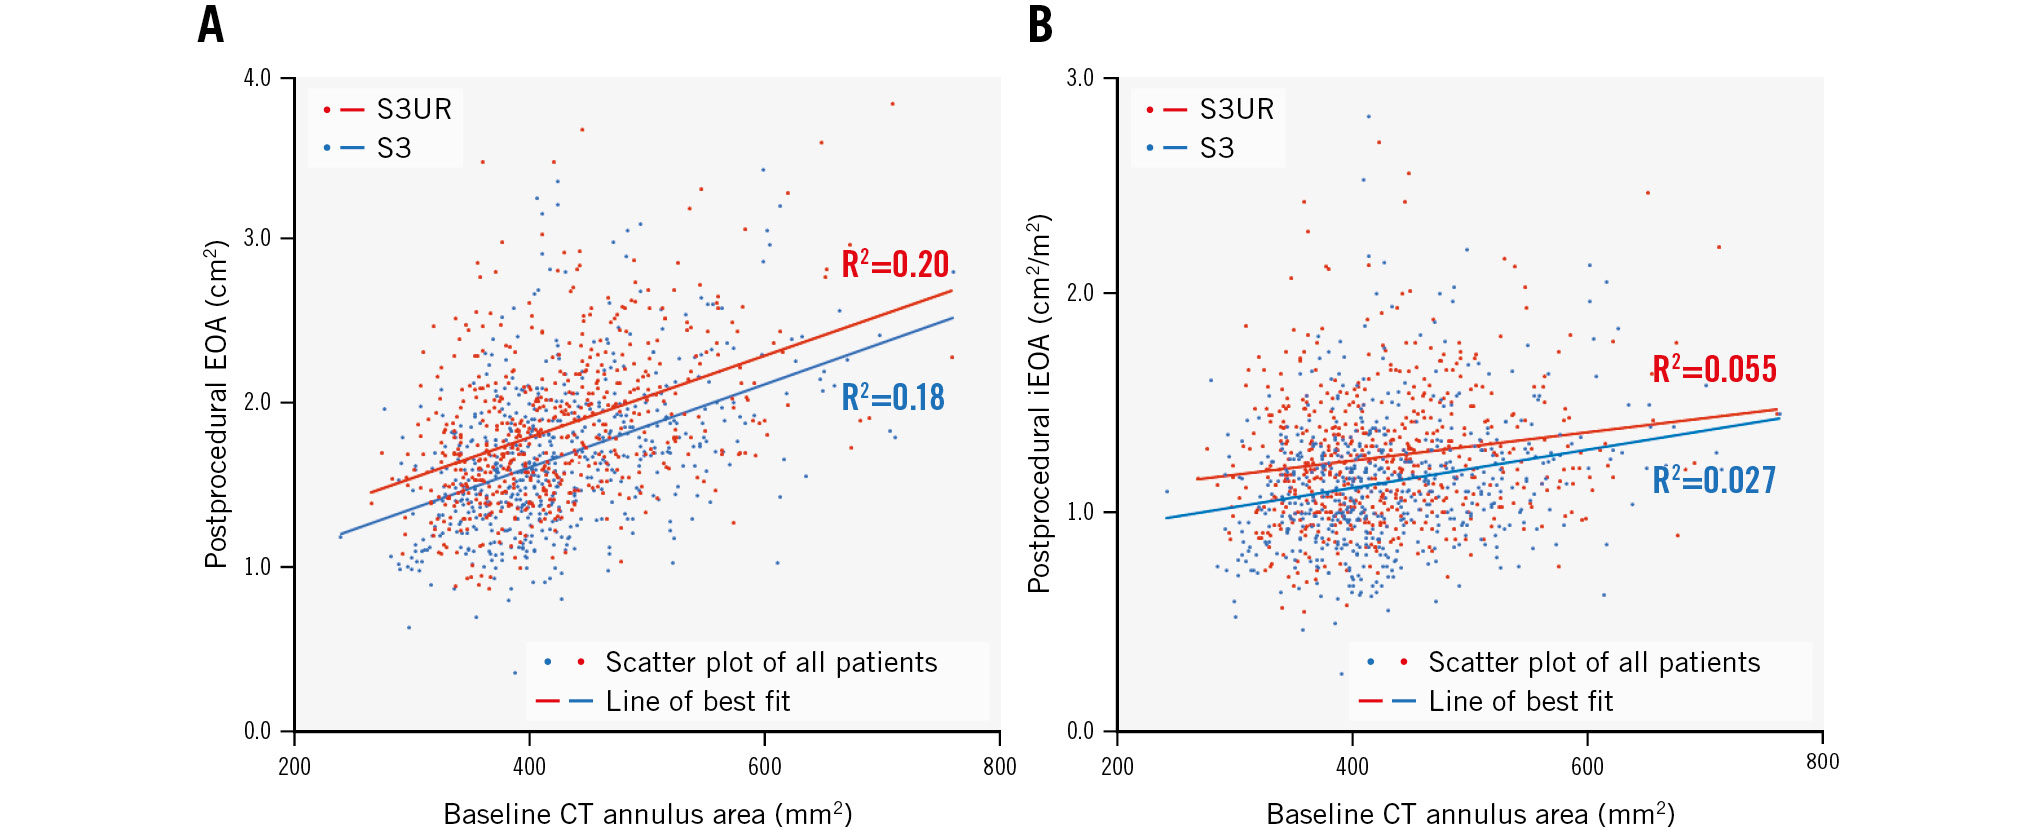
Figure 3. Scatter plot between the baseline CT annulus area and postprocedural echocardiographic findings in the S3UR (red dots) and S3 (blue dots). A) Relationship between the baseline CT annulus area and postprocedural EOA. B) Relationship between the baseline CT annulus area and postprocedural iEOA. CT: computed tomography; EOA: effective orifice area; iEOA: indexed EOA
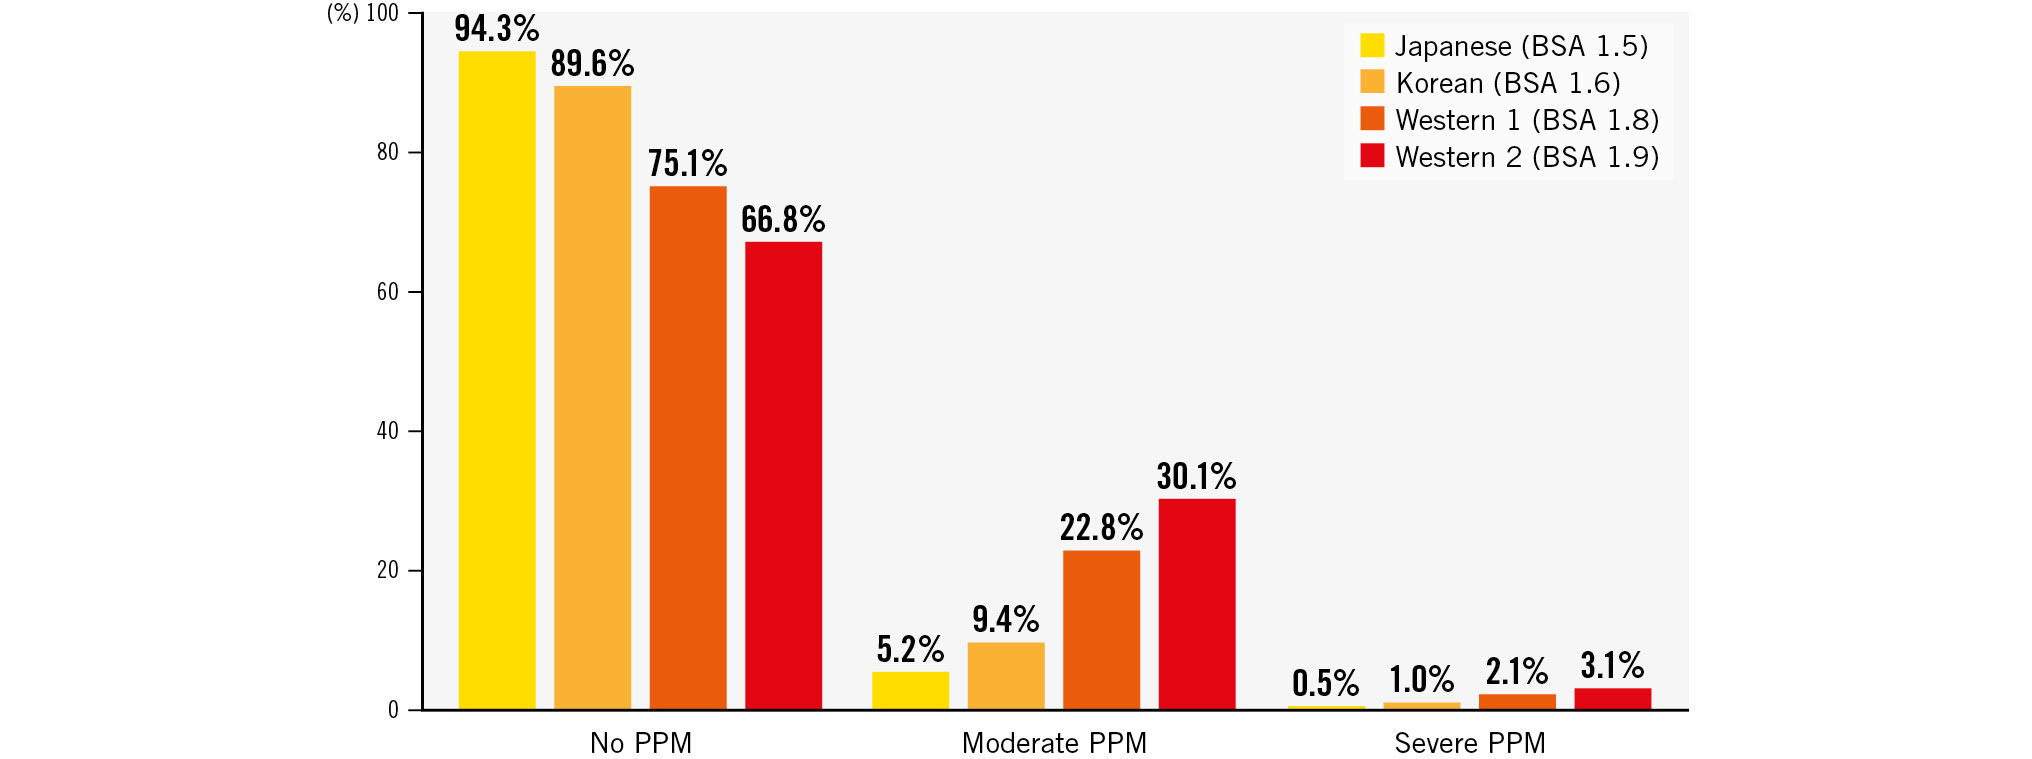
Figure 4. The estimated PPM rates of the S3UR based on each BSA size between the Japanese and non-Japanese cohorts. BSA: body surface area; PPM: patient-prosthesis mismatch; S3UR: SAPIEN 3 Ultra RESILIA
Discussion
MAIN FINDINGS
The current study found many clinical advantages of the S3UR over the S3, including markedly lower rates of PPM, even with smaller S3UR valves. In addition, these benefits remained consistent after propensity matching. The excellent valve performance of the S3UR in this study provides new insights into decision-making about the choice of THV in TAVR.
INCIDENCE OF PVL AFTER S3UR IMPLANTATION
One of the main issues with THVs is the relatively higher incidence of post-TAVR PVL compared with surgical bioprostheses12. Moderate PVL is associated with worse prognosis after TAVR1112. Although the clinical impact of mild PVL after TAVR is still debated, most findings indicate that it is associated with an increased risk of mortality and rehospitalisation for heart failure1112131415. In this context, the next-generation S3Ultra was developed with a PET skirt that was 40% longer than that in the S3. The S3Ultra is associated with significantly lower rates of post-TAVR PVL, with the rate of mild PVL decreased by ≤15% and that of ≥moderate PVL maintained at around 1%567. Although the current study includes data from 29 mm THVs, which are not available in the S3Ultra series, the findings are comparable to those in previous studies (mild PVL: 13.0%, ≥moderate PVL: 0.5%). Moreover, the longer PET skirts in S3UR THVs did not increase the risk of other procedural complications, such as all-cause death, vascular injuries, bleeding, or the need for new pacemaker implantations, after TAVR.
INCIDENCE OF PPM AFTER TAVR
THVs, particularly in the smaller native aortic annulus, have advantages over surgical bioprostheses, including a lower incidence of PPM. This is attributed to the absence of a sewing ring during surgical aortic valve replacement (SAVR). Some of the effective annulus area is lost in the surgical sewing space, but THVs can be directly implanted in the native aortic annulus. The rate of PPM after THV implantation ranges from 20% to 50%; accordingly, the incidence of PPM is 2.0- to 4.0-fold higher after SAVR than after TAVR161718. We previously reported that self-expanding THVs with a supra-annular design offered further haemodynamic benefits in small annuli when compared with balloon-expandable THVs19; moreover, a relatively lower incidence of PPM was reported following the use of balloon-expandable THVs (SAPIEN XT: 8.9%, S3: 14.7%)20. Another study that used multicentre registry data of both balloon-expandable and self-expanding THVs showed a lower incidence of PPM in the Asian cohort than in the Western cohort (overall PPM: 33.6% vs 54.5%, moderate PPM: 26.5% vs 29.8%, and severe PPM: 7.1% vs 24.7%, respectively)21. Compared to these results, the current study reports a lower incidence of PPM at 6.7%. Considering the model for presuming the incidence of PPM in the non-Japanese cohort, lower rates of severe PPM in the S3UR were also observed in the Korean cohort (1.0%) and the average (2.1%) and relatively larger (3.1%) BSA sizes of the Western cohort. The lower severe PPM rates could be maintained even with an increase in BSA size, such as in the non-Japanese cohort. However, these results should be validated using real non-Japanese cohorts who have undergone S3UR THV implantation.
PROGNOSTIC IMPACT OF PPM
PPM is not a benign entity, and the occurrence of PPM after SAVR is an important issue related to an increased risk of mortality22. A recent large-scale SAVR study demonstrated that severe PPM is associated with increased risks of mortality and heart failure, whereas the significance of moderate PPM may be negligible because of its low clinical impact23. Meanwhile, some reports indicate no association between PPM and increased mortality in TAVR1624; however, national-based data and meta-analysis reveal that patients who have severe PPM and undergo TAVR have poor clinical outcomes1825. These results suggest that preventive strategies against severe PPM are warranted in patients undergoing TAVR and SAVR. The results of this study showed excellent outcomes after S3UR THV implantation, with the rates of severe PPM mitigated by 0.5%.
OTHER PARAMETERS REFLECTING VALVE PERFORMANCE
iEOA, as an indicator of PPM, is determined by dividing individual BSA values; thus, differences in BSA are key factors when discussing the incidence of PPM. Although the Asian cohort has a smaller valve anatomy, the lower incidence of PPM is explained by the smaller BSA. Therefore, other parameters, such as absolute postprocedural PG in THVs, should be evaluated to confirm valve performance. Interestingly, previous data revealed low rates of PPM, but higher rates of postprocedural mPG ≥20 mmHg (Asian countries: 12.1%, Western countries: 8.7%)21. However, we found a significantly lower rate of postprocedural mPG ≥20 mmHg in the S3UR group (1.6%). The average peak gradient and mPG were also significantly lower in the S3UR group. The larger EOA and iEOA were also confirmed on the basis of the individual baseline CT annulus area. In addition to the low PPM rates, other valve performance parameters were significantly better in the S3UR group.
SPECULATION FOR THE IMPROVED VALVE PERFORMANCE OF S3UR
Any previous data using S3Ultra compared with the S3 did not reveal a significant change in the valve performance (e.g., PPM rate, peak velocity, and/or mPG) except for a lower incidence of PVL5678. Thus, improved haemodynamic valve performance could be attributed to S3UR technology. Although the mechaÂnism of the improved haemodynamics of S3UR is unclear, data from patients who have undergone SAVR reveal better postprocedural haemodynamics with the RESILIA tissue bioprosthesis than with the previous one2627. The RESILIA tissue bioprosthesis itself may contribute to the better haemodynamics. Another possible reason is that the 20 mm and 23 mm S3UR THVs were modified using the sewing leaflet method in each commissure. Although better haemodynamics were observed in the 26 mm and 29 mm S3UR, this modification for 20 mm and 23 mm S3UR may result in a better EOA than that in previous models. Further investigations are required to establish the superior valve performance of the S3UR.
FUTURE PERSPECTIVES
With the expansion of the indication of TAVR treatments to lower surgical risk and younger patients with AS, lifetime management is of paramount importance for an appropriate choice of the first invasive therapeutic approach between SAVR and TAVR. Better haemodynamics with smaller balloon-expandable THVs can provide new insights into TAV in SAV, as well as into future TAV in SAV procedures. In cases of TAV in SAV, balloon-expandable THVs have the advantage of permitting future percutaneous coronary intervention. However, a higher residual gradient and increased PPM rates are major limitations28. The improved haemodynamic performance of the smaller-sized S3UR may be beneficial for reducing the risk of PPM after TAV in SAV. Larger and longer THVs also pose a potential risk of sinus sequestration after TAV in SAV29. A smaller valve may preserve the Valsalva sinus space between the implanted THVs after the initial TAVR. As another important aspect, it remains uncertain that the preferable valve haemodynamics of S3UR translate to long-term durability. These clinically important aspects need to be clarified in future clinical investigations.
Limitations
Although this study included a relatively large number of patients, the observational, unblinded, and non-randomised registry data had inherent limitations. Although a registry-derived consensus document was shared in each centre regarding the echocardiographic assessment based on the guidelines and VARC-3 criteria, no independent core laboratory was present in this registry. The procedural complications and clinical outcomes were reported by individual centre physicians without an events committee to scrutinise the clinical events. Thus, selection bias was inevitable. Even after adjusting for several variables using propensity matching, uncaptured or missing important clinical factors should be addressed. Although the CT annulus area and perimeter were adjusted in the PS-matching model, more precise anatomical features, such as aortic angle, coronary height and aortic valve calcium proliferation, could not be completely captured. This study focused on early clinical outcomes without long-term follow-up. The sample sizes for the 20 mm and 29 mm S3UR THV subgroups were small. In this study, the S3 was used in the comparator group, not the previous version of the S3Ultra, which could limit the findings for translatability to contemporary clinical practice broadly. The data consisted of a uniform Japanese cohort, and the majority of our Japanese patients had a small BSA; thus, the lower rates of PPM after THV implantation in our cohort, compared to the Western cohort, may be inaccurate. Therefore, our conclusions may have limited generalisability. Additional large-scale studies using global data are warranted to verify our findings. The incidence of PPM after S3UR THV implantation should be validated in other clinical studies. Finally, better valve haemodynamic performance was confirmed in all balloon-expandable S3UR THVs − even in smaller valves − than in S3 THVs. However, comparative data regarding the haemodynamic differences in other self-expanding THVs are lacking, thus requiring further investigations.
Conclusions
The results of the present study demonstrate equivalent procedural complications but less PVL and significantly better valve performance with the S3UR than with the S3 in patients who undergo TAVR. Importantly, the rate of PPM after S3UR THV implantation is significantly lower, even after propensity score matching and even with the use of smaller 20 mm and 23 mm S3UR THVs. Overall, the latest-generation S3UR has considerably improved the previous limitations of balloon-expandable THVs.
Impact on daily practice
The latest-generation balloon-expandable SAPIEN 3 Ultra RESILIA (S3UR) transcatheter heart valves (THVs) have been launched for the treatment of patients with aortic stenosis. S3UR THVs, especially the smaller valves, have significantly better valve performance (low incidence of patient-prosthesis mismatch, paravalvular leakage ≥mild, and a mean pressure gradient ≥20 mmHg) than previous-generation THVs. Considering the long history of bioprosthetic valves, the improved valve performance of the S3UR should be highlighted as a novel finding.
Acknowledgements
The authors thank the investigators and institutions that have participated in the OCEAN-TAVI registry.
Funding
The OCEAN-TAVI registry is supported by Edwards Lifesciences, Medtronic, Boston Scientific, Abbott, and Daiichi Sankyo.
Conflict of interest statement
K. Nishioka is a clinical proctor for Edwards Lifesciences. M. Izumo is a screening proctor for Edwards Lifesciences. F. Yashima, Y. Ohno, and M. Asami are clinical proctors for Medtronic. T. Naganuma, K. Mizutani, H. Ueno, K. Takagi, and Y. Fuku are clinical proctors for Edwards Lifesciences and Medtronic. M. Yamamoto, S. Shirai, N. Tada, K. Yamasaki, D. Hachinohe, Y. Watanabe, and K. Hayashida are clinical proctors for Edwards Lifesciences, Abbott, and Medtronic. The other authors have no conflicts of interest to declare.
Supplementary data
To read the full content of this article, please download the PDF.