Abstract
BACKGROUND: In order to identify coronary lesions that cause myocardial ischaemia and require revascularisation, fractional flow reserve (FFR) is widely recommended. Recently, a method of estimating the FFR using morphological features measured by an imaging device was developed. However, all the previously developed methods are conducted offline, and such analysis takes approximately 10 minutes.
AIMS: The aim of this present study was to develop an online measurement of the FFR using an intravascular ultrasound (IVUS) quantitative method (IQ-FFR).
METHODS: This prospective, single-centre study included coronary lesions that met the following criteria: (1) presence of at least one stenosis (25-99%); (2) both IVUS and FFR measurement performed just before and after stent implantation, with the wire-derived FFR measured with a standard method; and (3) acquisition of clear images throughout the entire coronary branch.
RESULTS: We developed an IVUS analysis system that automatically measures the cross-sectional area every 0.5 mm, and we calculated the IQ-FFR. In the prediction study, we calculated the IQ-FFR on the assumption that one stent of arbitrary length and diameter was implanted. After stent implantation, the wire-derived FFR was measured and compared with the calculated IQ-FFR. We compared 270 coronary lesions with stenosis rates of 32-99%. IQ-FFR measurements were strongly correlated with the wire-derived FFR (r=0.896). In the prediction study, the clinical accuracy of predicting whether the FFR would be greater or less than 0.80 after stent implantation was 87.5%.
CONCLUSIONS: The IQ-FFR is a promising method to identify coronary lesions requiring revascularisation and to predict the FFR after stent implantation.
The use of fractional flow reserve (FFR) to identify coronary lesions that cause myocardial ischaemia and require revascularisation is widely accepted and recommended12. Intravascular ultrasound (IVUS) is widely used to evaluate the morphology and tissue components of coronary lesions during percutaneous coronary intervention (PCI)34. A limitation of conventional FFR is that it requires approximately 10 additional minutes of testing time compared with normal angiography due to the required use of adenosine 5-triphosphate (ATP), papaverine or nicorandil to induce hyperaemia. It is well known that optimisation of PCI using IVUS leads to better outcomes5. Therefore, we predict that the rate of PCI using IVUS will increase in the future. Recently, a method to estimate the FFR using morphological features measured by an imaging device such as IVUS and optical coherence tomography (OCT) was developed6. However, all the previously developed methods are conducted offline, and analysis takes approximately 10 minutes; acquiring measurements of FFR in a shorter time would provide an advantage. The aims of the present study were to develop an online system that can measure FFR in less than 1 minute using an IVUS quantitative method (IQ-FFR) and hydrodynamics theory and establish methods that can determine the area that requires treatment and the area of stent implantation simultaneously.
Methods
STUDY PROTOCOL
The present study was a prospective single-centre study consisting of a training study and a validation study (prediction study). First, we planned to collect data from 200 patients. The first two-thirds of the data were used for the training study, and the remaining one-third of the data were used for the validation study. In the training study, coronary lesions that met the following criteria were included: (1) presence of at least 1 stenosis using quantitative coronary angiography (25-99%); (2) both IVUS and FFR measurements performed just before and after PCI, in the case of PCI, or performed without PCI, in cases for which PCI was deferred; and (3) acquisition of clear images throughout the entire target coronary branch. IVUS imaging was performed using a 60 MHz mechanically rotating IVUS catheter (AltaView [Terumo]) with a pullback speed of 3 or 9 mm/sec. The FFR was measured by introducing a pressure wire into the far distal end of the coronary arteries with maximal hyperaemia by intravenous injection of ATP.
In the prediction study, coronary lesions that met the following criteria were prospectively included: (1) presence of 1 lesion that required stent implantation by evaluation using the wire-derived FFR, (2) both IVUS and FFR measurements performed just before and after stent implantation, (3) acquisition of clear images throughout the entire target coronary branch, and (4) stents implanted into 1 coronary artery. We calculated the IQ-FFR on the assumption that stents of arbitrary length and diameter were implanted. After stent implantation, the wire-derived FFR was compared with the calculated FFR, which was calculated by the IQ-FFR referring to the length and diameter of the stent.
Written informed consent was obtained from all patients. The protocol was approved by the institutional ethics committee of Gifu Heart Center (2021006) and registered in the University Hospital Medical Information Network (UMIN000046392). The trial was conducted in accordance with the principles of Good Clinical Practice and conformed to the principles outlined in the Declaration of Helsinki.
AUTOMATIC MEASUREMENT OF LUMEN CROSS-SECTIONAL AREAS AND DETECTION OF BRANCH POSITION BY A DEEP LEARNING PROGRAM
For the deep learning model (used for measurement of the lumen and external elastic membrane [EEM], and branch segmentation), we used U-Net (LMB, University of Freiburg, Freiburg, Germany), which is a convolutional neural network (CNN) model for semantic segmentation7. We adopted an approach in which the directory applied the Intersection over Union (IoU) metric in the optimisation of the neural network model8. The cases used for developing the deep learning algorithm were different from those that provided the data for the training study. Detailed methods are provided in Supplementary Appendix 1.
FFR DATA ACQUISITION
Measurement of the FFR was performed using a 0.014 inch pressure guidewire (PressureWire X [Abbott]; Verrata [Philips/Volcano]; and OptoWire [OpSens/Haemonetics]). The pressure guidewire was calibrated and advanced to the tip of the guiding catheter for equalisation of pressure signals. A distal coronary pressure/aortic pressure (Pd/Pa) value of 1.0 after stabilisation was mandatory. Maximal hyperaemia was induced by continuous intravenous infusion of adenosine 5-triphosphate at 150-180 μg/kg/min via the forearm vein. Subsequently, the pressure guidewire was slowly pulled back from the most distal to the proximal part of the artery during maximal hyperaemia. After the pressure sensor was pulled back to the tip of the guiding catheter, both pressures were checked to exclude any transducer drift. Pressure drift was defined as a difference in the Pd/Pa value of 1.00±0.02 after pullback to the guiding catheter.
HYDRODYNAMICS THEORY
First, we defined the first proximal reference area (Ap0) as the ostial region of the left main trunk (LMT) for the left coronary artery (LCA) or the ostial region of the right coronary artery (RCA). Next, the second proximal reference area (Ap1) was defined as the area just distal to the coronary branch5. We defined the coronary branch as the branch whose diameter was more than one-third of the main coronary artery at the site just distal to the branch. The volume of coronary flow was corrected by the law of conservation of mass (Flow volume1=Flow volume2). The distal reference areas (Ad1, 2, 3 ...) were defined as the maximum area of the region just after the lesion area. The stenotic flow reserve (SFR) in the same branch (same Api; i=0, 1, 2...) was calculated by adding the loss of pressure that was calculated with the following formula39101112.
When the vessel of the same reference area (Ap1, 2, 3 ...) had more than 2 stenoses, we summed the pressure loss of all the stenoses and calculated the SFRi for the blood. Therefore, an SFRi was individually given to each Api. ΔP=ΔPf+ΔPs+ΔPc
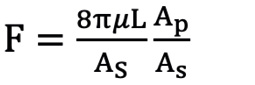
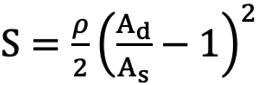
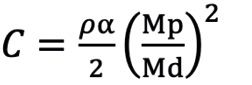
ΔPf=FV (pressure loss by friction at the lesion), ΔPs=SV2 (pressure loss by expansion after stenotic lesion), ΔPc=CV2 (pressure loss by contraction of branch site)
Where: V=velocity of coronary flow
Formule 1 μ: blood viscosity
Formule 2 Ad>As ρ: blood density
Formule 3 α≤0.5,Mp>Md
Ad: distal reference lumen area; As: lumen area of stenosis lesion; L: lesion length; Md: distal lumen area of branch; Mp: proximal lumen area of branch.
The final IQ-FFR was calculated by summing the loss of pressure in each lesion. When there are relatively large branches in the coronary artery, calculation of the FFR is not accurate with the previous method. Therefore, we added a third term (ΔPc) to calculate the loss in the branches as shown in the above formula10. A detailed calculation flow is provided in Supplementary Appendix 2. A prototype version for research was installed on a mobile PC, and the viewer was found to be easy to operate. The graphical user interface (GUI) is shown in Supplementary Figure 1. A schematic diagram for hydrodynamics theory is shown in the Central illustration.
Formule 1.
Formule 2.
Formule 3.
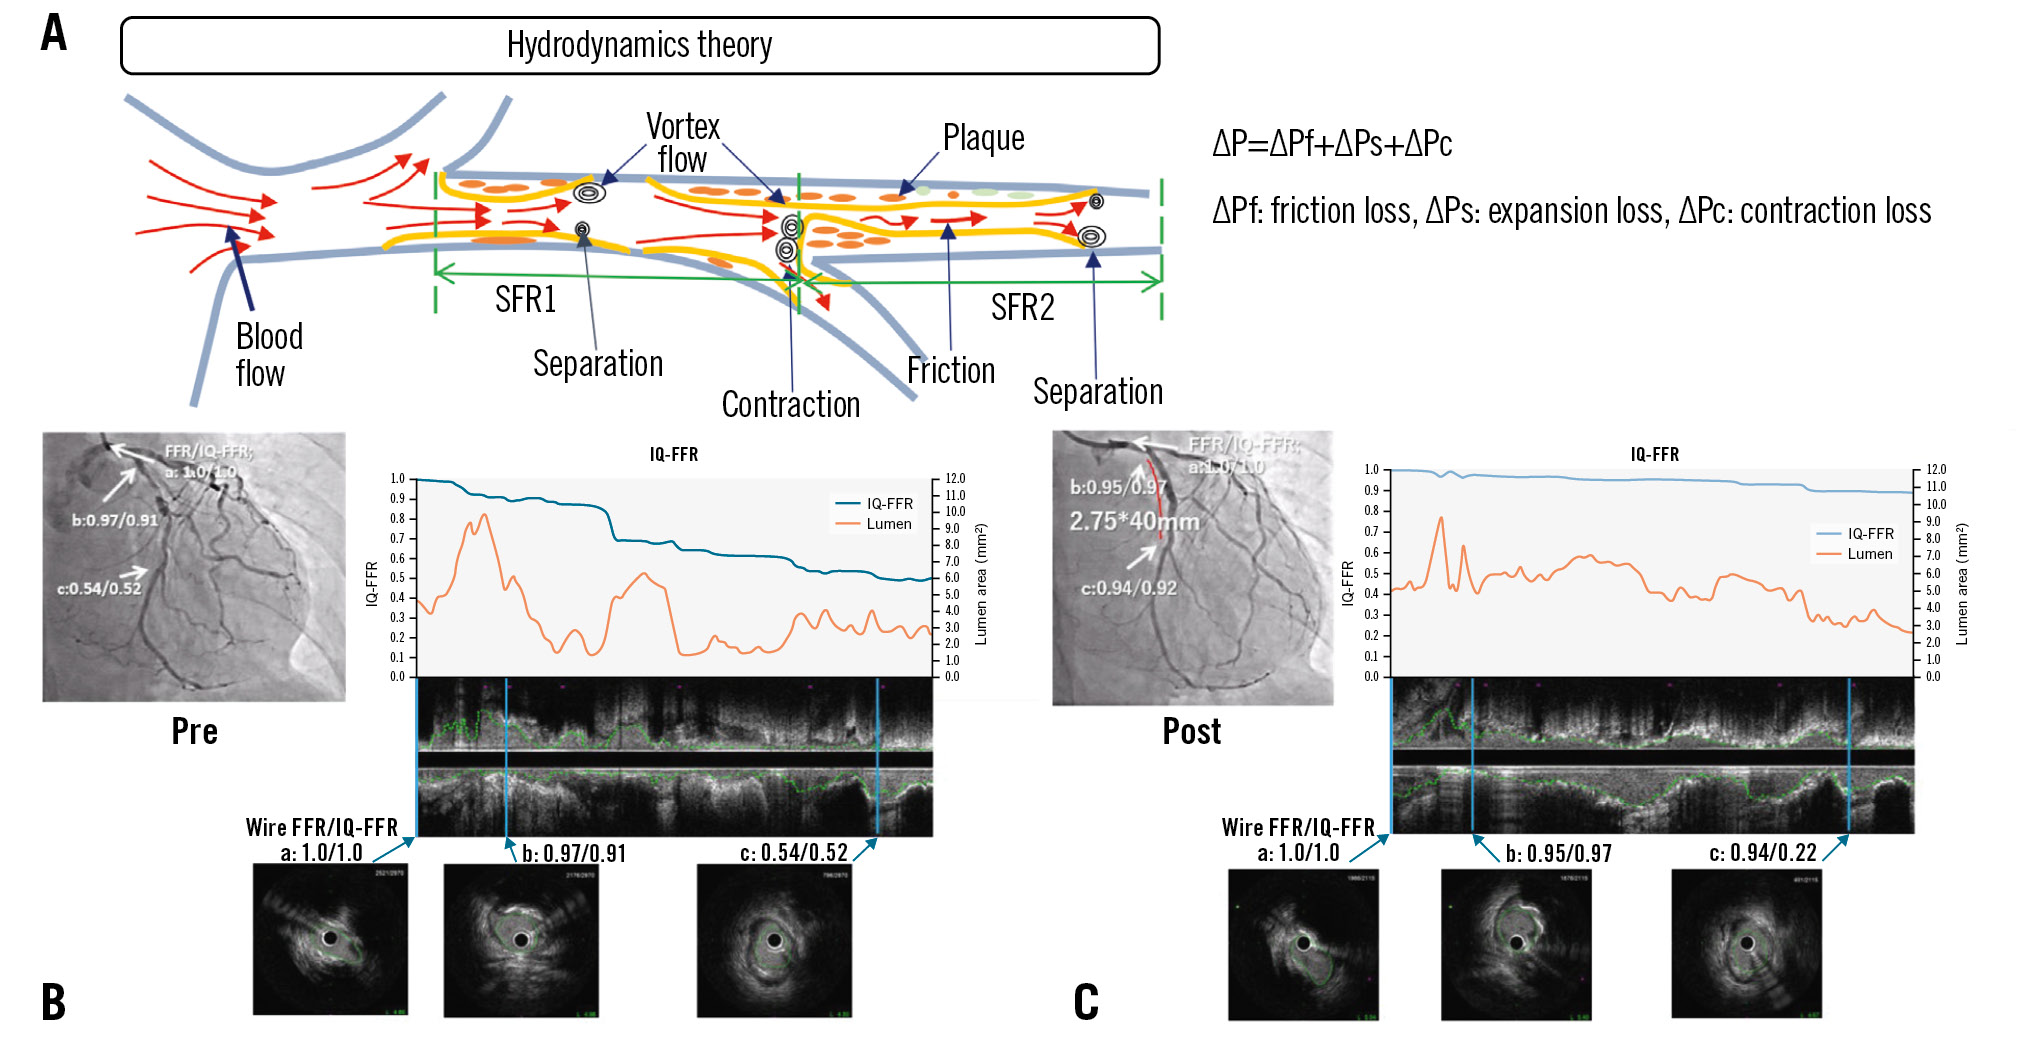
Central illustration. Prediction of fractional flow reserve using intravascular ultrasound. A) Schematic diagram for hydrodynamics theory. A stent (2.75mm x 40mm) was implanted for severe stenosis in the left circumflex artery (LCx). The results of the IQ-FFR and wire-derived FFR are shown before stent implantation (B) and after stent implantation (C). The wire-derived FFR and IQ-FFR values at the ostial (a), proximal (b) and distal (c) lesions were calculated. The graphs show IQ-FFR (blue) and lumen area (orange). The wire-derived FFR and IQ-FFR have a good correlation. FFR: fractional flow reserve; IQ-FFR: intravascular ultrasound quantitative fractional flow reserve; SFR: stenotic flow reserve
REPRODUCIBILITY AND RELIABILITY OF MEASUREMENTS
We determined the interobserver variability of the IQ-FFR using 55 randomly selected vessels that were measured by 2 observers in a blinded manner. Likewise, we determined the intraobserver variability of the IQ-FFR using 55 randomly selected vessels that were measured twice by 1 observer with a 7-day interval between the 2 measurements.
STATISTICAL ANALYSIS
Normality of distribution was tested using the Kolmogorov-Smirnov test. Normally distributed data are reported as mean±standard deviation. Categorical data are summarised as percentages and were compared using a chi-square test or Fisher’s exact test. The significance of the differences between groups that were normally distributed and had similar variances was tested by an unpaired Student’s t-test. Otherwise, the Mann-Whitney U test was used to compare the difference between groups. The IQ-FFR and wire-derived FFR were compared with linear regression analysis. Receiver operating characteristic (ROC) curve analysis was performed to determine the optimal cutoff values to identify a wire-derived FFR ≤0.80. The area under the curve (AUC) was used to evaluate clinical usefulness. Statistical analyses were performed using Microsoft Excel (Microsoft) and StatFlex, version 6.0 (Artech).
Results
ENROLLED PATIENTS AND TRAINING STUDY
We performed both IVUS and FFR measurements with a pressure wire in 216 consecutive patients. In 8 cases, far distal images of the coronary arteries were not appropriately obtained. In 2 cases, an image of just the ostial lesion of the LMT could not be obtained. In 2 cases, micro air bubbles in the IVUS catheter hindered the acquisition of clear images. However, in both cases, clear images were obtained after repriming with saline. The first two-thirds of the patients (n=142) were used for the training study. The remaining one-third of the patients (n=64) were used for the validation study (prediction study). Ultimately, we compared 270 coronary lesions with a stenosis rate of 32-99% in 206 patients (Figure 1). Patient characteristics are shown in Table 1. There were 3 cases that had stenosis (diameter <2 mm) at lesions just proximal to the RCA (n=2) and just proximal to the LMT (n=1). In these cases, the IQ-FFR was thought to vary because of a decrease in blood flow. In 1 RCA case, the wire-derived FFR was 0.39 and the IQ-FFR was 0.60. In another RCA case, the wire-derived FFR was 0.81 and the IQ-FFR was 0.84. In the LMT case, the wire-derived FFR was 0.46 and the IQ-FFR was 0.53.
In the training study, the IQ-FFR, measured by automatic measurement of the FFR by IVUS, was strongly correlated with the wire-derived FFR in all cases (n=142, r=0.849; p<0.001; LCA: n=90, r=0.833; p<0.001; RCA: n=52, r=0.877; p<0.001) (Figure 2A, Figure 2C, Figure 2D). The correlation between the minimum lumen area and the wire-derived FFR was not strong (n=142, r=0.691; p<0.001) (Figure 2B). We also compared the IQ-FFR by categorising the lesion length into long lesions (>median of 28.3 mm) and short lesions (≤median of 28.3 mm) (Figure 2E, Figure 2F) before stent implantation. We also compared the IQ-FFR and the wire-derived FFR among lesions with angiographically intermediate stenosis (51-75%). The IQ-FFR was strongly correlated with the wire-derived FFR in lesions with angiographically intermediate stenosis (n=108, r=0.761; p<0.001) as well as in all cases (n=142, r=0.849; p<0.001) (Figure 2G).
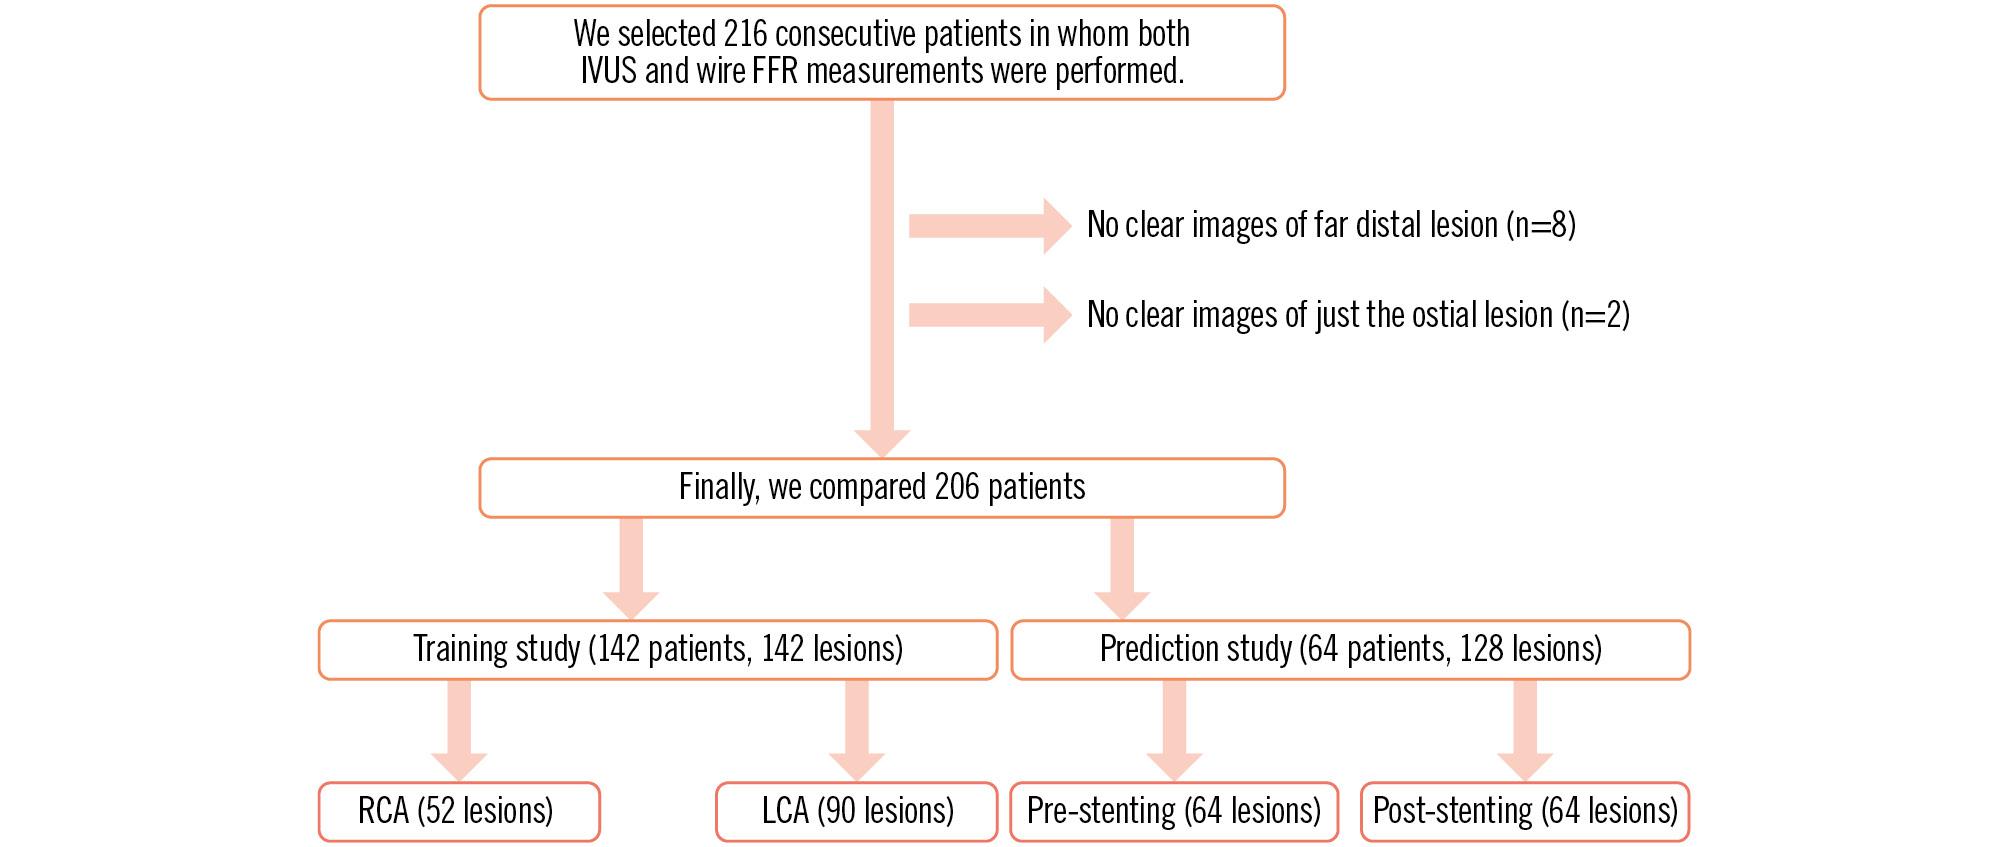
Figure 1. Study protocol. FFR: fractional flow reserve; IVUS: intravascular ultrasound; LCA: left coronary artery; RCA: right coronary artery
Table 1. Patient characteristics.
| Training study (n=142) | Prediction study (n=64) | p-value | |
|---|---|---|---|
| Age, years | 71.3±10.9 | 72.8±8.7 | 0.32 |
| Male | 109 (77) | 49 (77) | 0.98 |
| Body mass index, kg/m2 | 23.5±3.9 | 23.1±3.1 | 0.42 |
| Hypertension | 113 (80) | 47 (73) | 0.33 |
| Hyperlipidaemia | 78 (55) | 39 (61) | 0.42 |
| Diabetes mellitus | 61 (43) | 19 (30) | 0.071 |
| Smoker | 28 (20) | 13 (20) | 0.92 |
| Haemodialysis | 16 (11) | 4 (6) | 0.27 |
| Prior myocardial infarction | 25 (18) | 16 (25) | 0.23 |
| Coronary artery bypass graft | 9 (6) | 2 (3) | 0.34 |
| Lesion location | |||
| Left anterior descending branch | 59 (42) | 33 (52) | 0.13 |
| Left circumflex branch | 33 (23) | 6 (9) | |
| Left main trunk | 10 (7) | 5 (8) | |
| Right coronary artery | 40 (28) | 20 (31) | |
| Laboratory parameters | |||
| Total cholesterol, mg/dl | 168±30 | 169±35 | 0.86 |
| Triglycerides, mg/dl | 147±97 | 126±61 | 0.14 |
| HDL cholesterol, mg/dl | 52±18 | 56±15 | 0.17 |
| LDL cholesterol, mg/dl | 84±29 | 86±34 | 0.74 |
| Estimated GFR, ml/min/1.73 m2 | 56±27 | 63±19 | 0.024 |
| C-reactive protein, mg/dl | 0.28±0.56 | 0.29±0.65 | 0.92 |
| Lesion parameters | |||
| Stenosis rate, % | 64±13 | 65±14 | 0.71 |
| Target lesion length, mm | 23±11 | 22±10 | 0.62 |
| Reference diameter, mm | 2.84±0.54 | 2.76±0.57 | 0.35 |
| Preintervention MLD, mm | 1.00±0.40 | 0.98±0.41 | 0.73 |
| Post-intervention MLD, mm | 2.54±0.60 | 2.78±0.49 | 0.009 |
| Pre-FFR | 0.64±0.14 | 0.62±0.13 | 0.33 |
| Values are mean±standard deviation or n (%). FFR: fractional flow reserve; GFR: glomerular filtration rate; HDL: high-density lipoprotein; LDL: low-density lipoprotein; MLD: minimum lumen diameter | |||
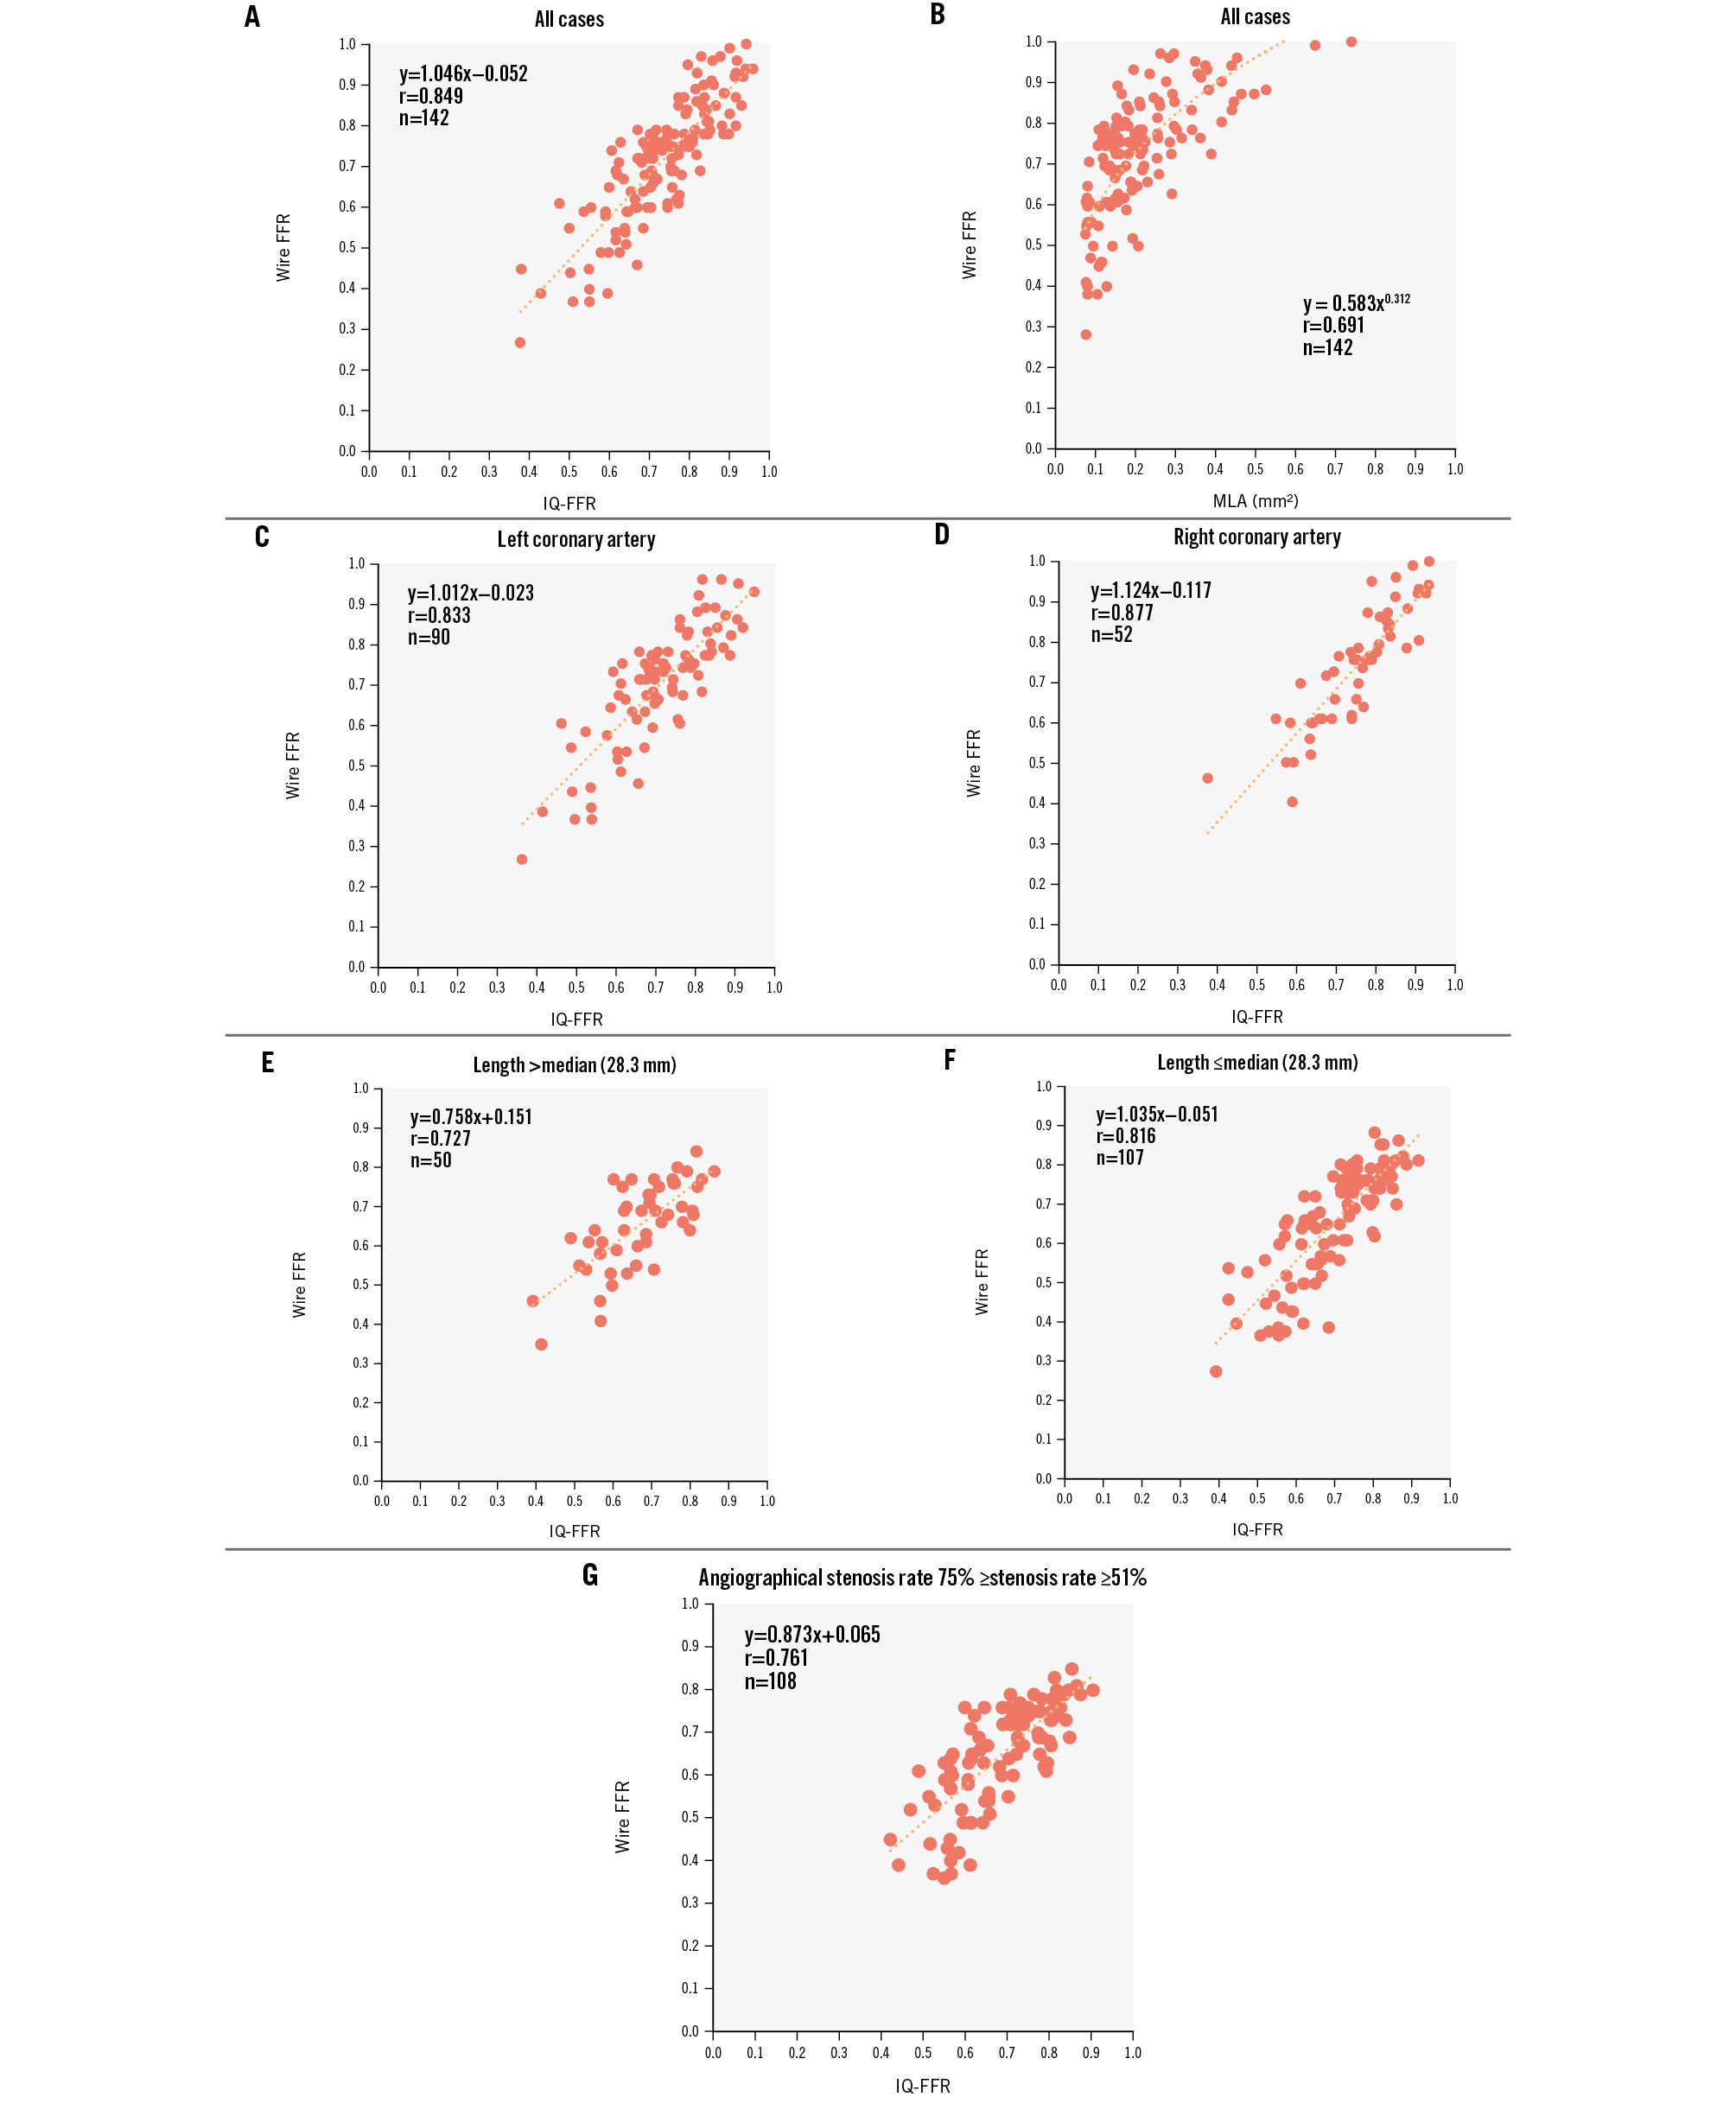
Figure 2. Relationship between the wire-derived FFR, IQ-FFR and MLA in the training study. A) Relationship between the wire-derived FFR and the IQ-FFR in the training study. B) Relationship between the wire-derived FFR and the MLA in the training study. C) Relationship between the wire-derived FFR and the IQ-FFR in the left coronary arteries. D) Relationship between the wire-derived FFR and the IQ-FFR in the right coronary arteries. E,F) Relationship between the wire-derived FFR and the IQ-FFR by categorising the lesion length (median: 28.3 mm). G) Relationship between the wire-derived FFR and the IQ-FFR in the lesions with angiographically intermediate stenosis (51-75%). FFR: fractional flow reserve; IQ-FFR: intravascular ultrasound quantitative fractional flow reserve; MLA: minimum lumen area
REPRODUCIBILITY AND RELIABILITY OF MEASUREMENTS
The interobserver correlation coefficient and mean difference with 95% limits of agreement for the IQ-FFR were 0.940 and 0.016±0.114, respectively. The intraobserver correlation coefficient and mean difference with 95% limits of agreement for the IQ-FFR were 0.959 and 0.006±0.093, respectively.
VALIDATION STUDY (PREDICTION STUDY)
In the prediction study, we calculated the IQ-FFR on the assumption that one stent was implanted with arbitrary length and diameter in 128 lesions (pre-stenting measurement: 64 lesions; post-stenting measurement: 64 lesions) of 64 patients. We measured the wire-derived FFR and IQ-FFR at the far distal pullback start position of the FFR wire by referring to the location of the side branches on the angiographic images on the main monitor. The IQ-FFR determined by the automatic measurement of the FFR by IVUS was strongly correlated with the wire-derived FFR (n=128, r=0.896; p<0.001) (Figure 3). In the post-stenting measurements, the correlation coefficient was moderate (r=0.600), because almost all FFR measurements were more than 0.8 after stent implantation. However, the clinical accuracy for predicting that the FFR after stent implantation would be more or less than 0.80 was 87.5% (95% confidence interval [CI]: 79.4-95.6%, 56/64 lesions).
Bland-Altman plots between the wire-derived FFR and the IQ-FFR after PCI in the prediction study are shown in Figure 3. The mean difference and 95% limits of agreement in the IQ-FFR was 0.010±0.149. Representative images are shown in Figure 4.
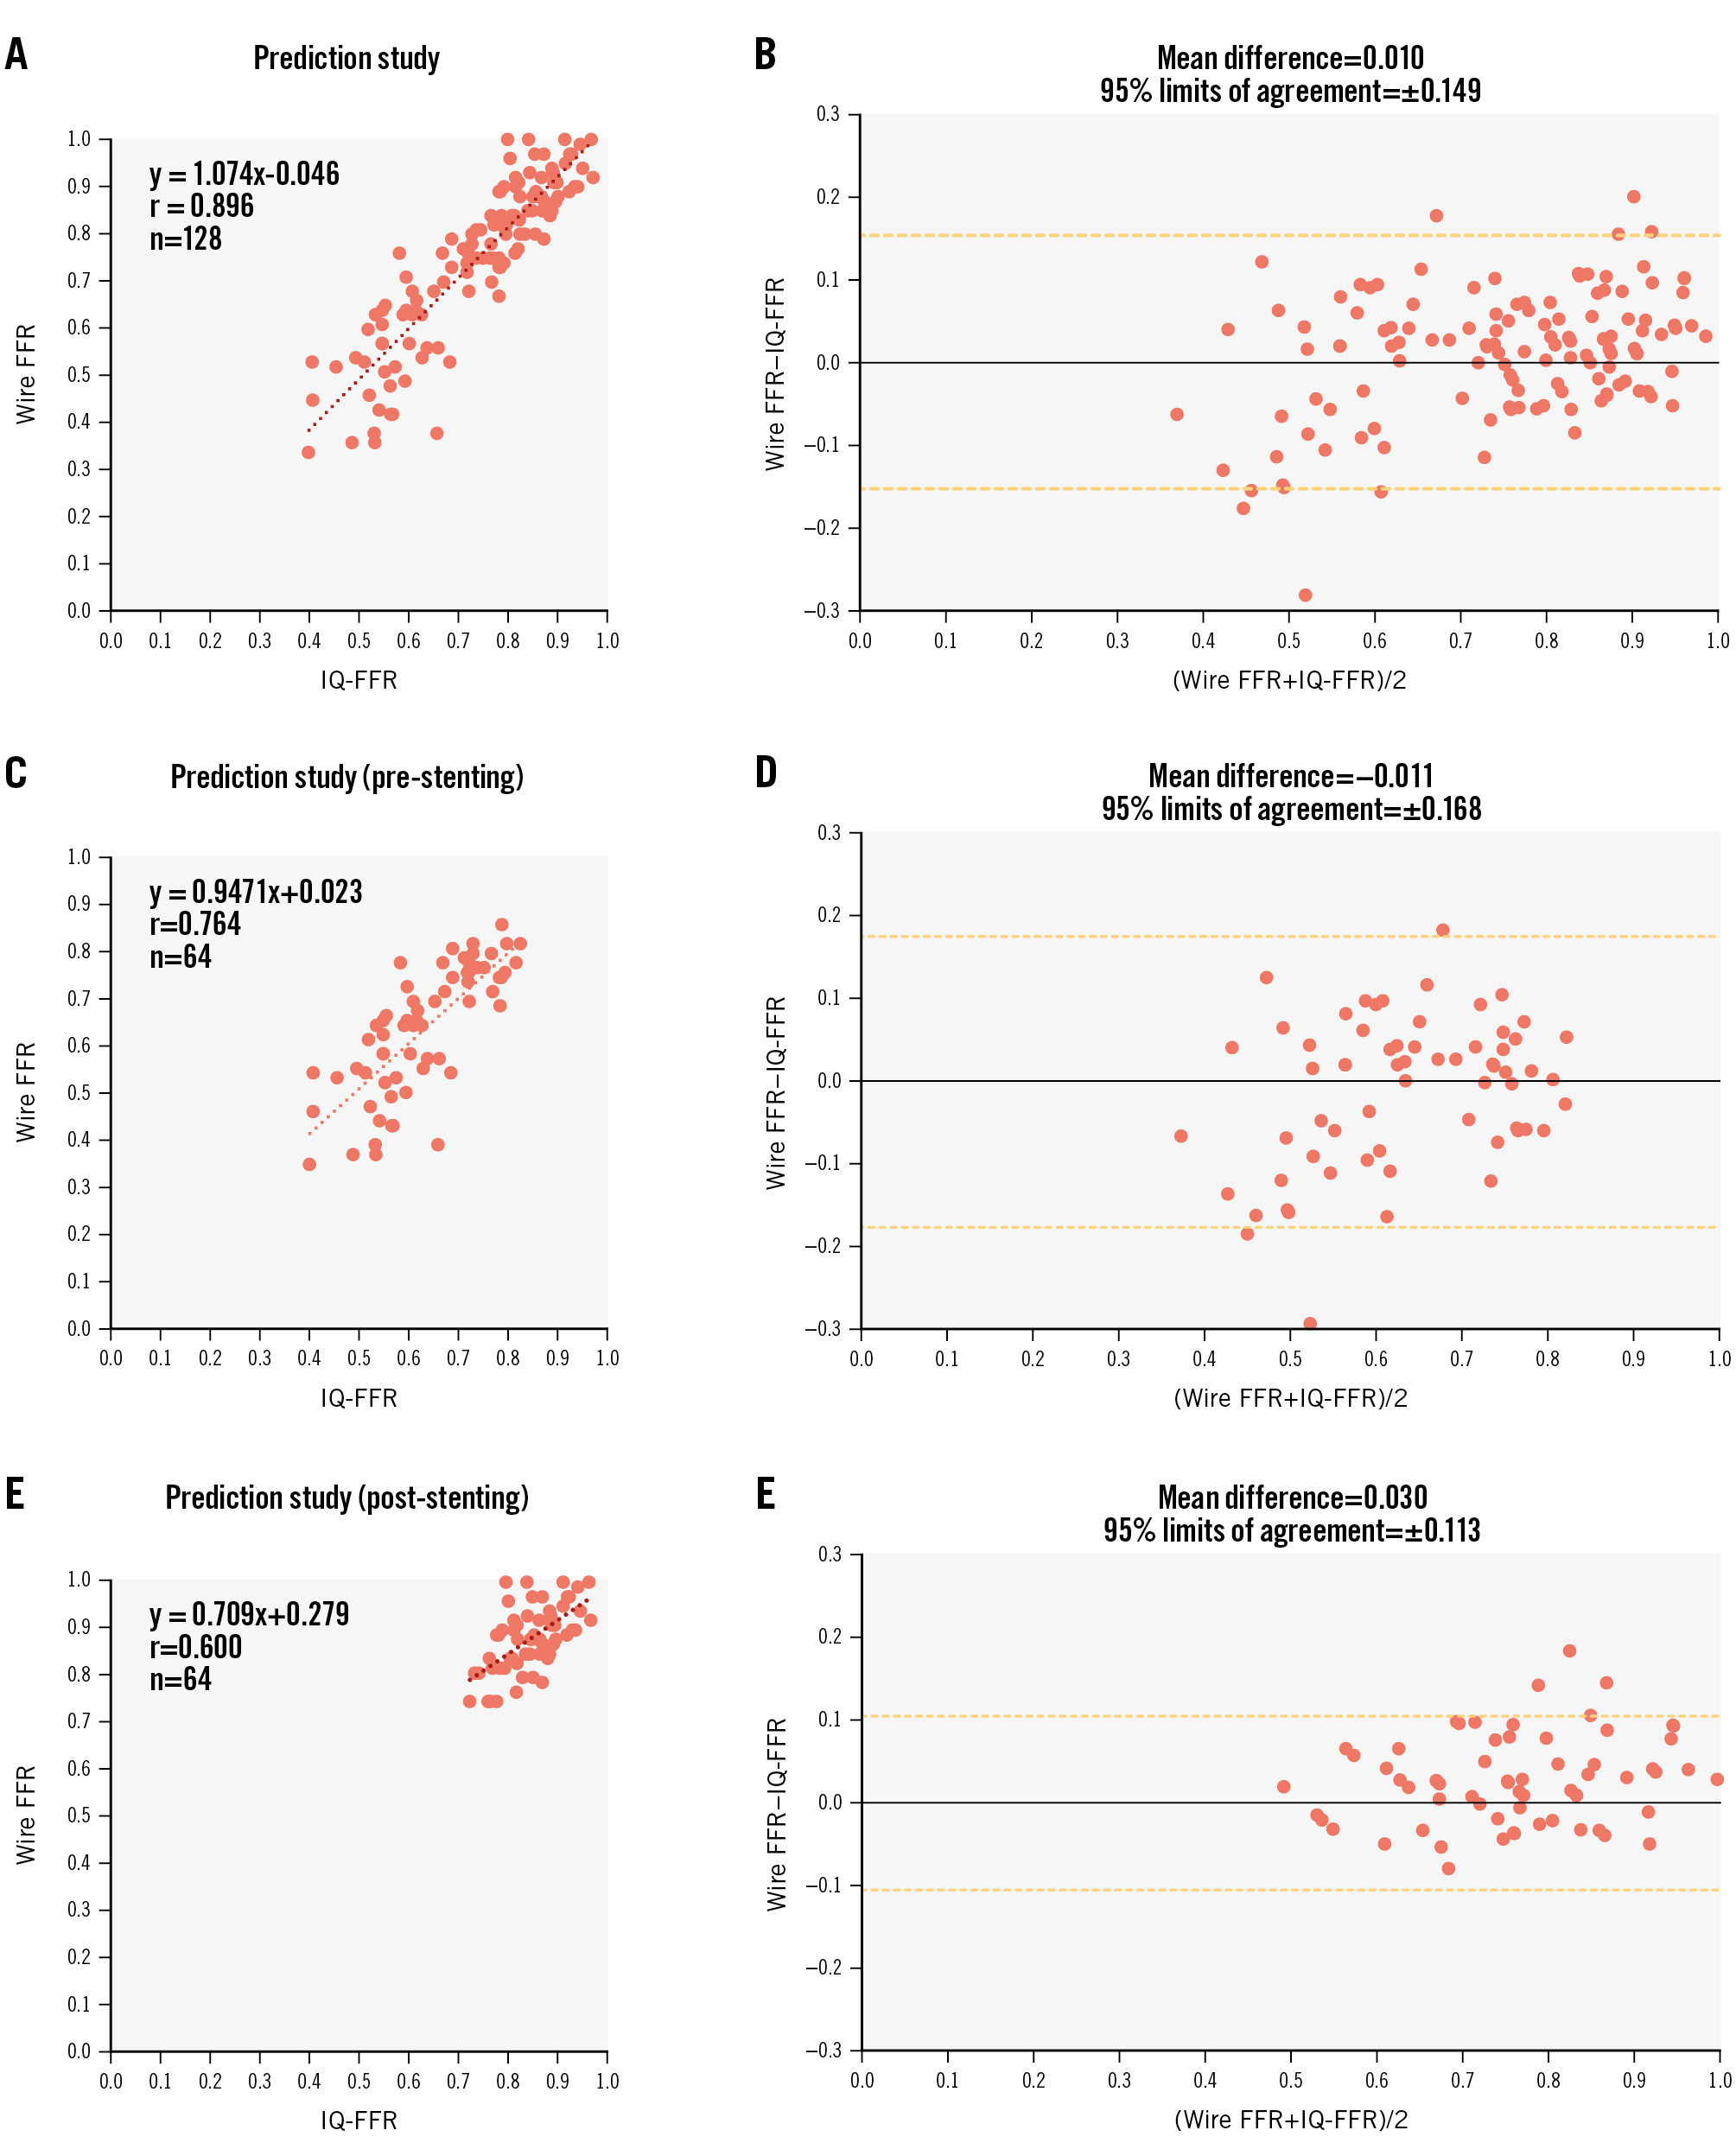
Figure 3. Relationship between the wire-derived FFR and the IQ-FFR before and after stent implantation in the prediction study. A) Relationship between the wire-derived FFR and the IQ-FFR before and after stent implantation in the prediction study. B) Bland-Altman plot before and after stent implantation. C) Relationship between the wire-derived FFR and the IQ-FFR before stent implantation. D) Bland-Altman plot before stent implantation. E) Relationship between the wire-derived FFR and the IQ-FFR after stent implantation. F) Bland-Altman plot after stent implantation. FFR: fractional flow reserve; IQ-FFR: intravascular ultrasound quantitative fractional flow reserve
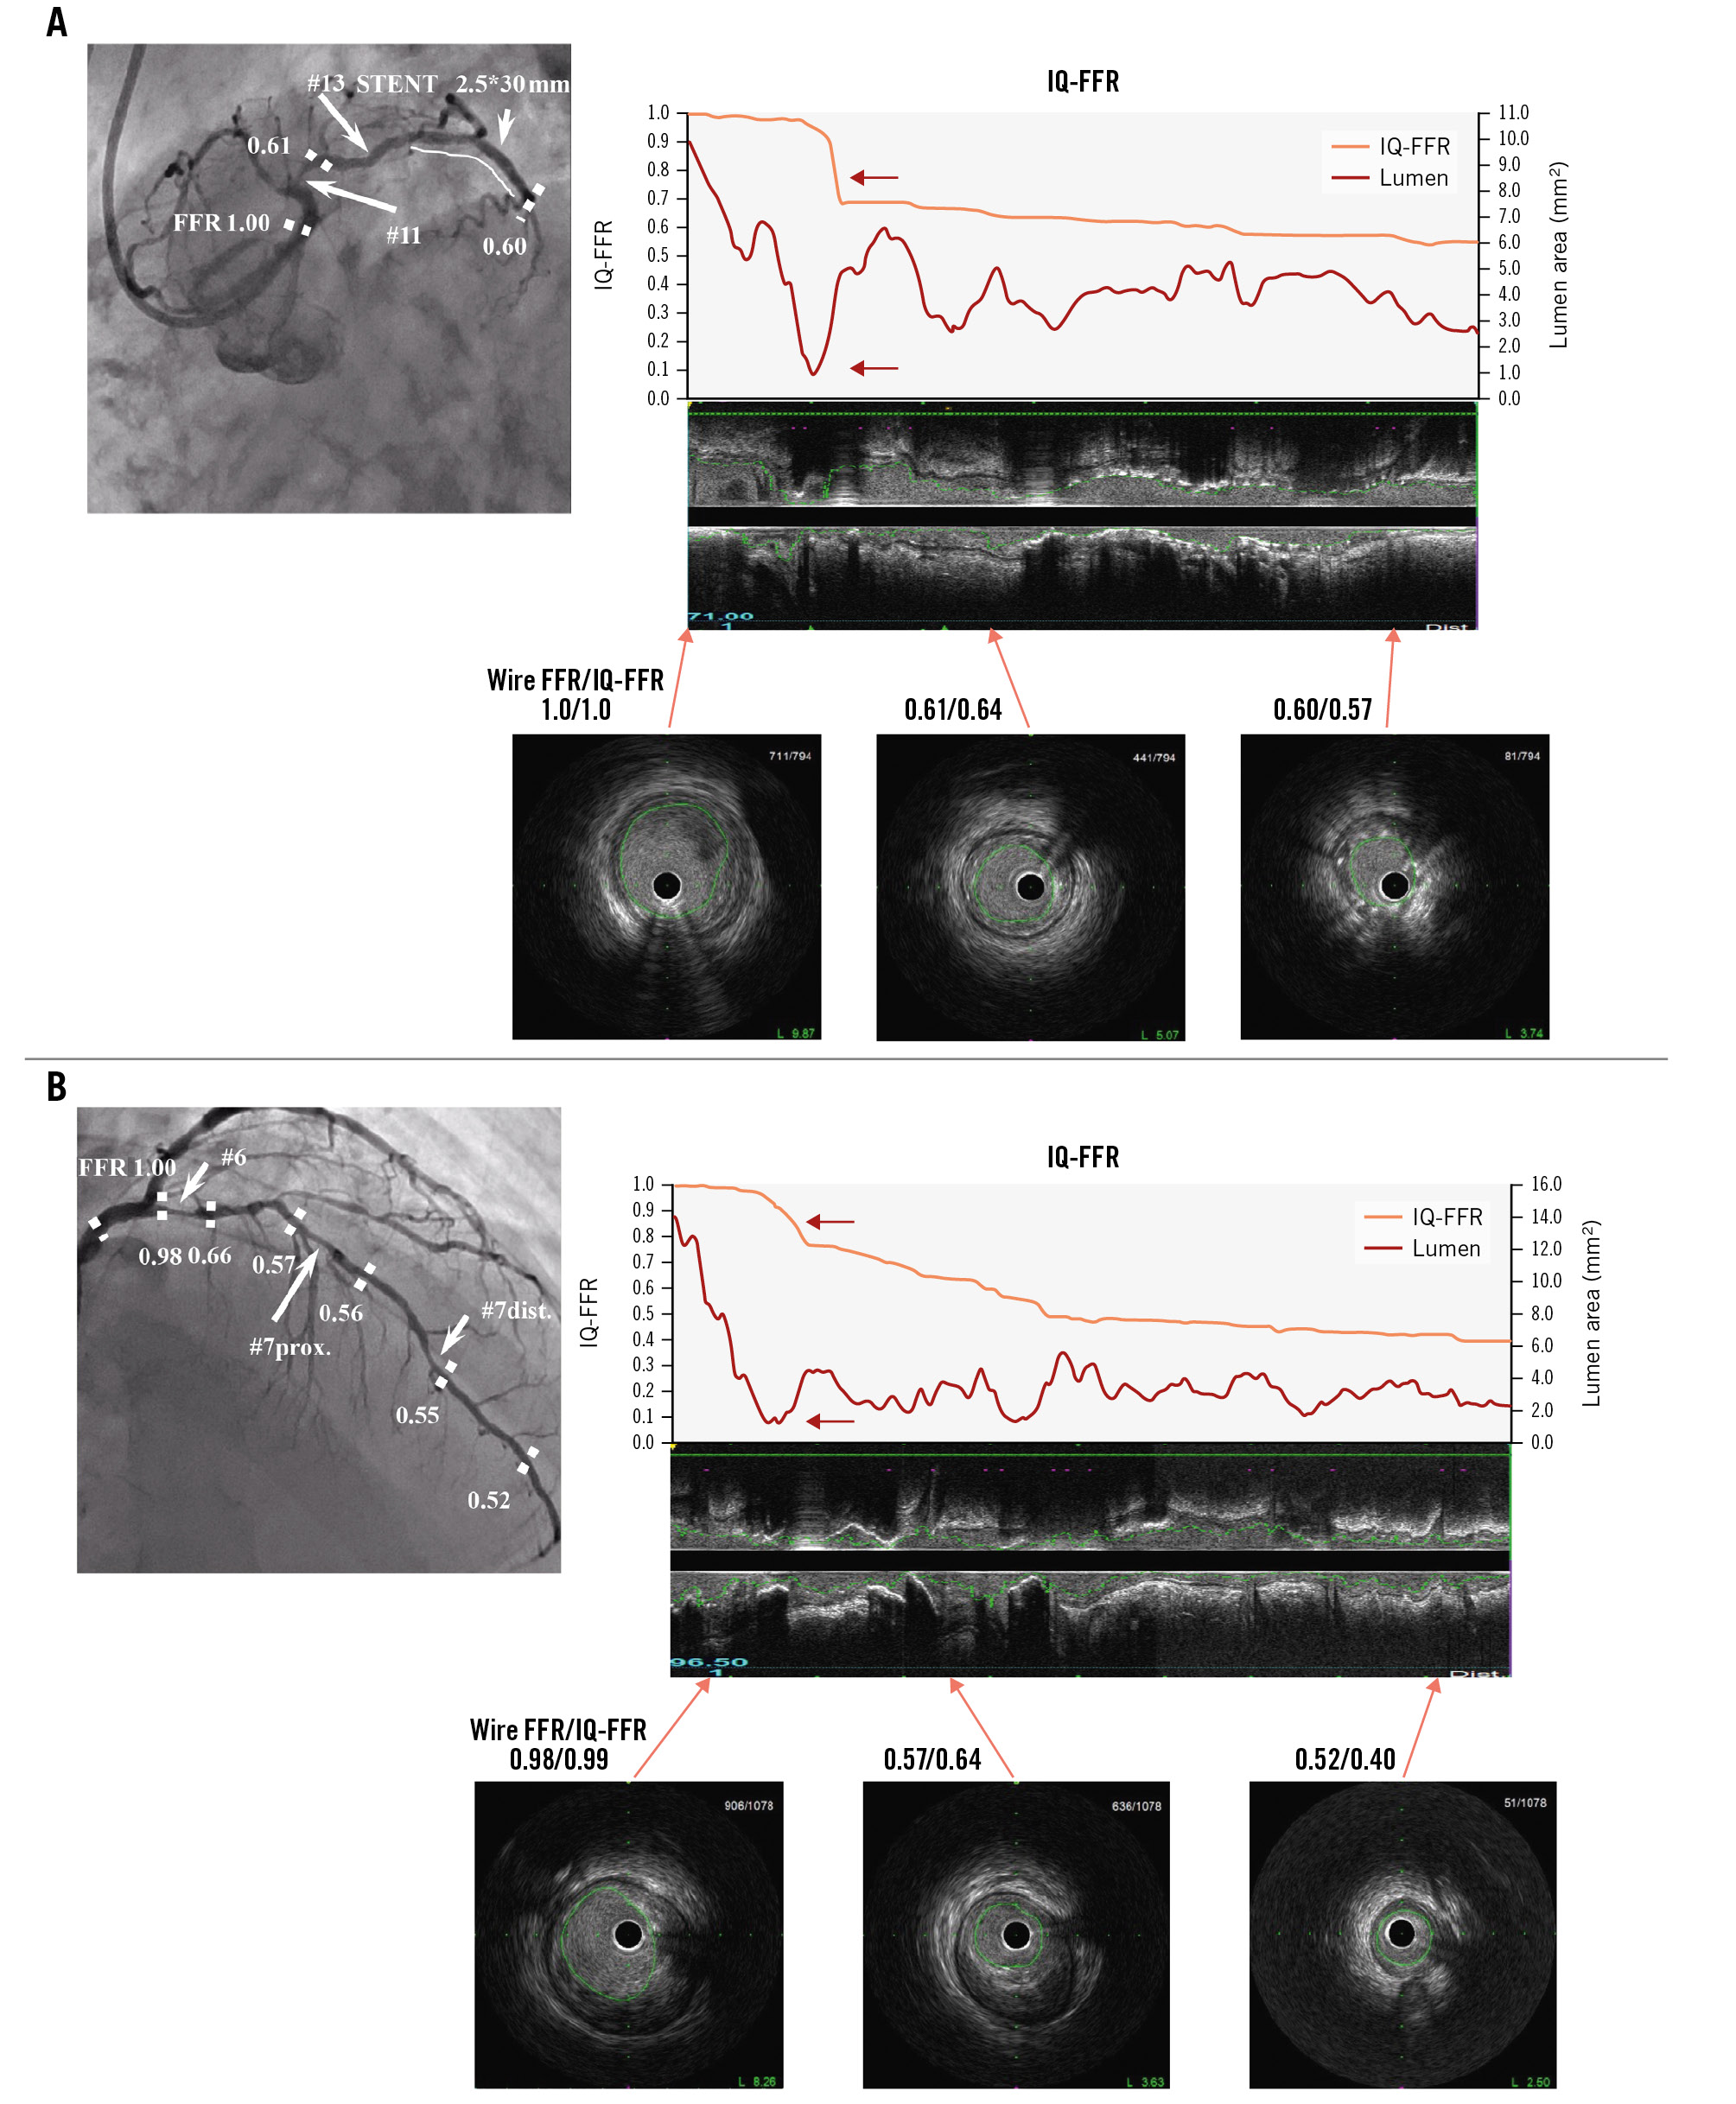
Figure 4. Representative images of coronary angiogram and intravascular ultrasound. A) Representative images of coronary angiogram and intravascular ultrasound in the case wherein the IQ-FFR decreased at one focal lesion (red arrow). Note that when the lumen area was less than 1.0 mm2, the IQ-FFR particularly decreased. The IVUS analysis system can automatically measure the cross-sectional area every 0.5 mm from the far distal end to the orifice of the coronary arteries. B) Representative images of coronary angiogram and intravascular ultrasound in the case wherein the IQ-FFR decreased gradually. Note that when the lumen area was less than 1.0 mm2, the IQ-FFR particularly decreased (red arrow). FFR: fractional flow reserve; IQ-FFR: intravascular ultrasound quantitative fractional flow reserve; IVUS: intravascular ultrasound
CLINICAL ACCURACY
In the prediction study, when the cutoff of the IQ-FFR was set at 0.80, the positive predictive value was 87% (95% CI:
81-93%), and the negative predictive value was 89% (95% CI: 84-94%) for a wire-derived FFR ≤0.80 (Figure 5). When the cutoff was set at 0.79, the positive predictive value was 90% (95% CI: 85-95%), and the negative predictive value was 86% (95% CI: 80-92%) for a wire-derived FFR ≤0.80. The AUC for the diagnosis of physiologically significant coronary stenosis was 0.95.
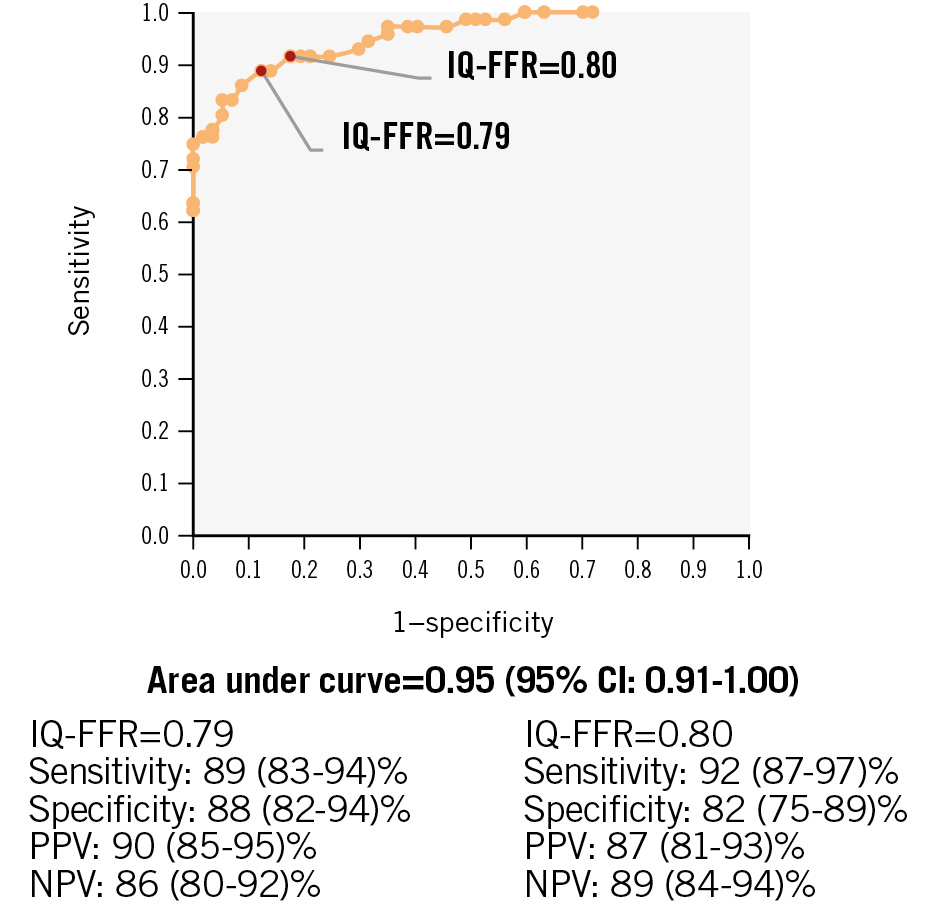
Figure 5. Receiver operating characteristic curves of the IQ-FFR for the prediction of FFR less than 0.8 by the wire-derived FFR. CI: confidence interval; FFR: fractional flow reserve; IQ-FFR: intravascular ultrasound quantitative FFR; NPV: negative predictive value; PPV: positive predictive value
Discussion
In the present study, we developed an online FFR measurement method using automatic measurement of the lumen area by IVUS and hydrodynamics theory. We called this value the IQ-FFR. In addition, we evaluated the clinical accuracy of our method. In the training study, IQ-FFR determined by the automatic measurement of the FFR by IVUS was strongly correlated with the wire-derived FFR (n=142, r=0.849; p<0.001). In the prediction study (validation study), the FFR predicted by the IQ-FFR method before and after stent implantation was strongly correlated with the wire-derived FFR (r=0.896). In the post-stenting measurements, clinical usefulness was proved by prediction of the FFR using the IQ-FFR.
In previous studies, patients who had severe systolic dysfunction, hypertrophic cardiomyopathy, severe left ventricular hypertrophy, significant valvular disease, an infarct-related artery, an LMT-LCA true bifurcation lesion, a lesion with length >60 mm in the LCA, a target vessel implanted with ≥2 stents, or severe respiratory disease with home oxygen therapy were excluded13. Although consecutive patients, even with those conditions, were included in the present study, the IQ-FFR measured by automatic measurement of the FFR by IVUS was strongly correlated with the wire-derived FFR. This means that it is possible to calculate the IQ-FFR using only the morphological information obtained by IVUS.
NOVEL HYDRODYNAMICS THEORY
We employed hydrodynamics theory in order to measure the amount of pressure loss for every 0.5 mm of lesion. Therefore, we were able to calculate the IQ-FFR of long lesions throughout the coronary artery, even lesions with diffuse stenosis and/or multiple stenoses, as shown in Figure 4B. Using this theory, we were able to determine which size stent we should implant and where. Then, we also predicted the IQ-FFR after stent implantation to the previously determined lesion by determining stent diameter and length.
In addition, pressure loss by contraction of the branch site was included in the calculation of the IQ-FFR; thus, we can evaluate the IQ-FFR in the branch site using the present method. Therefore, it is possible to apply the present method to OCT, coronary computed tomography and angiography when we can obtain data regarding the area of the coronary lumen and branch. Compared with other previous studies, we added pressure loss by “contraction of the branch site” to calculate the IQ-FFR. Therefore, we can even calculate the IQ-FFR at diffuse lesions and/or long lesions. Also, we can calculate the IQ-FFR at the site of bifurcation of lesions. In the previous study, it took approximately 10 minutes to calculate the FFR. However, we can obtain the IQ-FFR online within several seconds after confirming the lumen area and the branch diameter in the catheter laboratory. When manual corrections of the lumen trace and branch dimension were needed, a few minutes were needed to obtain the IQ-FFR. Detailed data are provided in Supplementary Appendix 3. The AUC to evaluate the FFR with our method (AUC=0.95) was similar to the angiography-derived FFR (AUC=0.75)14, and the calculation time was faster than the previous method.
PREDICTION OF THE FFR AFTER STENT IMPLANTATION
Using the present method, we can predict the IQ-FFR after stent implantation by inputting the length, diameter and position of the stents. The predicted IQ-FFR was correlated with the wire-derived FFR obtained after stent implantation. No study has predicted the FFR by substitutional catheter-based methods after stent implantation. Our prediction study demonstrated that we could predict the FFR in the lesion of stent implantation after determining the size and length of the stent. This method enabled appropriate determination of the stent size and length just before stent implantation.
COMPARISON WITH WIRE-DERIVED FFR
In recent years, the implementation of ischaemia evaluation using wire-derived FFR has become a Class Ia recommendation for judging the indication of PCI, and it has also been shown that the prognosis of FFR-guided PCI is better than that of angio-guided PCI15. The difference between basic wire-derived FFR and IQ-FFR are the following. 1) IQ-FFR does not require hyperaemia.
2) Since IQ-FFR is evaluated from anatomical information, it is easy to determine stent size using IVUS information.
3) It is possible to predict FFR after PCI. It is suggested that the greatest advantage of IQ-FFR is that it is possible to determine both the lesion requiring treatment and the stent size at the same time with a single pullback.
COMPARISON WITH PREVIOUS STUDIES
A recent meta-analysis of 147 studies compared the wire-derived FFR with the FFR that was virtually evaluated by angiography, IVUS and OCT13. According to that meta-analysis, the AUC in the diagnosis of physiologically significant coronary stenosis tended to be greater with the FFR measured by IVUS than that measured by angiography and OCT. Therefore, evaluation of the FFR by substitute methods may be more useful with IVUS than angiography and OCT. In addition, only 11% of the studies included more than 200 patients, and 10% of the studies were performed prospectively13. In the present study, we prospectively evaluated more than 200 patients.
Seike et al reported that the OCT-derived FFR showed a stronger linear correlation with the wire-derived FFR (r=0.89; p<0.001) in a small study (n=31)16. Another study that compared OCT-derived FFR and wire-derived FFR showed a linear correlation (r=0.72; p<0.001)17. Seike et al also reported that the IVUS-derived FFR showed a stronger linear correlation with the wire-derived FFR (r=0.78; p<0.001) in 50 lesions3. Our research team previously reported that the ultrasonic flow ratio had a strong correlation with the wire-derived FFR (r=0.87; p<0.001) in 167 lesions of 94 patients18. However, the present technique using an online IVUS quantitative method and hydrodynamics theory showed a greater correlation coefficient (r=0.896; p<0.001) and higher clinical accuracy.
The previous study of Seike et al was limited by the fact that diffuse lesions and ostial lesions could not be measured, and the IVUS-derived FFR of lesions with large side branches and diffuse lesions did not match the wire-derived FFR5. In the method reported by Yu et al, the pressure loss was determined using a fixed flow velocity of 35 cm/sec at maximum hyperaemia; therefore, the extent to which it was affected by myocardial perfusion was not taken into consideration. In addition, EEM measurement, which requires additional time for automatic tracing and correction, was required, because reference sites and branches were almost normal sites18. The present method considered the influence of the lesion on myocardial perfusion and calculated IQ-FFR using only the lumen area.
Limitations
The present study had several limitations. First, when there was a severe stenosis at the site of the lesions just proximal to the RCA or LMT, variation in the results was overestimated because of the loss of blood flow to the coronary arteries. Second, when images of just the ostial lesion of the RCA and LMT could not be obtained, calculation of the IQ-FFR was not possible. Third, when the diameter of the coronary lumen was smaller than that of the IVUS catheter (<0.87 mm), the IQ-FFR was overestimated, because the diameter of the coronary lumen (0.87 mm) was used in the calculation of the IQ-FFR. Fourth, we measured the IQ-FFR at the position where we stopped the pullback of the FFR wire by referring to the location of the side branches on the monitor. The detailed method is provided in Supplementary Appendix 4. However, there may be a difference of about 1 millimetre between the start position of the wire-derived FFR and the IQ-FFR measurement, because wire-derived FFR measurements were performed without contrast injection. Fifth, when blood flow at the site of the lesions just proximal to the RCA or LMT decreased except for coronary stenosis such as in aortic valve regurgitation, the IQ-FFR might have been overestimated. Sixth, we did not analyse the area of the EEM, because our method does not require it to calculate the IQ-FFR. However, evaluating the area of the EEM is important for measuring plaque burden and improving long-term clinical outcomes after stent implantation15. We determined the stent position and size using the conventional IVUS method. Based on these determinations, the FFR values were predicted by the IQ-FFR, and the predicted IQ-FFR was compared with the wire-derived FFR after stent implantation. We focused on lesions that achieved improved FFR values more efficiently after stent implantation, as opposed to lesions that achieved improved long-term clinical outcomes. Seventh, we did not analyse IVUS data collected with different probes (i.e., phased array, high resolution and 40 MHz rotational IVUS). It is not known whether the present method is applicable to different probes. Further analyses using different probes are needed. Finally, we enrolled a relatively small number of patients, therefore, the study may have been underpowered for statistical analyses. A long-term multicentre study in a larger population is needed to evaluate the clinical usefulness of the present technique.
Conclusions
Online measurement of the FFR using an IVUS quantitative method and hydrodynamics theory is a promising method to identify coronary lesions that require revascularisation. The IQ-FFR is also useful for the evaluation of the FFR after stent implantation and appropriate determination of stent size and length just before stent implantation.
Impact on daily practice
Online measurement of the fractional flow reserve (FFR) using an intravascular ultrasound quantitative method (IQ-FFR) and hydrodynamics theory is a novel method that has the potential to predict the FFR after percutaneous coronary intervention in only a few seconds, and several minutes may be enough to achieve the final results for the manual correction of the mean number of 7 frames. The IQ-FFR is useful for the evaluation of the FFR after stent implantation and for the appropriate determination of stent size and length just before stent implantation.
Conflict of interest statement
The authors have no conflicts of interest to declare.
Supplementary data
To read the full content of this article, please download the PDF.