Abstract
BACKGROUND: Vessel-level physiological data derived from pressure wire measurements are one of the important determinant factors in the optimal revascularisation strategy for patients with multivessel disease (MVD). However, these may result in complications and a prolonged procedure time.
AIMS: The feasibility of using the quantitative flow ratio (QFR), an angiography-derived fractional flow reserve (FFR), in Heart Team discussions to determine the optimal revascularisation strategy for patients with MVD was investigated.
METHODS: Two Heart Teams were randomly assigned either QFR- or FFR-based data of the included patients. They then discussed the optimal revascularisation mode (percutaneous coronary intervention [PCI] or coronary artery bypass grafting [CABG]) for each patient and made treatment recommendations. The primary endpoint of the trial was the level of agreement between the treatment recommendations of both teams as assessed using Cohen’s kappa.
RESULTS: The trial included 248 patients with MVD from 10 study sites. Cohen’s kappa in the recommended revascularisation modes between the QFR and FFR approaches was 0.73 [95% confidence interval {CI} : 0.62-0.83]. As for the revascularisation planning, agreements in the target vessels for PCI and CABG were substantial for both revascularisation modes (Cohen’s kappa=0.72 [95% CI: 0.66-0.78] and 0.72 [95% CI: 0.66-0.78], respectively). The team assigned to the QFR approach provided consistent recommended revascularisation modes even after being made aware of the FFR data (Cohen’s kappa=0.95 [95% CI:0.90-1.00]).
CONCLUSIONS: QFR provided feasible physiological data in Heart Team discussions to determine the optimal revascularisation strategy for MVD. The QFR and FFR approaches agreed substantially in terms of treatment recommendations.
Personalised medicine emphasises the importance of treatment decision-making based on individual risks1. In patients with multivessel disease (MVD) requiring revascularisation, an appropriate revascularisation mode (percutaneous coronary intervention [PCI] or coronary artery bypass grafting [CABG]) should be considered. Multidisciplinary Heart Teams are essential for determining the optimal treatment strategy. In Heart Team discussions, the SYNTAX score (SS) is a crucial decision aid, as it is a risk assessment tool dedicated to patients with MVD that considers individual coronary anatomy2. The latest iteration of the SS (SYNTAX score II 2020 [SSII]) considers the patient’s clinical characteristics, such as age and comorbidities, in addition to coronary anatomy, and provides 5- and 10-year prognostic estimates for each revascularisation mode3. These estimates can be fundamental for decision-making during Heart Team discussions.
The functional SYNTAX score (FSS), which scores only physiologically significant lesions, is another approach for improving the prognostic accuracy of the SS. The FSS, based on wire-derived fractional flow reserve (FFR), reportedly yielded better risk stratification than the anatomical SS scoring lesions with a visually estimated diameter stenosis of ≥50%4. However, implementing the FFR-based FSS may pose practical challenges, because multivessel interrogations of FFR induce the potential risk of wire-related complications and excess procedure time. Recently, angiography-derived FFR, an FFR simulation derived from angiography, has emerged with the outstanding advantages of not requiring a pressure wire or pharmacological hyperaemia56. With these advantages, angiography-derived FFR can potentially address wire-related issues in FSS calculations. The quantitative flow ratio (QFR) (Medis Medical Imaging Systems) is the first European Conformity (CE)- marked angiography-derived FFR whose diagnostic performance has been well confirmed7. In a post hoc analysis of the SYNTAX II trial, the FSS based on QFR (FSSQFR) demonstrated better prognostic capability than the anatomical SS for predicting 2-year patient-oriented cardiovascular events8. However, the feasibility of using QFR as physiological data for Heart Team decision-making has not been investigated. The current trial aimed to evaluate the feasibility of using QFR, including the FSSQFR and FSSQFR-based SSII (SSIIQFR), in Heart Team discussions to decide on the treatment of patients with MVD.
Methods
STUDY DESIGN
The DECISION QFR (The DEtermination of the appropriate proCedure of revascularization In the multidisciplinary Heart Team discusSION based on Quantitative Flow Ratio) trial was a prospective, multicentre, randomised controlled trial that aimed to investigate the feasibility of using QFR-based physiological data in decision-making for optimal treatment during Heart Team discussions. The trial included patients with MVD who required revascularisation (PCI or CABG). The detailed rationale and design of this trial have been previously published9. In the trial, two Heart Teams were randomly assigned to the patient data based on either the QFR (QFR approach) or FFR (FFR approach). Our primary hypothesis was that there would be a high level of agreement in treatment recommendations made based on QFR or FFR data (Figure 1). All patients were assessed by both Heart Teams.
Each Heart Team examined the patient data, including blinded physiological data. QFR data for each patient included QFR values in each vessel, FSSQFR and SSIIQFR. The FFR data for each patient included the FFR values in each vessel, FSSFFR and SSIIFFR. Heart Team members were randomly assigned to either the QFR or FFR approach using an adaptive randomisation approach in a web-based randomisation module. The research ethics committee of each participating institution approved the study protocol. All enrolled patients provided written informed consent. This trial was registered with the University Hospital Medical Information Network (UMIN000040475).
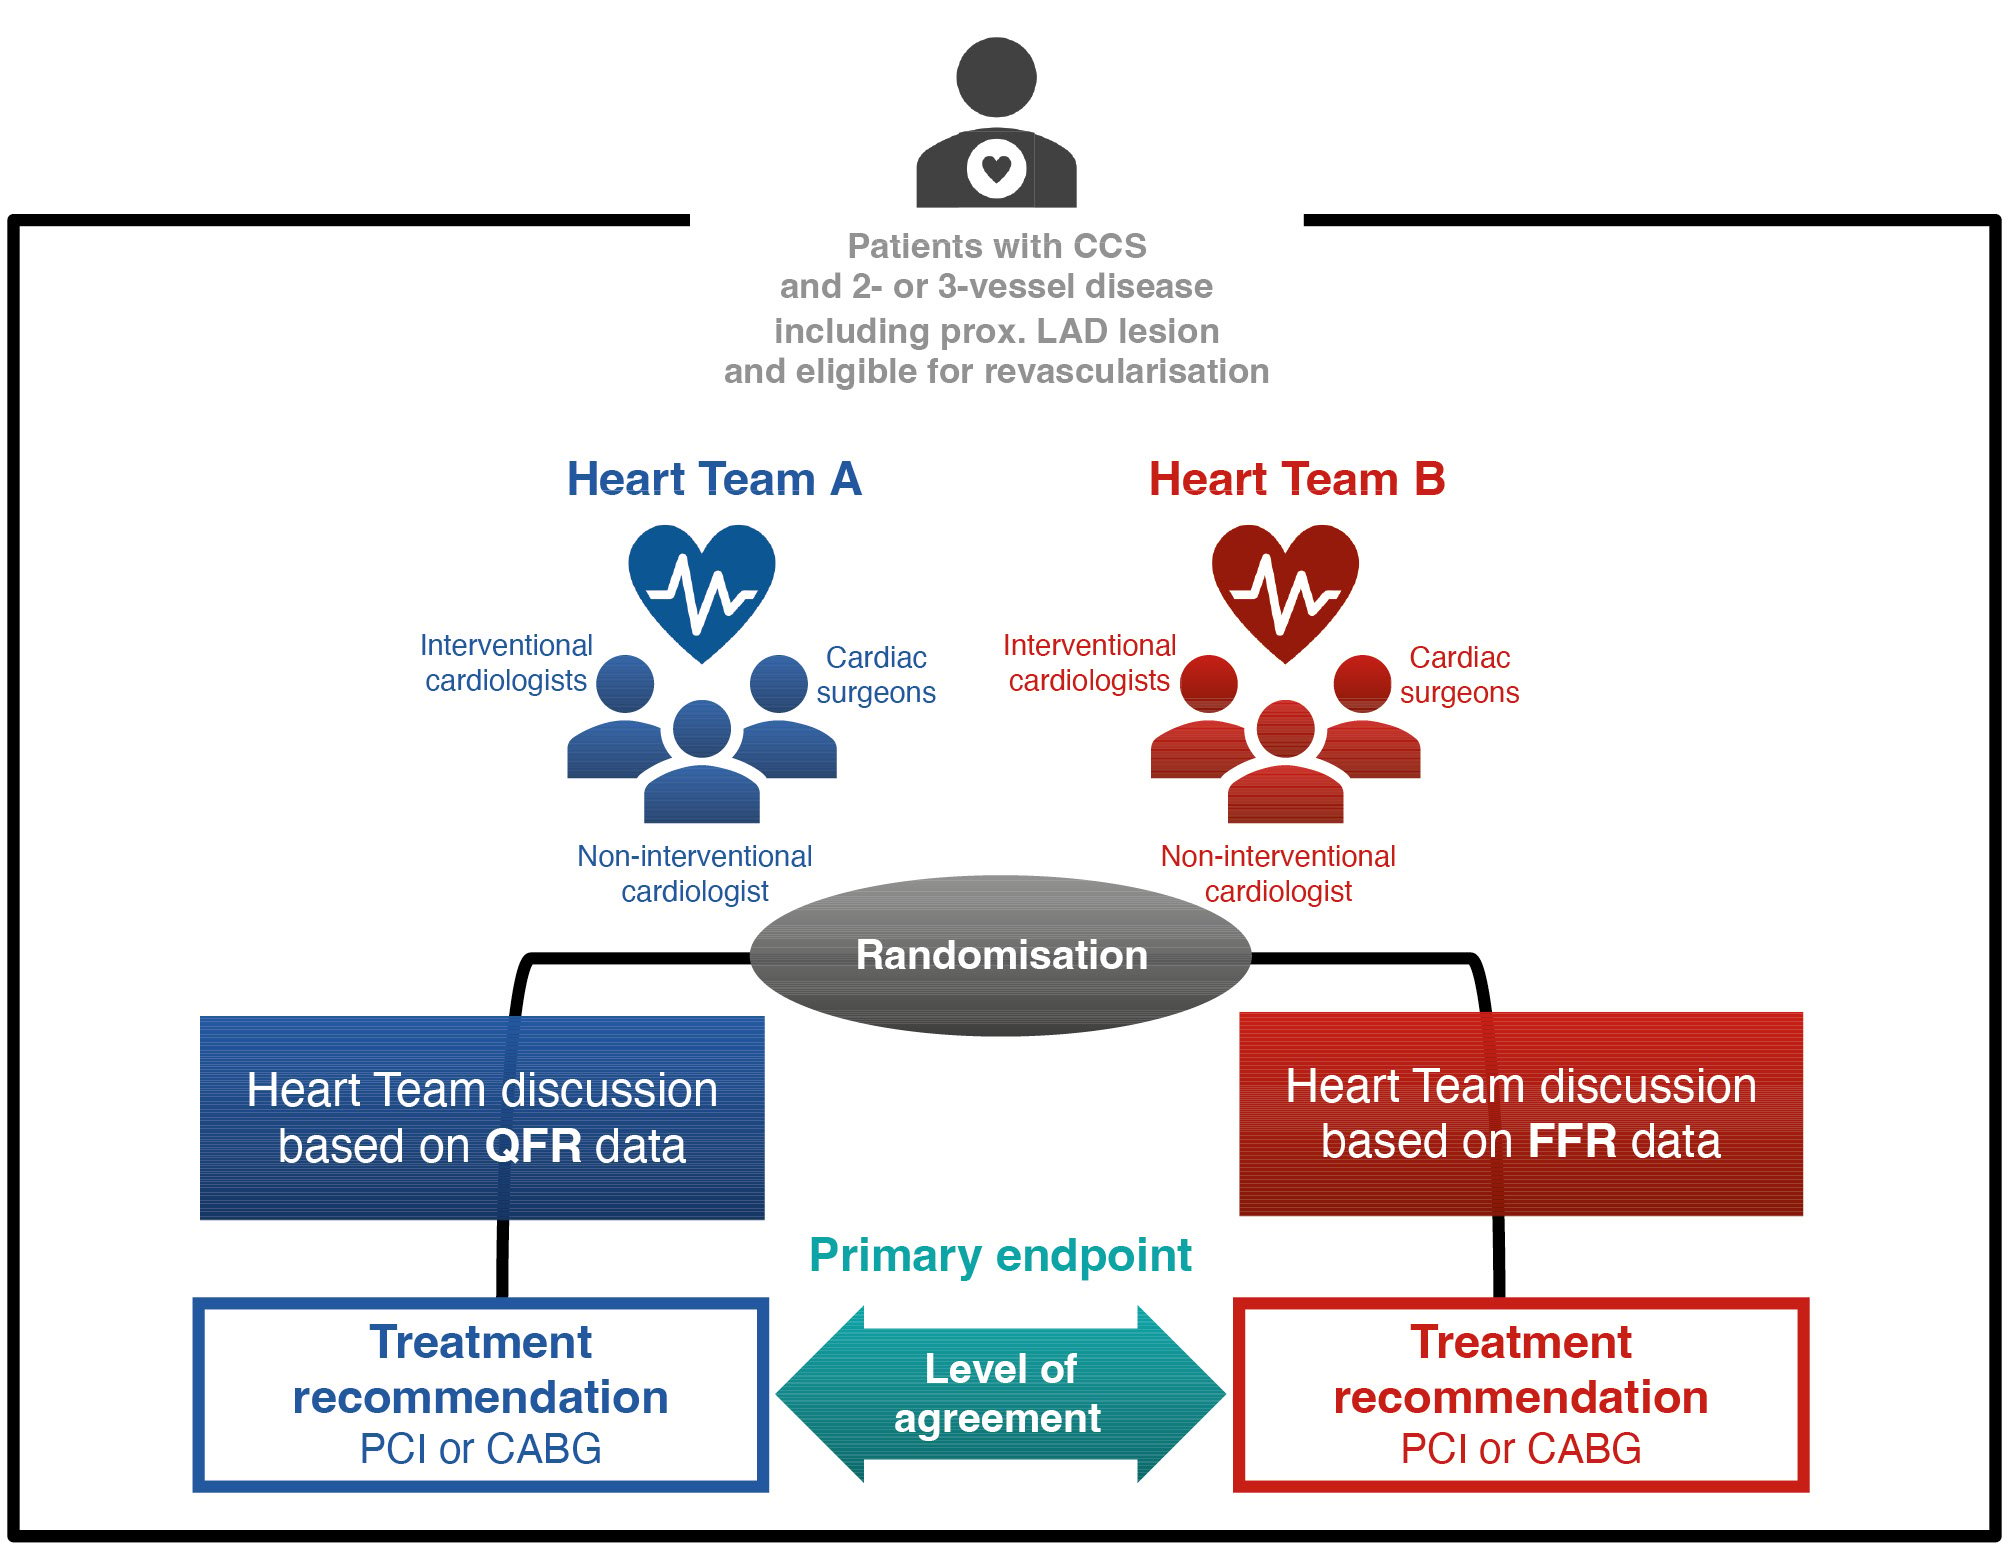
Figure 1. Trial design of the DECISION QFR study. The DECISION QFR trial is a multicentre randomised controlled trial investigating the feasibility of using QFR-based patient data to determine the optimal revascularisation strategy in Heart Team discussions. We assessed the agreement between the treatment recommendations based on QFR and those based on FFR. The primary endpoint was agreement between the recommended treatment options based on QFR and FFR approaches, as assessed using Cohen’s kappa. CABG: coronary artery bypass grafting; CCS: chronic coronary syndrome; FFR: fractional flow reserve; LAD: left anterior descending artery; PCI: percutaneous coronary intervention; QFR: quantitative flow ratio
INCLUSION AND EXCLUSION CRITERIA
The inclusion and exclusion criteria for the current trial are listed in Supplementary Appendix 1. Briefly, the trial enrolled patients with chronic coronary syndrome who had MVD involving proximal left anterior descending artery (LAD) lesions and required revascularisation (PCI or CABG). We excluded patients with specific anatomical conditions or comorbidities unsuitable for QFR analysis (i.e., aorto-ostial lesion, left main disease, advanced chronic kidney disease, atrial fibrillation, and patients who had previously undergone CABG) at the time of angiography. The trial recruited patients from 10 Japanese sites, as listed in Supplementary Appendix 2.
CORONARY ANGIOGRAPHY AND FFR ANALYSIS
To ensure sufficient imaging quality for QFR analysis, the investigators were encouraged to perform invasive coronary angiography in at least two projections on lesions that required clear visualisation without vessel shortening or overlapping. Use of the prespecified protocol was also recommended, including the use of specific projection angles which are listed in Supplementary Appendix 3.
Lesions with intermediate stenosis (visually estimated diameter stenosis of 50-90%) were investigated using a pressure wire to acquire FFR values. FFR values were measured at the distal part of the target lesions, and a pressure sensor was positioned at the part of the vessel with a diameter of ≥2.0 mm. The procedure time for FFR measurement (from zeroing the pressure wire to finishing all interrogations for all lesions) was recorded.
QFR ANALYSIS
We analysed the QFR in each vessel in which FFR was investigated. Experienced analysts performed offline QFR analysis using QAngio XA 3D version 2.0 (Medis Medical Imaging Systems) at an independent core laboratory (St. Luke’s International Hospital, Tokyo, Japan). The analysts were blinded to the FFR values. Details of the QFR calculations have been reported elsewhere10. The QFR was analysed in the segment between the ostium of the main vessels (i.e., LAD, right coronary artery, and left circumflex artery) and the anatomical site where FFR was interrogated. The procedure time for QFR analysis (from opening the cine files on the software to finishing the analyses for all lesions) was recorded.
CALCULATION OF THE SYNTAX SCORE, SYNTAX SCORE II 2020, AND FUNCTIONAL SYNTAX SCORE
The SS and FSS values were calculated at the core laboratory using a web calculator (https://www.syntaxscore.org). To calculate FSSFFR and FSSQFR, we summed the individual scores of lesions only in physiologically significant vessels (i.e., QFR or FFR ≤0.8) and excluded physiologically non-significant vessels7. To quantify patient risk considering coronary anatomy and patient characteristics, we calculated the SSII. The SSII yields two predicted risks: 5-year major adverse cardiovascular event and 10-year mortality for PCI and CABG3. Because the Heart Teams discussed the optimal treatment recommendations based on anatomical and physioÂlogical data, SSIIs were also calculated based on the FSS in addition to the anatomical SS. Thus, the SSIIFFR and SSIIQFR were generated using the FSSFFR and FSSQFR, respectively. The Heart Teams referred to the predicted absolute risk difference (ARD) between PCI and CABG, which represents an absolute excess risk after PCI treatment compared with CABG treatment (i.e., predicted risk after PCI treatment [%] − predicted risk after CABG treatment [%]), for determining their treatment recommendation. A positive ARD means that PCI has an excessive mortality risk as compared with CABG, numerically suggesting a beneficial prognostic effect of CABG.
DECISION-MAKING ON TREATMENT RECOMMENDATIONS BY THE HEART TEAMS
The two centralised Heart Teams comprised three cardiologists (two interventional cardiologists and one non-interventional cardiologist) and two cardiac surgeons at St. Luke’s International Hospital. The hospital conducts daily Heart Team discussions with experienced cardiologists and surgeons to determine optimal treatments for various heart conditions. The establishment of two central Heart Teams from the experienced institution ensures consistent, objective, and high-quality decision-making, thus minimising individual biases. Prior to this trial, a pretest showed substantial agreement (Cohen’s kappa=0.63 [95% confidence interval {CI}: 0.25-1.00]) between these teams in treatment recommendations for 21 patients, using identical patient information [9. These teams virtually discussed treatment strategies for patients enrolled from 10 participating sites. Virtual Heart Team discussions were held for each patient to decide on the optimal revascularisation strategy (PCI or CABG) by referring to the allocated physiological data and other basic patient data (i.e., patient background, cineangiography, and anatomical SS). The optimal treatment recommendation was selected from the following options: “CABG only”, “equipoise”, and “PCI only”. Details are provided in Supplementary Appendix 4.
Based on the allocated physiological data, the Heart Teams discussed the indications for revascularisation for each vessel with anatomical stenosis.
The Heart Teams made two treatment decisions: the first was made with blinded allocation and the second after allocation unblinding. After the first decision, each team was provided allocation data and opposite functional data (FFR data for the QFR approach and QFR data for the FFR approach), and the second decision was made after the data were equally distributed to both teams (unblinded decision).
ENDPOINTS
The primary endpoint of the current trial was the level of agreement in treatment recommendations between the QFR and FFR approaches. The level of agreement was assessed with Cohen’s kappa calculated based on two decision components: “CABG only” and “equipoise/PCI only”. To apply this method, we referred to a previous study that investigated the level of agreement between two Heart Teams regarding their decision on revascularisation strategy for patients with MVD11. We treated “CABG only” as a distinct category due to its exceptional nature, considering the potential increase in mortality if a patient suitable only for CABG (such as in cases of significant ARD) were to receive PCI1213. The secondary endpoints were as follows: (1) the availability rate of the FSSQFR, owing to a full set of analysable QFR in a coronary tree; (2) the level of agreement in target vessels between the QFR and FFR approaches for revascularisation; (3) the level of agreement between the decision based on QFR data (blinded decision) and the decision made after knowing the FFR data (unblinded decision) within the QFR approach; (4) the level of agreement between the FSSQFR and FSSFFR, assessed with the interclass correlation coefficient (ICC); (5) the procedure time of QFR analyses compared with that of FFR measurements; and (6) the incidence rate of complications during FFR measurements.
STATISTICAL CONSIDERATIONS AND SAMPLE SIZE CALCULATION
For the primary endpoint, a kappa value of 0.61-0.80 between the two ratings was interpreted as “substantial agreement”, and a kappa value of 0.41-0.60 was considered “moderate agreement”14. The level of decision agreement was expected to be substantial (kappa>0.60), and the trial would be considered successful if the lower boundary of the 95% CI was>0.40. We assumed that both teams would recommend “CABG only” in 20% of the enrolled patients with a kappa of 0.60. The detailed rationale of the assumptions in this trial has been described elsewhere9. Based on these assumptions, a sample size of 235 was sufficient to achieve 80% power and a positive trial with a 2-sided alpha of 0.05. Assuming an attrition rate of 10% to account for non-analysable cases, 260 patients were included.
Data are expressed as mean±standard deviation or median with interquartile range (IQR). Categorical variables were compared using Pearson’s chi-square test or Fisher’s exact test, as appropriate. Continuous variables were compared using t-tests. Unless otherwise specified, a 2-sided p-value of <0.05 was considered statistically significant.
The difference in procedural time between QFR and FFR was assessed using the Wilcoxon signed-rank test. The level of correlation and agreement between QFR and FFR were determined using Pearson’s correlation coefficient, Passing-Bablok regression analysis, and the Bland-Altman method. The agreement between the FSSQFR and FSSFFR was assessed using ICC. The discrimination ability of QFR for predicting an FFR of ≤0.80 was quantified using the receiver operating characteristic curve, and the areas under the curve (AUCs) were compared between analyses with and without the prespecified angiographic protocol using the DeLong method15. All statistical analyses were performed using R software, version 4.2.2 (R Foundation for Statistical Computing).
Results
Between August 2020 and October 2021, among 527 screened patients, 260 patients were enrolled. The patient flowchart and reasons for excluding patients in the eligibility assessment are presented in Supplementary Appendix 5 and Supplementary Appendix 6, respectively. In the 260 enrolled patients, coronary angiography detected 983 lesions with ≥50% stenosis. In these patients, a total of 507 vessels with intermediate stenosis (50-90%) were investigated using FFR (Supplementary Appendix 7). Four patients (1.5% [4/260]) experienced complications during FFR measurement. Of those, one had hypotension, one had arrhythmia, and two had vessel injury induced by the pressure wire. In 507 vessels with FFR measurements, 11 vessels could not be analysed for QFR (vessel-level analysability rate of QFR: 97.8% [496/507]). Thus, four patients were excluded because they did not have a full set of analysable QFR in a coronary tree for FSS calculation (availability rate of the FSSQFR: 98.5%). In total, 12 patients were excluded for reasons described in Supplementary Appendix 5, and 248 patients with 483 FFR and QFR measurements were included in the primary analysis. Patient characteristics are presented in Table 1. The mean number of lesions with visually estimated diameter stenosis ≥50% was 3.9±1.4. The prevalence of three-vessel disease was 58.1% and the mean anatomical SS was 20.9±9.3 points.
Table 1. Patient and anatomical characteristics.
| Patient characteristics | N=248 |
|---|---|
| Age, years | 70.8±10.2 |
| Male | 195 (78.6) |
| Body weight, kg | 65.2±13.1 |
| BMI, kg/m2 | 24.5±3.8 |
| Hypertension | 201 (81) |
| Diabetes mellitus | 120 (48.4) |
| Diabetes with insulin treatment | 15 (6) |
| Dyslipidaemia | 193 (77.8) |
| Current smoker | 57 (23) |
| History of myocardial infarction | 30 (12.1) |
| History of aortic disease | 11 (4.4) |
| History of PAD | 16 (6.5) |
| History of stroke | 16 (6.5) |
| COPD | 7 (2.8) |
| LVEF, % | 59.3±11.8 |
| Haemoglobin, g/dL | 13.8±1.8 |
| Creatinine, mg/dL | 0.9±0.5 |
| Anatomical characteristics | |
| Number of lesions with ≥50% stenosis | 3.9±1.4 |
| 3-vessel disease | 144 (58.1) |
| Diseased vessel | |
| RCA | 197 (79.4) |
| LAD | 248 (100) |
| LCx | 194 (78.2) |
| Anatomical SYNTAX score | 20.9±9.3 |
| SYNTAX score II 2020 based on angiographic stenosis | |
| 5-year MACE estimate after PCI, % | 25.4±14.1 |
| 5-year MACE estimate after CABG, % | 19±10.4 |
| ARD in 5-year MACE estimates, %* | 6.3±5.1 |
| 10-year mortality estimate after PCI, % | 36.1±20.9 |
| 10-year mortality estimate after CABG, % | 29.6±18.4 |
| ARD in 10-year mortality estimates, %* | 6.5±4.7 |
| Data are presented as N (%) or mean±SD. * ARD = risk estimate after PCI (%) – risk estimate after CABG (%). ARD: absolute risk difference; BMI: body mass index; CABG: coronary artery bypass grafting; COPD: chronic obstructive pulmonary disease; LAD: left anterior descending artery; LCx: left circumflex artery; LVEF: left ventricular ejection fraction; MACE: major adverse cardiovascular events; PAD: peripheral artery disease; PCI: percutaneous coronary intervention; RCA: right coronary artery; SD: standard deviation | |
HEART TEAM TREATMENT RECOMMENDATIONS AFTER UNBLINDING
The Heart Team assigned to the QFR approach changed its treatment recommendations (CABG only, equipoise, and PCI only) in 21 (8.7%) patients after unblinding the allocation, FFR values, FSSFFR, and SSIIFFR. After unblinding, Cohen’s kappa increased slightly (to 0.76 [95% CI: 0.65-0.86]) with 92.3% agreement. When we evaluated the consistency between the treatment decisions before and after unblinding in the Heart Team using the QFR approach, Cohen’s kappa was 0.95 [95% CI: 0.90-1.00].
FFR MEASUREMENT AND QFR ANALYSIS
A total of 483 vessels in 248 patients were investigated using FFR and subsequently analysed for QFR. The median QFR and FFR were 0.77 (IQR: 0.67-0.87) and 0.76 (IQR: 0.69-0.85), respectively. The procedure time of QFR analysis per vessel was significantly shorter than that of FFR measurement (7.97 min [IQR: 6.30-10.08] vs 8.38 min [IQR: 6.00-13.23]; p=0.035) (Supplementary Appendix 8). In patients who underwent angioÂgraphy according to the prespecified protocol (n=76, 30.6%), the difference was further pronounced (6.65 min [IQR: 5.47-8.18] vs 10.17 min [IQR: 7.03-13.59]; p< 0.001). However, when categorising the groups according to the two methods of hyperaemic administration (contentious intravenous [CIV] or intracoronary [IC] administrations), the QFR procedure time was significantly shorter than the FFR procedure time in cases with CIV administration, whereas this difference disappeared in cases with IC administration (Supplementary Appendix 9).
In the 483 vessels, the correlation coefficient between QFR and FFR was 0.68 [95% CI: 0.63-0.73] (Supplementary Appendix 10). The AUC of QFR for predicting FFR ≤0.80 was 0.88 [95% CI: 0.84-0.91], whereas the sensitivity, specificity, positive predictive value, and negative predictive value of QFR were 0.83 [95% CI: 0.78-0.87], 0.82 [95% CI: 0.75-0.88], 0.90 [95% CI: 0.86-0.93], and 0.72 [95% CI: 0.65-0.78], respectively. The AUC in patients undergoing angiography following the prespecified protocol had a diagnostic performance comparable to that of patients for whom the protocol was not followed (AUC: 0.89 vs 0.86; p=0.367).
Physiological data and SSs are summarised in Supplementary Appendix 11. In the 248 patients, the median FSSQFR and FSSFFR were 18.01±9.74 and 18.59±9.96, respectively. The ICC between the FSSFFR and FSSQFR was 0.94 [95% CI: 0.93-0.95] (Figure 2A). The mean predicted 10-year mortality risks after PCI derived from the SSIIQFR and SSIIFFR were 35.0±20.8% and 35.2±20.9%, respectively. The ICC for the ARD in 10-year mortality between the SSIIFFR and SSIIQFR were 0.97 [95% CI: 0.96-0.97] (Figure 2B).
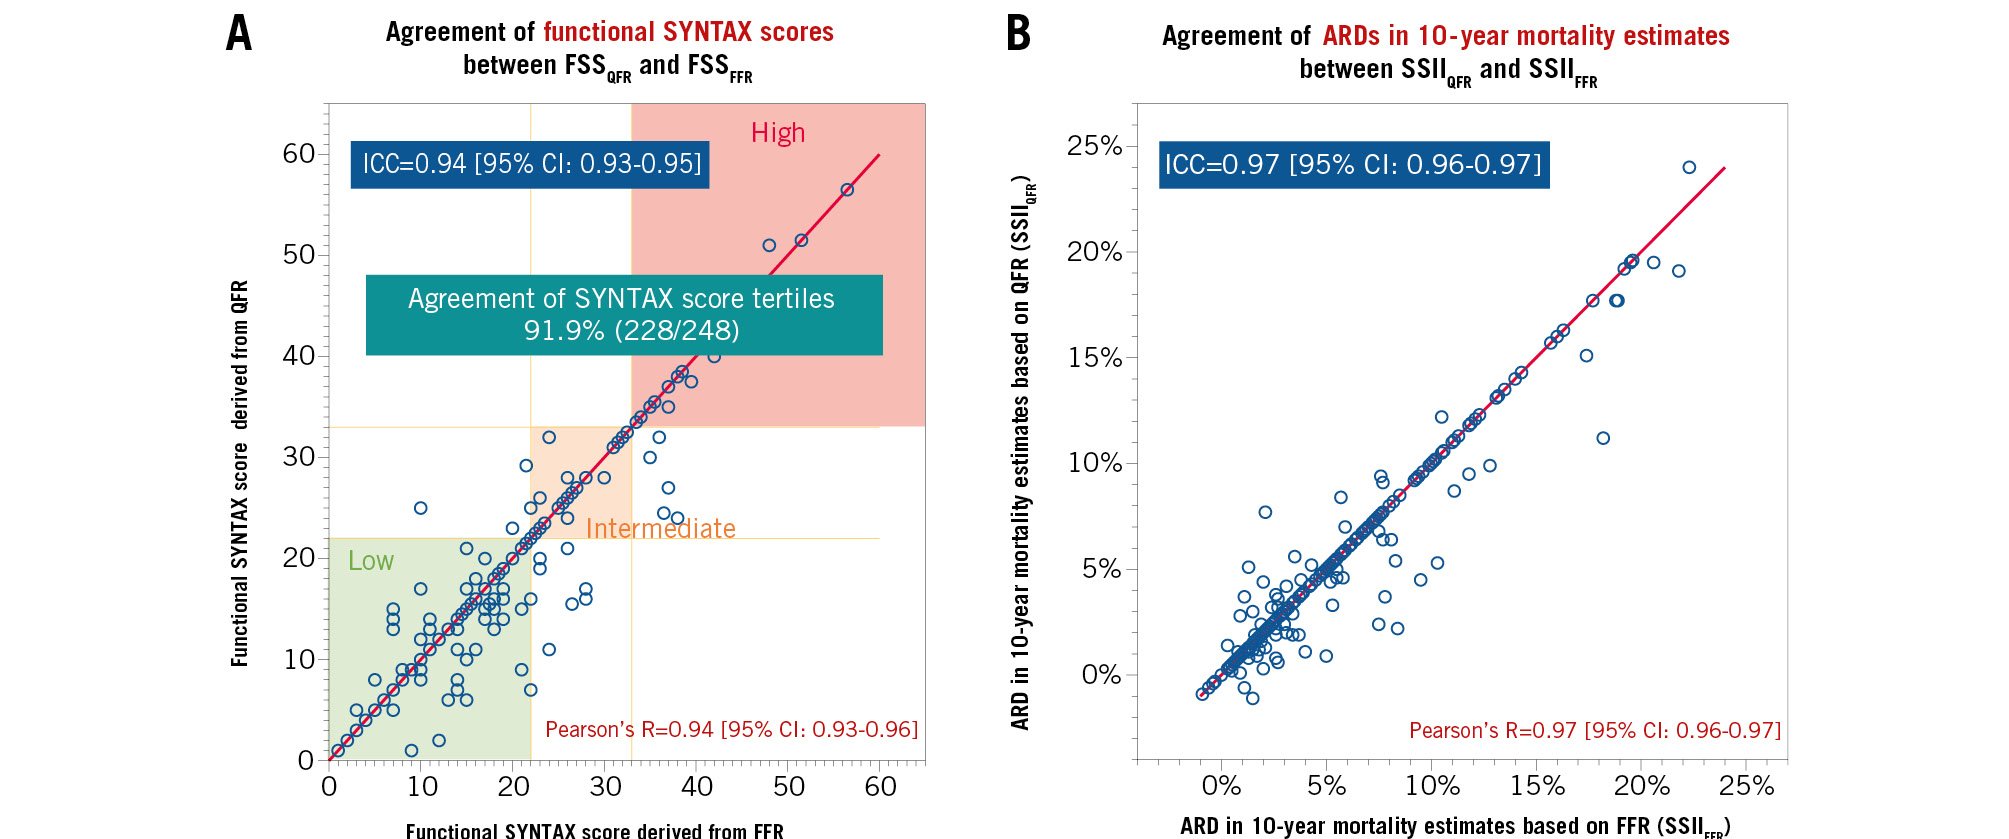
Figure 2. Agreements in functional SYNTAX scores and absolute risk differences in 10-year mortality estimates derived from the SSII between QFR and FFR. A) When the FSS were stratified into classic categories (low: ≤22, intermediate: 23-32, high: ≥33), the agreement of the categories was 91.9%; (B) the ARD represents an absolute excess mortality risk after PCI treatment compared with CABG treatment (i.e., predicted risk after PCI treatment [%] – predicted risk after CABG treatment [%]) estimated from SSII. ARD: absolute risk difference; CI: confidence interval; FFR: fractional flow reserve; FSS: functional SYNTAX score; ICC: interclass correlation coefficient; QFR: quantitative flow ratio; R: Pearson's correlation coefficient; SSII: SYNTAX score II 2020
AGREEMENT OF HEART TEAM TREATMENT RECOMMENDATIONS BETWEEN THE QFR AND FFR APPROACHES
The Heart Teams made treatment recommendations for 248 patients with a full set of QFR and FFR data. Table 2 shows that the agreement between the Heart Team’s treatment recommendations for the QFR and FFR approaches was 91.5% (227/248). The results for all patients are tabulated in Supplementary Appendix 12. Cohen’s kappa for the agreement in treatment recommendations was 0.73 [95% CI: 0.62-0.83] (Figure 3). The prespecified kappa goal was 0.60 (lower boundary of 95% CI: 0.40). Therefore, the primary endpoint was achieved.
Table 2. Agreement of Heart Team treatment recommendations between QFR and FFR approaches.
| Heart Team treatment recommendation based on QFR-based physiological information | ||||
|---|---|---|---|---|
| PCI/equipoise | CABG | |||
| Heart Team treatment recommendation based on FFR-based physiological information | PCI/equipoise | 76.2%(189/248) | 4.4%(11/248) | 80.6%(200/248) |
| CABG | 4.0%(10/248) | 15.3%(38/248) | 19.4%(48/248) | |
| 80.2% (199/248) | 19.8%(49/248) | Agreement 91.5% (227/248) | ||
| CABG: coronary artery bypass grafting; FFR: fractional flow reserve; PCI: percutaneous coronary intervention; QFR: quantitative flow ratio | ||||
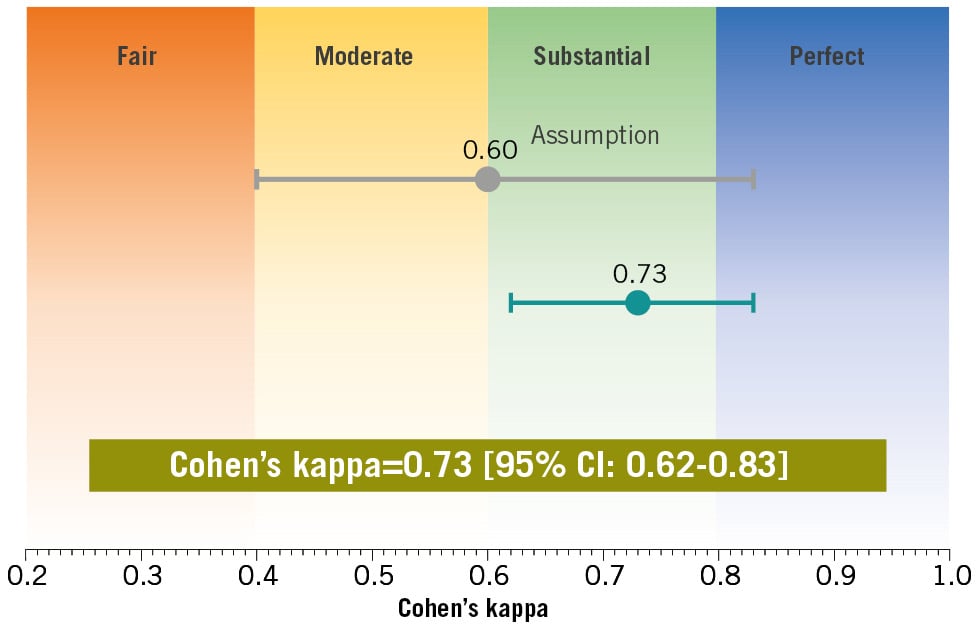
Figure 3. Level of agreement in the recommended revascularisation mode between the QFR and FFR approaches in the Heart Team discussion as assessed using Cohen’s kappa. Cohen’s kappa for the agreement in treatment recommendations was 0.73 [95% CI: 0.62-0.83]. The prespecified kappa goal was 0.60, with a lower boundary of the 95% CI of 0.40. The primary endpoint of this trial was achieved. CI: confidence interval; FFR: fractional flow reserve; QFR: quantitative flow ratio
AGREEMENT OF HEART TEAM REVASCULARISATION PLANNING BETWEEN QFR AND FFR APPROACHES
The two Heart Teams deliberated on the indications for revascularisation in 545 vessels for PCI and 575 for CABG. Regarding the agreement in target vessels for revascularisation between the QFR and FFR approaches, Cohen’s kappa was 0.72 [95% CI: 0.66-0.78] in the case of PCI and 0.72 [95% CI: 0.66-0.78] in the case of CABG (Supplementary Appendix 13).
DIFFERENCES IN PATIENT BACKGROUND BETWEEN PATIENTS WITH HEART TEAM DECISION AGREEMENT AND DISAGREEMENT
Of the 248 patients, 21 (8.5%) had discrepancies in the treatment recommendations from the two Heart Teams (Figure 4). Those with decision discrepancies had a higher prevalence of diabetes and peripheral artery disease, as well as higher SSs (anatomical SS and FSS) and estimated ARDs, than those with decision agreement between the two Heart Teams (Supplementary Appendix 14). This suggests that more complex patients (i.e., those more suitable for CABG) were more likely to drive a decision discrepancy between the two Heart Teams. The difference between the predicted ARDs derived from the SSIIQFR and SSIIFFR was more prominent in the patients for whom the Heart Team’s decision was discrepant than for those with matched recommendations (1.39±2.08% vs 0.43±0.98%; p<0.001), suggesting that a greater mismatch between QFR and FFR leads to disparate treatment recommendations.
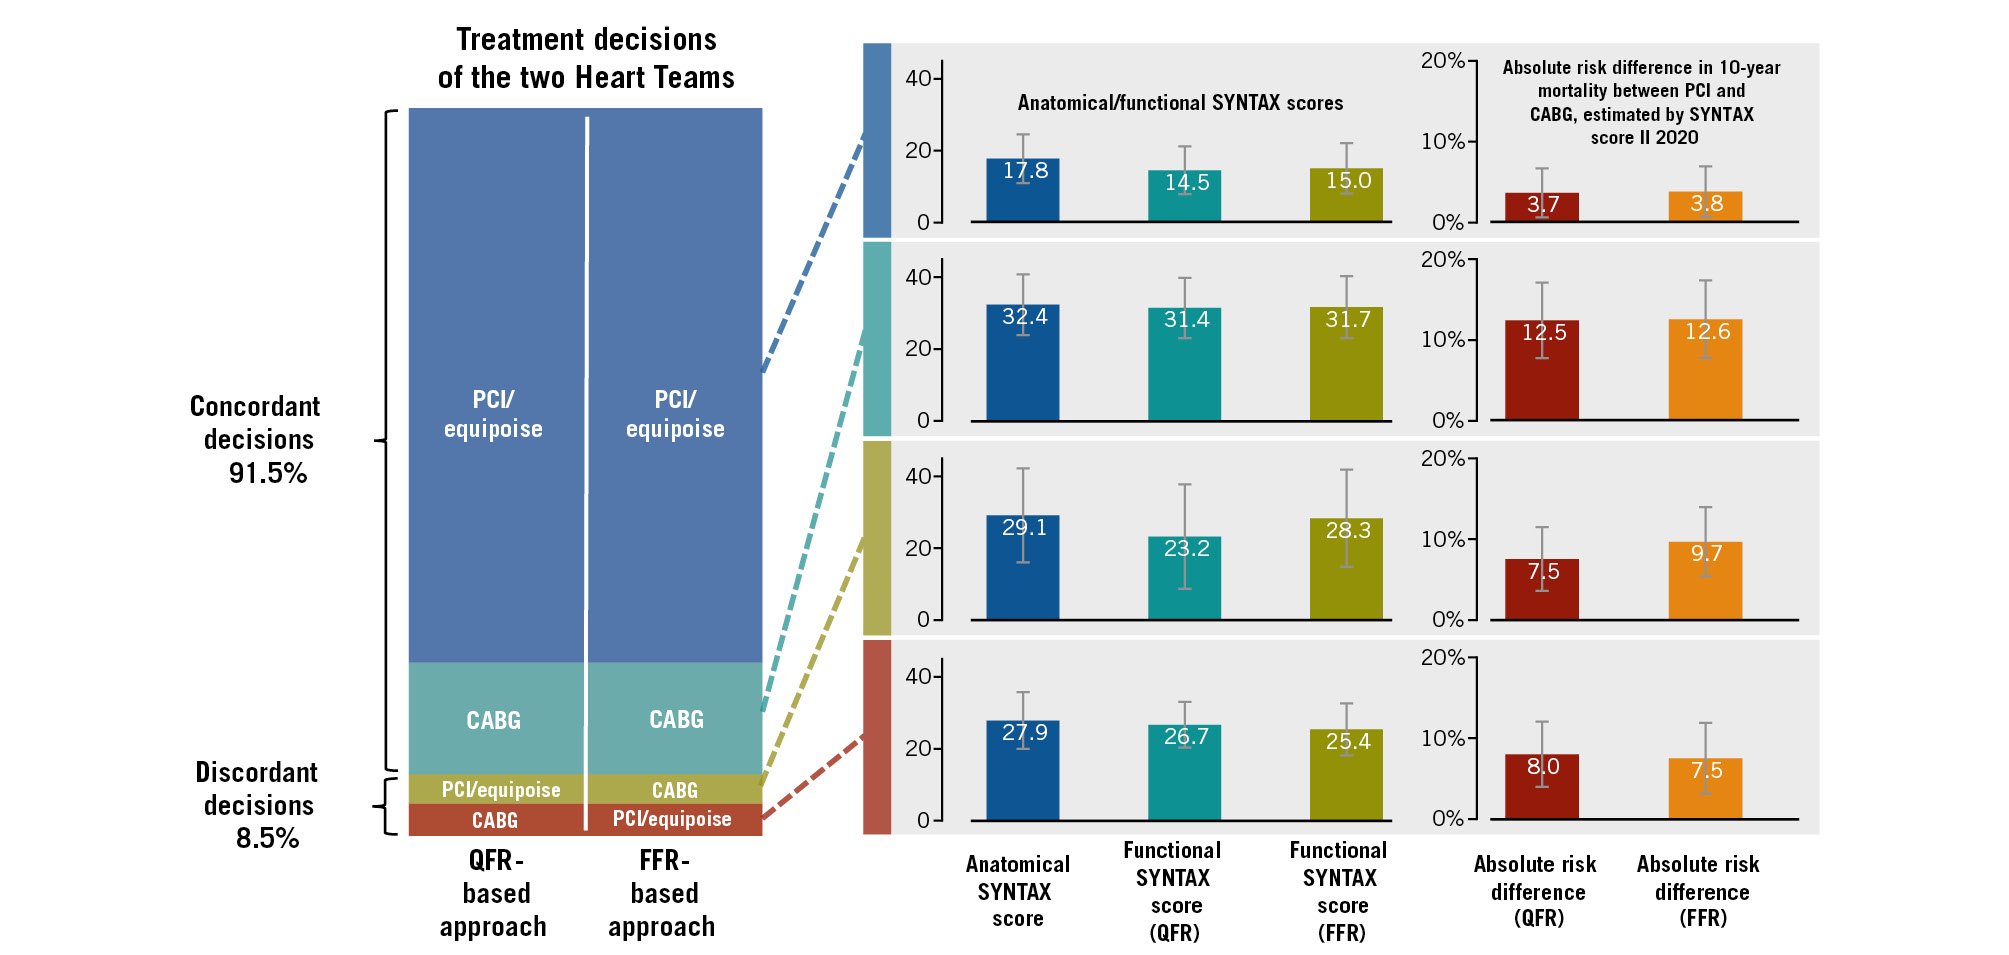
Figure 4. Relationship between decision concordance and estimated absolute risk differences in 10-year mortality. In cases with decision concordance between QFR and FFR approaches, the functional SYNTAX scores based on QFR and FFR were comparable. Consequently, absolute risk differences (ARDs) for 10-year mortality between PCI and CABG treatments, which were estimated with SYNTAX score II 2020, were also comparable between the two approaches. However, in cases with decision discordance between the two approaches, numerically higher ARDs were observed in the approaches where the Heart Team chose CABG treatment. CABG: coronary artery bypass grafting; FFR: fractional flow reserve; PCI: percutaneous coronary intervention; QFR: quantitative flow ratio
Discussion
This trial investigated the feasibility of using physiological data based on QFR compared with a physiological assessment with FFR by evaluating Heart Team discussions to determine the recommended revascularisation mode in patients with MVD (Central illustration). The trial showed substantial agreement in the treatment recommendations made by the Heart Teams using QFR or FFR data. The Heart Team assigned to the QFR approach provided consistent recommendations even after being aware of the FFR data. There was substantial agreement in the vessels targeted for revascularisation between the two teams for PCI and CABG. QFR required a significantly shorter procedure time than FFR for measuring the physiological indices of interest.
The RIPCORD 2 trial investigated the impact of a systematic FFR assessment of all relevant coronary arteries (median of four examined vessels) on resource use, quality of life, and clinical outcomes. In that trial, 1.8% of patients experienced complications associated with FFR measurements (coronary dissection, acute myocardial infarction, retained wire elements, and arrhythmia) [16]. Similarly, the current trial included four patients (1.5%) who experienced complications during FFR measurement (1 arrhythmia, 1 hypotension, and 2 wire injuries). In contrast, QFR was developed without the need for a pressure wire or hyperaemia-inducing drugs, thus avoiding these complications [17]. In the current trial, QFR had a shorter procedure time for interrogating coronary lesions than FFR. Furthermore, QFR allows for post hoc analysis. Thus, physiological assessment of the vessels of interest by QFR does not require patients to stay in the catheter room for a prolonged period. Wireless functional assessment using QFR may overcome the limitations of the FSS using FFR.
In the post hoc study of the SYNTAX II trial investigating the prognostic capability of the FSSQFR, only 28.1% of patients had a full set of analysable QFR in the entire coronary tree, enabling FSSQFR calculation [8]. However, our trial demonstrated a high availability rate of the FSSQFR (98.5%), owing to the substantial analysability of QFR. This suggests that the FSSQFR is feasible if an operator performs angiography by prospectively considering QFR analysis. Interestingly, in the current trial, the prespecified angiographic protocol did not improve the analysability or diagnostic performance of the QFR, although it played an essential role in shortening the analysis time. Cine angiograms with fixed projection angles may reduce the time required to select the exact cine and frame to capture an appropriate angiographic image for QFR analysis.
Notably, even after sharing identical patient data (i.e., unblinding), the two Heart Teams provided unmatched treatment recommendations for 7.7% (19/248) of the patients (Cohen’s kappa=0.76). This means that some of the observed disagreements in treatment recommendations could be ascribed to between-team decision variance. However, we consider that this conflict is also associated with the mismatch between QFR and FFR. Patients with unmatched treatment recommendations showed a more significant difference in ARDs between the SSIIQFR and SSIIFFR than those with matched recommendations (Figure 4, Supplementary Appendix 14). Among the 21 cases where the Heart Team assigned to the QFR approach revised its decisions after unblinding the FFR values, 14 cases (66.7%) exhibited discrepancies in the assessment of the functional significance of the LAD between the QFR and FFR assessments. Additionally, all 21 cases showed differences in the number of functionally significant vessels when comparing the two assessments (Supplementary Appendix 15). However, this trial did not have enough statistical power to enable a causal analysis of the decision discrepancy between the Heart Teams.
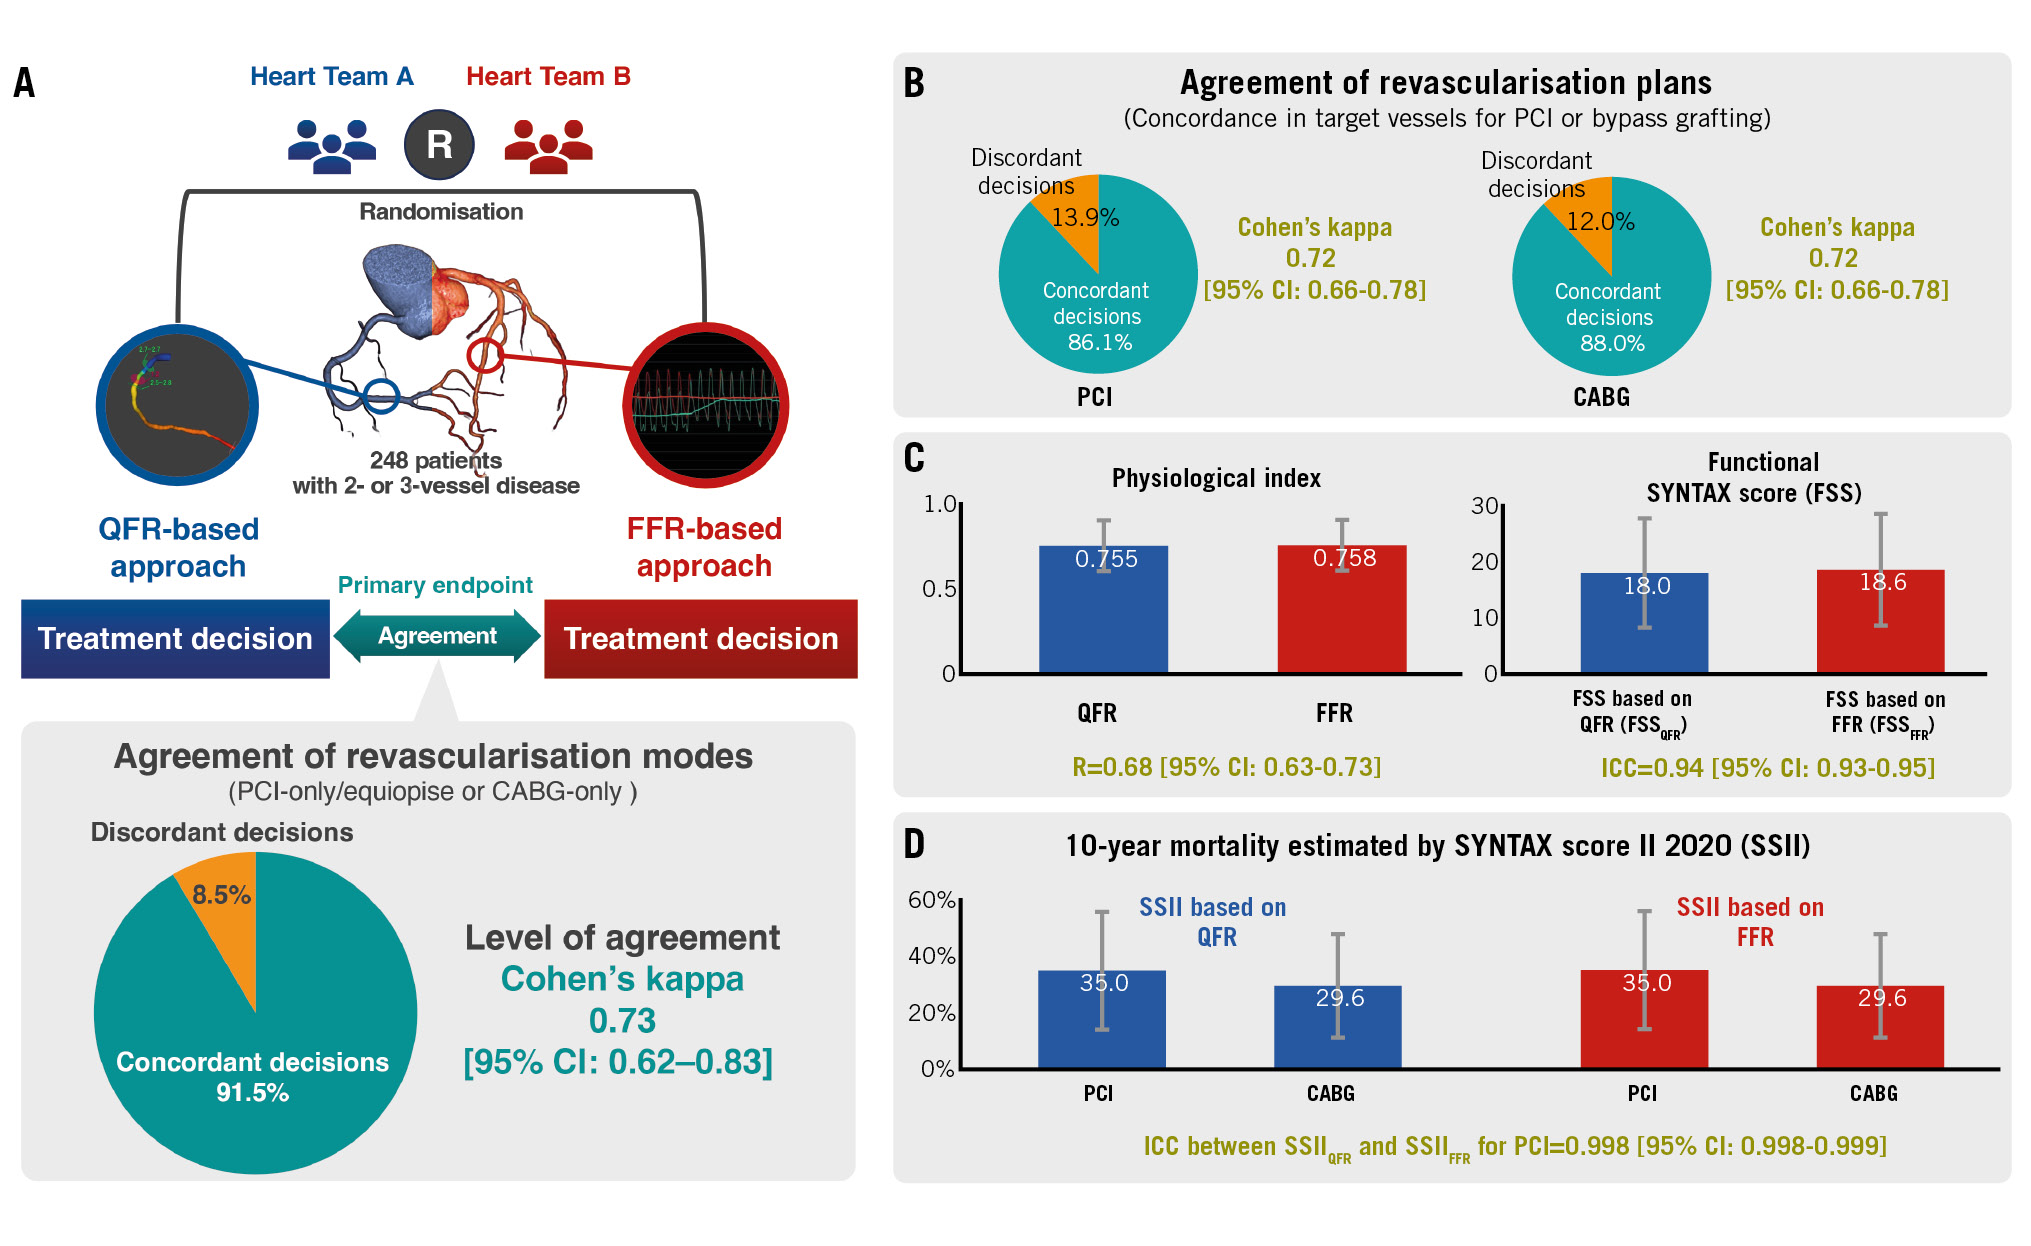
Central illustration. The DECISION QFR trial randomised two Heart Teams to either quantitative flow ratio (QFR) or fractional flow reserve (FFR) patient data to determine the optimal revascularisation strategy for 260 patients with multivessel disease. The primary interest of the trial was the level of agreement in treatment recommendations made based on QFR or FFR data as assessed with Cohen’s kappa (A). There were substantial agreements between vessel-level treatment revascularisation plans made by the two Heart Teams (B). Additionally, QFR yielded comparable physiological indices, functional SYNTAX score (C), and 10-year mortality estimations derived from SYNTAX score II 2020 (D) with FFR. CABG: coronary artery bypass grafting; CI: confidence interval; FFR: fractional flow reserve; ICC: interclass correlation coefficient; MVD: multivessel disease; PCI: percutaneous coronary intervention; QFR: quantitative flow ratio; R: Pearson's correlation coefficient
Limitations
The current trial is the first to reveal the feasibility of vessel-level wireless physiological assessment using QFR to inform Heart Team discussions. Our results suggest that coronary angiography leading to QFR analysis includes not only anatomical data but also vessel-level physiological data, which can be as valuable as FFR in Heart Team discussions. This study has some limitations. First, it did not investigate the impact of the QFR-based Heart Team treatment decisions on clinical outcomes. Recent studies have generated controversy regarding the significance of physiological evaluations, particularly FFR, in the context of coronary revascularisation [16,17]. Studies evaluating the impact of QFR-guided treatment decisions on patient clinical outcomes in Heart Teams are warranted. Second, the current study has several exclusion criteria related to background and anatomical conditions. Indeed, 28.1% of the screened patients were excluded because they met one or more of these criteria. It is important to recognise that the findings of this study may not be universally applicable in real-world practice. Third, the current trial did not assess the impact of functional information such as QFR and FFR on the Heart Team decisions, as compared with anatomical information only. Fourth, in the current trial, QFR was analysed only in the vessels where FFR was measured. This design may eventually underestimate the clinical advantage of QFR, because QFR can be potentially analysed in the vessels where FFR cannot be measured due to anatomical issues which increase the risk of the pressure wire manipulation. Fifth, the QFR analysis in this trial was conducted by experienced operators. It has been reported that the accuracy and reproducibility of QFR analysis were associated with the experience of the operator [18]. Sixth, in the secondary endpoint analysis for the agreement of vessel-level treatment decisions for each patient between the two Heart Teams, the nested structure within each patient could be reasonable for the calculation of Cohen’s kappa. However, this modification potentially causes the results to be interpreted as complex, because this modification is not generally employed.
Conclusions
In Heart Team discussions for determining the optimal revascularisation mode in candidates with MVD, QFR provided comparable physiological data to FFR. This allowed for a non-invasive assessment of the functional significance of coronary artery stenosis on angiography, enabling determination of the most suitable treatment.
Impact on daily practice
The accurate prognostic assessment of patients with multivessel disease (MVD) following revascularisation can significantly inform the decisions of Heart Teams regarding the optimal revascularisation strategy. The quantitative flow ratio (QFR), as well as the fractional flow reserve (FFR), has also been recognised for augmenting the prognostic precision of the SYNTAX score (SS). However, the feasibility of using QFR during the Heart Team discussion remains to be thoroughly evaluated. The findings of this trial underscore the viability of QFR as a favourable alternative to wire-based FFR within Heart Team discussions for MVD patients. Utilising QFR eliminates the need for invasive FFR measurement procedures across multiple vessels and reduces procedural time, thereby enhancing the overall practicality of the functional SS, which conventionally requires physiological assessment using a pressure wire.
Funding
The current investigator-initiated trial received a national Grant-in-Aid for Scientific Research (19K17617).
Conflict of interest statement
J.H.C. Reiber is the CSO of Medis Medical Imaging Systems and has a part-time appointment at Leiden University Medical Center as a Professor of Medical Imaging. The other authors have no conflicts of interest to declare.
Supplementary data
To read the full content of this article, please download the PDF.