Abstract
Background: Limited data exist on ultrathin-strut drug-eluting stent (ultrathin DES) performance in DES in-stent restenosis (ISR).
Aims: We aimed to assess the efficacy and safety of ultrathin DES compared to thin-strut DES and drug-eluting balloons (DEB) for DES-ISR.
Methods: Patients from the DEB Dragon (ClinicalTrials.gov: NCT04415216) and ULTRA registries (ClinicalTrials.gov: NCT05205148) were divided into ultrathin DES, thin-strut DES, or DEB groups for DES-ISR treatment. Both propensity score matching (PSM) and inverse probability weighting (IPW) were considered to adjust the distribution of patients in each class. Cox regression was applied to the following main endpoints: device-oriented composite endpoints (DOCE; including cardiac death, target lesion revascularisation [TLR] and target vessel myocardial infarction), TLR and target vessel revascularisation (TVR).
Results: A total of 269, 541, and 557 patients received an ultrathin DES, thin-strut DES, and DEB, respectively. After 3 years of follow-up, in the IPW-adjusted overall cohort, ultrathin DES were associated with a significantly reduced risk of DOCE compared to DEBs (hazard ratio [HR] 0.353, 95% confidence interval [CI]: 0.194-0.642; p<0.001), as well as thin-strut DES (HR 0.645, 95% CI: 0.457-0.911; p=0.013). Compared to DEBs, ultrathin DES also reduced the risks of both TLR (HR 0.184, 95% CI: 0.081-0.417; p<0.001) and TVR (HR 0.188, 95% CI: 0.093-0.379; p<0.001), while thin-strut DES did not (TLR: HR 0.686, 95% CI: 0.407-1.157; p=0.157; TVR: HR 0.706, 95% CI: 0.453-1.101; p=0.124). For diffuse ISR patients, ultrathin DES reduced the risk of DOCE (HR 0.364, 95% CI: 0.188-0.705; p=0.003), as did thin-strut DES (HR 0.602, 95% CI: 0.367-0.987; p=0.044), while a reduction of TLR (HR 0.220, 95% CI: 0.091-0.531; p<0.001) and TVR (HR 0.241, 95% CI: 0.113-0.513; p<0.001) was achieved only by ultrathin DES.
Conclusions: Ultrathin DES were associated with reduced DOCE, TLR and TVR risks in diffuse ISR compared to DEBs.
Despite advances in percutaneous coronary intervention (PCI), in-stent restenosis (ISR) remains a significant issue and a common cause of PCI failure12. Current guidelines recommend ISR treatment via drug-eluting stents (DES) or drug-eluting balloons (DEBs), with the choice left to the physician3. Several randomised controlled trials (RCTs) and meta-analyses have shown that DES are moderately more efficient than DEBs for DES-ISR4567. However, DEBs may be preferable in scenarios where adding another stent layer is undesirable because of factors like multiple previous stent layers, major side branches, stent underdeployment, or the need for short-duration dual antiplatelet therapy (DAPT)89.
The 10-year outcomes of the ISAR-DESIRE-3 trial demonstrated that paclitaxel-eluting stents (PES) and paclitaxel-coated balloons (PCBs) significantly reduce target lesion revascularisation (TLR) compared to plain balloon (PB) angioplasty, with similar 10-year incidences of a device-oriented composite endpoint (DOCE)10. Most evidence on DES performance in ISR pertains to second-generation thin-strut DES. Recent advancements have focused on reducing strut thickness and enhancing the biocompatibility of polymer coatings, leading to new-generation DES designed to minimise the inflammatory response and neointimal proliferation1112.
A recent meta-analysis found that ultrathin-strut DES (ultrathin DES; strut thickness <70 μm) reduced the risk of target lesion failure (TLF), primarily due to fewer TLR, compared to conventional second-generation thin-strut DES, with similar risks of myocardial infarction (MI), stent thrombosis (ST), cardiac death, and all-cause mortality over a mean follow-up of 2.5 years13. However, there are no data on the performance of ultrathin DES in ISR. This study aims to evaluate the efficacy of ultrathin DES compared to thin-strut DES and DEBs in DES-ISR.
Methods
INCLUSION CRITERIA
We selected patients with ISR from the Ultrathin DES in Complex PCI Scenarios: the ULTRA a Multicenter Study (ULTRA; ClinicalTrials.gov: NCT05205148) and the DEB Dragon registries (ClinicalTrials.gov: NCT04415216) (Central illustration). Details on the study design have been previously reported1214. Only patients experiencing their first DES-ISR event were included, while those with bare metal stent (BMS)-ISR and recurrent ISR were excluded.
ISR was defined as a luminal narrowing with >50% diameter stenosis of a stented segment or within 5 mm of a stent edge. ISR was classified according to Mehran et al15 as follows:
1. Focal ISR: lesions ≤10 mm in length at the unscaffolded segment, stent body, proximal or distal margin, or multifocal ISR;
2. Diffuse intrastent ISR: lesions >10 mm in length within the stent(s), not extending beyond the margins;
3. Diffuse proliferative ISR: lesions >10 mm in length extending beyond the stent margins;
4. ISR with total occlusion.
For the aim of the present analysis, we created 2 cohorts of patients: those with focal ISR and those with diffuse intrastent, proliferative and total occlusion (namely diffuse ISR). ISR patterns were adjudicated at each centre based on specific protocols and validated by the Medical University of Silesia, Katowice, Poland for DEB Dragon, and by AOU Città della Salute e della Scienza, Torino, Italy for ULTRA. Devices used in the three groups are summarised in Supplementary Appendix 1.
Ultrathin-strut stents were defined as those with a strut thickness ≤70 μm. Thin-strut DES were defined as all DES with a strut thickness >70 μm. Patients treated with Orsiro platforms (Biotronik) were allocated to the ultrathin-strut group or to the thin-strut group for diameters < or ≥3.5 mm, respectively. The strut thickness cutoff was set to be at least 10 μm lower than the thicker-strut second-generation DES (strut thickness of ≈81 μm), as previously defined1316. For the purpose of this study, the impact of polymer thickness, on top of strut thickness, was not considered.
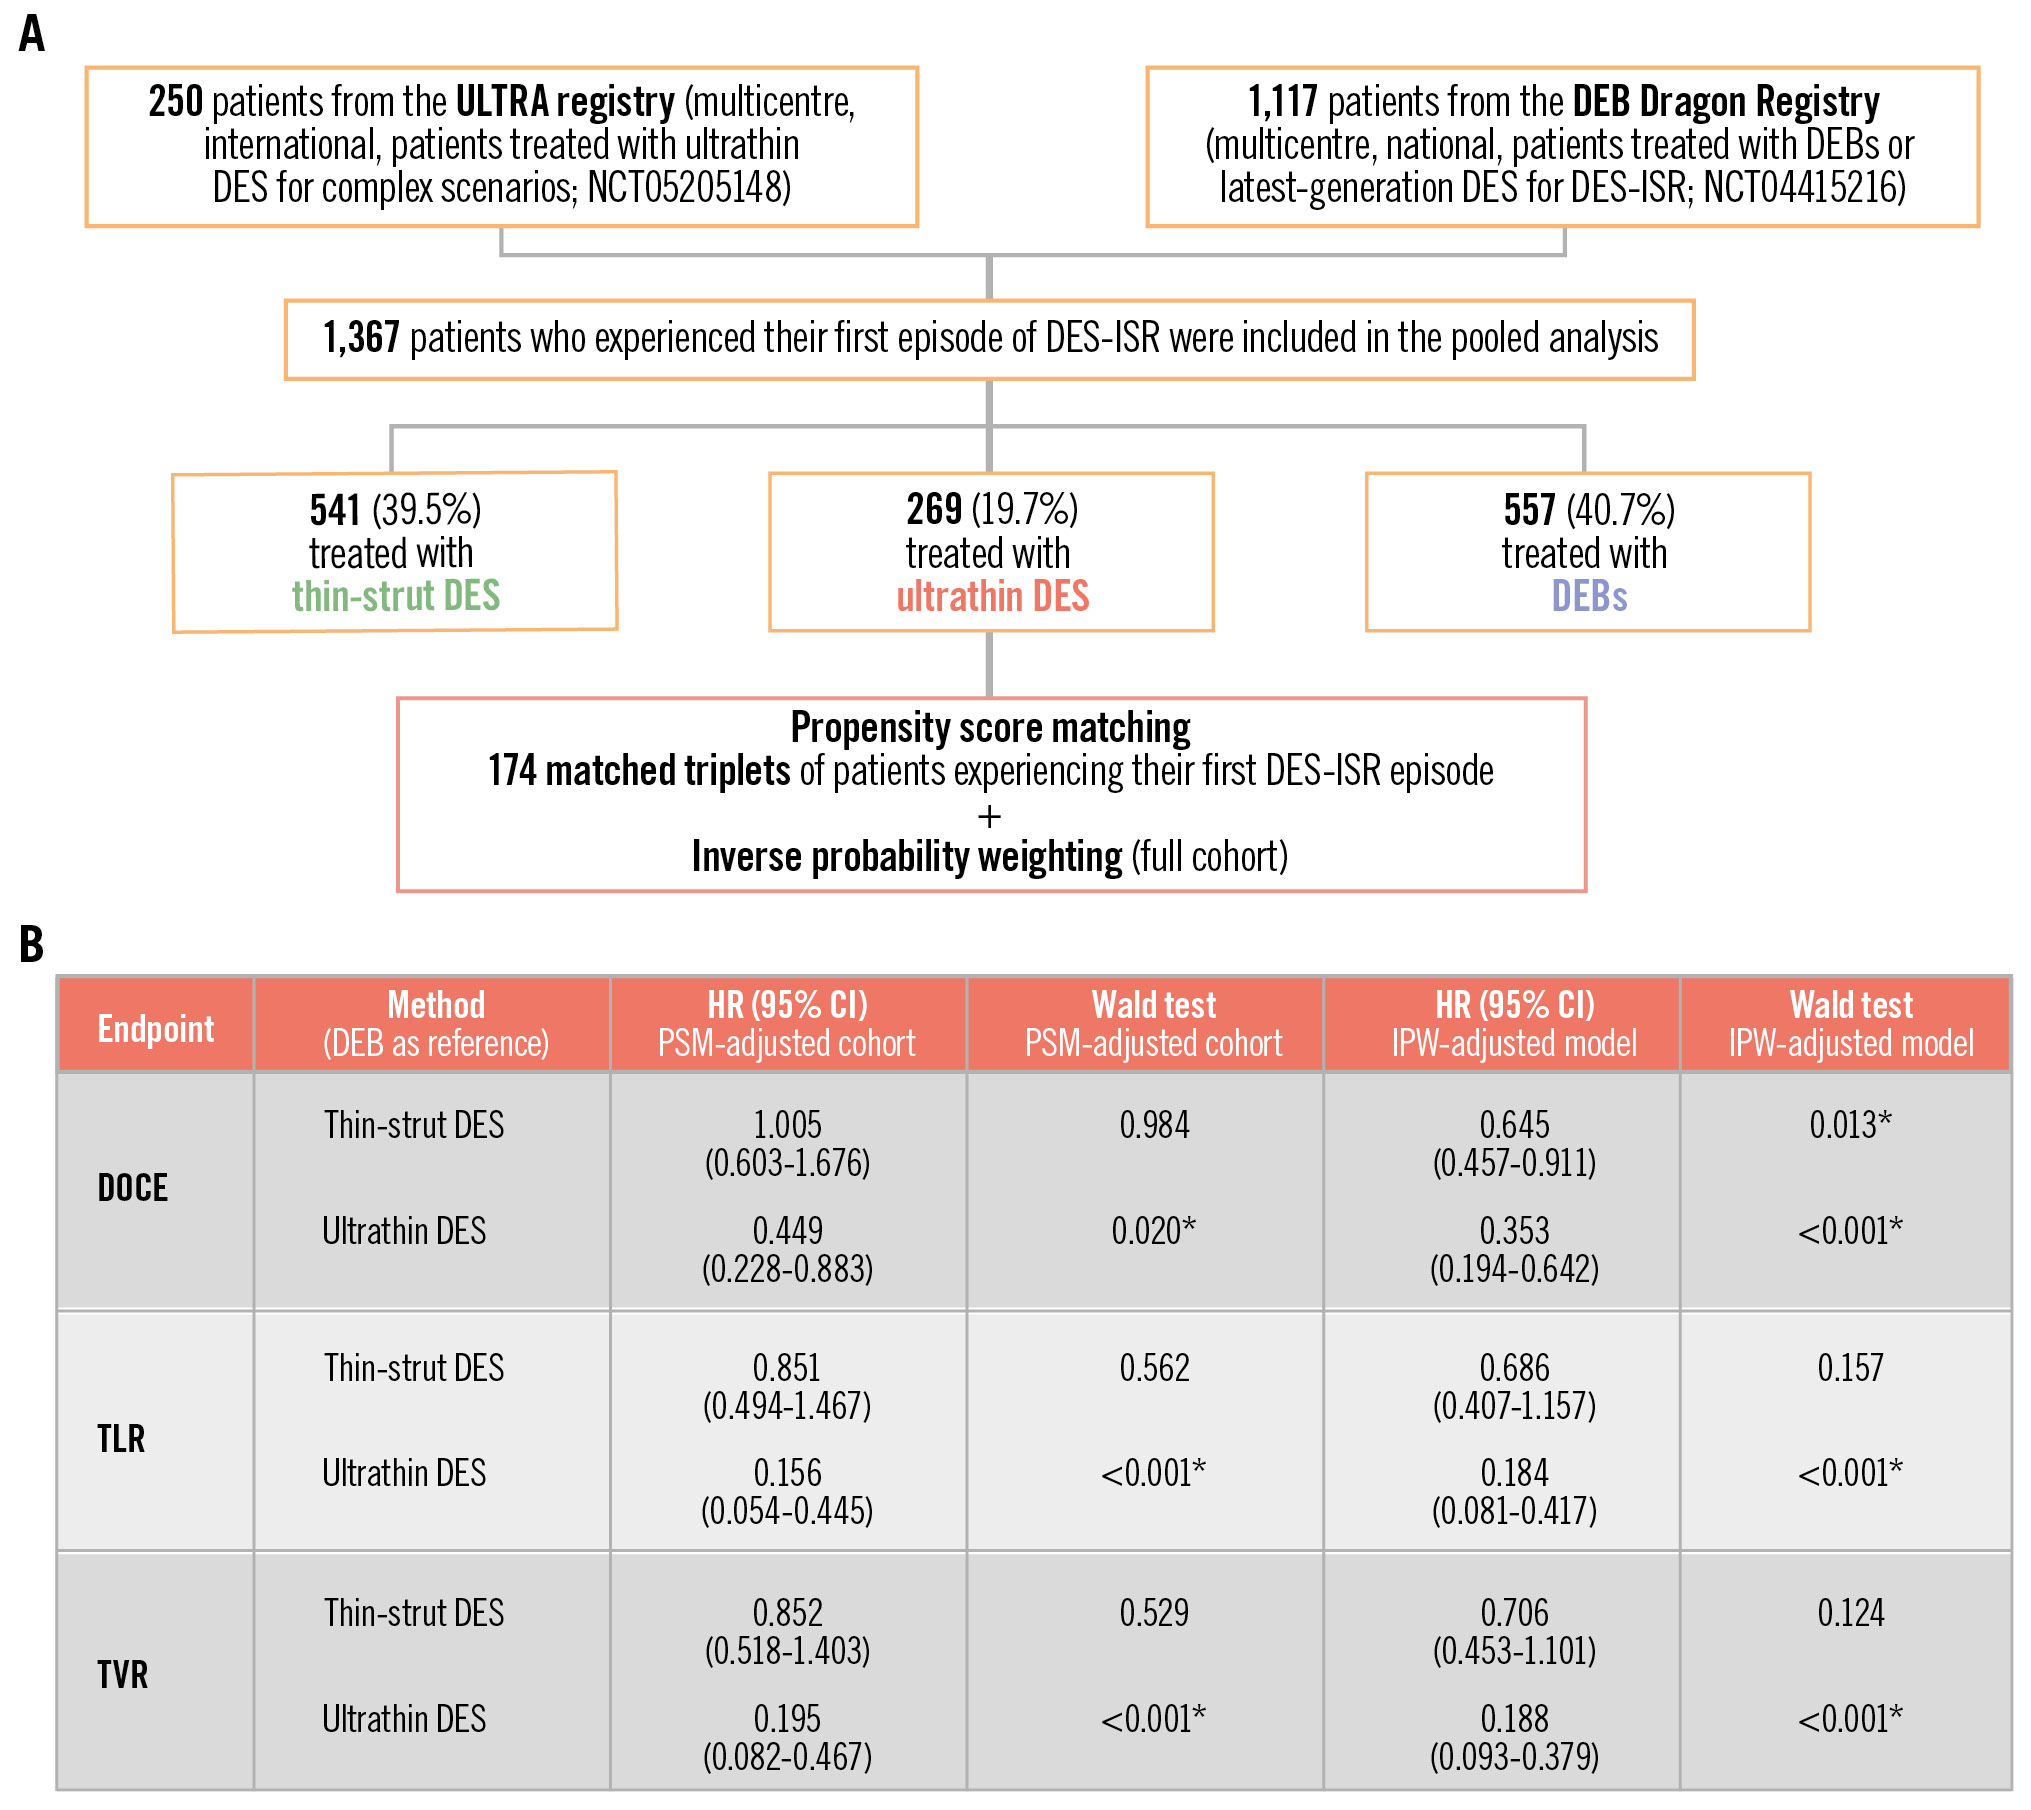
Central illustration. Ultrathin- versus thin-strut DES with respect to DEB for in-stent restenosis. A) Study flowchart; (B) summary of the key results. *Statistical significance, i.e., p-value<0.05. In patients being treated for a first episode of DES-ISR, ultrathin-strut DES are associated with a reduced risk of DOCE, TVR and TLR compared to thin-strut DES and DEBs. Such a difference is mainly observed in the context of diffuse ISR. CI: confidence interval; DEB: drug-eluting balloon; DES: drug-eluting stent; DOCE: device-oriented composite endpoint; HR: hazard ratio; IPW: inverse probability weighting; ISR: in-stent restenosis; PSM: propensity score matching; TLR: target lesion revascularisation; TVR: target vessel revascularisation; ultrathin DES: ultrathin-strut DES
BASELINE AND PROCEDURAL DATA
Cardiovascular risk factors, clinical presentation, angiographic features, and use of intravascular imaging (IVI) were recorded, along with the characteristics of the implanted stents/DEBs.
Follow-up data were obtained from clinical assessments, telephonic consultations, and/or via primary care physicians. The study was approved by an institutional review committee, and all patients provided informed consent for data collection and future publication in an anonymous fashion.
ENDPOINTS
The median follow-up period was 3 (interquartile range [IQR] 2.8-3.5) years. The following endpoints were considered: DOCE (a mutually exclusive endpoint including cardiac death, TLR and target vessel myocardial infarction [TVMI]), TLR, TVR, MI, TVMI, cardiac and all-cause deaths. Ultrathin DES, thin-strut DES and DEBs were compared for each endpoint. All comparisons were performed for the overall cohort and for patients with focal or diffuse ISR.
For DEBs, an unadjusted exploratory analysis was performed to assess endpoint incidences for the SeQuent DEB (B. Braun) versus other DEBs. All events were adjudicated according to current consensus17.
STATISTICAL ANALYSIS
Continuous variables are reported in terms of median and IQR and were compared with Kruskal-Wallis tests for multiple comparisons, with post hoc Dunn’s tests for pairwise comparisons. Categorical variables are presented as frequency (%) and were compared using the chi-square test for both multiple and post hoc pairwise comparisons. P-values from pairwise comparisons among the three groups of patients were adjusted with the Benjamini-Hochberg correction.
For each comparison, we performed propensity score matching (PSM) followed by a Cox regression model. PSM (1:1:1) was performed using the TriMatch R package (v. 0.9.9), while inverse probability weighting (IPW) was performed using WeightIt R package (v. 1.1.0; both R Foundation for Statistical Computing). For both adjustments, pretreatment covariates of clinical interest and/or with significant differences at univariate analysis were selected as independent variables, with ultrathin DES versus DEB versus thin-strut DES as categorical dependent variables. The quality of the matching and the weighting was assessed by comparing selected variables using the standardised mean difference, for which an absolute overall standardised difference greater than 10% is suggested to represent meaningful covariate imbalance.
A Cox regression model was then applied to (1) the original cohort; (2) the PSM-adjusted cohort; (3) the original cohort, weighting the model by IPW. Obtained results were reported in terms of hazard ratio (HR) with 95% confidence intervals (CIs). The difference of the survival distributions with respect to the DEB group was evaluated using a log-rank test, considering the Wald test to assess the significance of each estimated coefficient in the Cox model. All p-values<0.05 were considered to indicate statistical significance. All statistical analyses were performed using R software (v. 4.3.3; R Foundation for Statistical Computing).
Results
BASELINE FEATURES
A total of 1,367 patients were included in the pooled analysis, of whom 269 (19.7%) were treated with ultrathin-strut DES, 541 (39.5%) with thin-strut DES, and 557 (40.7%) with DEBs (Central illustration). Baseline and procedural features of the three unmatched cohorts are summarised in Table 1 and Table 2, respectively. The median age ranged from 67 (IQR: 60-74) years in the thin-strut DES group to 69 (IQR: 61-75) years in the ultrathin-strut DES group. Several significant differences in baseline features were observed (Table 1). Patients treated with ultrathin DES were more frequently male (80%) as compared with the other two groups (thin-strut DES: 68%; DEB: 73%). Furthermore, a significantly higher prevalence of patients with ST-segment elevation myocardial infarction was observed in the ultrathin DES population (16% vs 4% in the thin-strut DES vs 2% in the DEB groups; p<0.001). On the other hand, patients treated with thin-strut DES and DEBs were more likely to suffer from hypertension (87% and 91%, respectively) and hyperlipidaemia (87% and 85%, respectively) compared with those treated with ultrathin DES (77% with hypertension and 67% with hyperlipidaemia; p≤0.001). In addition, patients treated with DEBs were more likely to suffer from diabetes, chronic kidney disease and unstable angina (p≤0.03) (Table 1), with higher rates of previous coronary artery bypass graft cases (24% vs 14% in thin-strut DES vs 13% in ultrathin DES; p<0.001) and atrial fibrillation (18% vs 11% in thin-strut DES vs 6% in ultrathin DES; p≤0.001).
Procedural features are reported in Table 2. Patients treated with ultrathin DES were less frequently affected by 1-vessel disease as compared with the thin-strut DES and DEB groups (39% vs 59% in thin-strut DES vs 57% in DEB; p<0.001). A significantly higher prevalence of severe calcification at the target lesion was recorded among the ultrathin DES patients compared to both DEBs and thin-strut DES (16% vs 4% in thin-strut vs 4% in DEB; p<0.001), as well as a higher prevalence of thrombus compared to DEBs (6% vs 1% in DEB; p<0.001). The left anterior descending artery represented the most common vessel undergoing PCI in each of the three groups, although a significantly higher proportion of patients receiving DEBs (8%) or thin-strut DES (10%) were treated in the left main compared with ultrathin DES (1.5%; p<0.001). Patients in the ultrathin DES group had the highest prevalence of diffuse ISR (94% vs 34% and 35% in the thin-strut DES and DEB groups, respectively; p<0.001). Conversely, the prevalence of focal ISR was significantly higher among patients receiving thin-strut DES (40%) or DEBs (56%), compared with ultrathin DES (6%; p<0.001).
Regarding devices, in the ultrathin group most of the patients were treated with Orsiro (71%) and Supraflex (25%; Sahajanand Medical Technologies Pvt. Ltd). In the DEB group, SeQuent was the choice in 50% of patients, while Elutax (AR Baltic Medical) was used in 15%. In the thin-strut group, 43% were treated with XIENCE (Abbott), while 24% were treated with PROMUS (Boston Scientific) and 24% with Resolute (Medtronic) (Supplementary Table 1). The median length of ultrathin DES was 18 mm (IQR 15-26 mm), similar to that of thin-strut DES (median 18 mm [IQR 15-28 mm]), while the median length of DEBs was 20 mm (IQR 17-25 mm; allp>0.05). The median diameter of ultrathin DES was 3 mm (IQR 2.5-3.5 mm), as were those of thin-strut DES (3 mm [IQR 2.5-3.5 mm]) and DEBs (3 mm [IQR 2.5-3.5 mm]; p<0.05) (Supplementary Table 2).
Table 1. Baseline features.
| Ultrathin-strut DES (n=269) | Thin-strut DES (n=541) | DEB (n=557) | p-value (overall) | p-value (pairwise) | |
|---|---|---|---|---|---|
| Age, years | 69 (61-75) | 67 (60-74) | 67 (61-74) | 0.23 | U vs T=0.32U vs D=0.20T vs D=0.89 |
| Male | 214 (80) | 367 (68) | 404 (73) | 0.002* | U vs T=0.002*U vs D=0.06T vs D=0.10 |
| Hypertension | 208 (77) | 469 (87) | 507 (91) | <0.001* | U vs T=0.002*U vs D <0.001*T vs D=0.03* |
| Hyperlipidaemia | 181 (67) | 470 (87) | 472 (85) | <0.001* | U vs T <0.001*U vs D <0.001*T vs D=0.35 |
| Diabetes | 99 (37) | 200 (37) | 265 (48) | <0.001* | U vs T=1U vs D=0.007*T vs D=0.001* |
| Insulin-dependent DM | 31 (12) | 51 (9) | 109 (20) | <0.001* | U vs T=0.42U vs D=0.008*T vs D <0.001* |
| Smoker | 39 (14) | 107 (20) | 113 (20) | 0.11 | U vs T=0.12U vs D=0.12T vs D=0.89 |
| Previous MI | 175 (65) | 338 (62) | 347 (62) | 0.72 | U vs T=0.78U vs D=0.78T vs D=1 |
| Previous CABG | 34 (13) | 75 (14) | 131 (24) | <0.001* | U vs T=0.71U vs D <0.001*T vs D <0.001* |
| COPD | 31 (12) | 44 (8) | 48 (9) | 0.26 | U vs T=0.34U vs D=0.34T vs D=0.86 |
| PAD | 43 (16) | 69 (13) | 115 (21) | 0.002* | U vs T=0.25U vs D=0.20T vs D=0.002* |
| CKD | 48 (18) | 97 (18) | 151 (27) | <0.001* | U vs T=1U vs D=0.007*T vs D=0.001* |
| Dialysis | 0 (0) | 9 (2) | 11 (2) | 0.08 | U vs T=0.11U vs D=0.11T vs D=0.87 |
| LVEF (≥60%) | 37 (14) | 89 (16) | 125 (22) | 0.004* | U vs T=0.37U vs D=0.01*T vs D=0.02* |
| Atrial fibrillation | 16 (6) | 59 (11) | 102 (18) | <0.001* | U vs T=0.03*U vs D <0.001*T vs D=0.001* |
| CCS | 87 (32) | 240 (44) | 193 (35) | <0.001* | U vs T=0.002*U vs D=0.56T vs D=0.002* |
| UA | 70 (26) | 167 (31) | 210 (38) | 0.002* | U vs T=0.18U vs D=0.004*T vs D=0.03* |
| NSTEMI | 70 (26) | 113 (21) | 144 (26) | 0.14 | U vs T=0.18U vs D=1T vs D=0.18 |
| STEMI | 42 (16) | 21 (4) | 10 (2) | <0.001* | U vs T <0.001*U vs D <0.001*T vs D=0.06 |
| Data are expressed in terms of median and interquartile ranges for continuous variables or as number (%) for categorical variables. Three-group comparison p-values correspond to the Kruskal-Wallis and chi-square tests for numerical and nominal data, respectively. Post hoc pairwise comparison p-values correspond to Dunn’s and chi-square tests for numerical and nominal data, respectively, considering the Benjamini-Hochberg correction. *Statistical significance, i.e., p-value<0.05. CABG: coronary artery bypass graft; CCS: chronic coronary syndrome; CKD: chronic kidney disease; COPD: chronic obstructive pulmonary disease; D: DEB; DEB: drug-eluting balloon; DES: drug-eluting stent; DM: diabetes mellitus; LVEF: left ventricular ejection fraction; MI: myocardial infarction; NSTEMI: non-ST-elevation myocardial infarction; PAD: peripheral artery disease; STEMI: ST-elevation myocardial infarction; T: thin-strut DES; U: ultrathin-strut DES; UA: unstable angina | |||||
Table 2. Procedural features.
| Ultrathin-strut DES (n=269) | Thin-strut DES (n=541) | DEB (n=557) | p-value (overall) | p-value (pairwise) | |
|---|---|---|---|---|---|
| Angiography | |||||
| 1-vessel disease | 104 (39) | 321 (59) | 318 (57) | <0.001* | U vs T <0.001*U vs D <0.001*T vs D=0.49 |
| 2-vessel disease | 89 (33) | 156 (29) | 161 (29) | 0.4 | U vs T=0.38U vs D=0.38T vs D=1 |
| 3-vessel disease | 45 (17) | 61 (11) | 77 (14) | 0.09 | U vs T=0.12U vs D=0.32T vs D=0.32 |
| Bifurcation | 36 (13) | 96 (18) | 100 (18) | 0.22 | U vs T=0.21U vs D=0.21T vs D=0.99 |
| Thrombus | 17 (6) | 16 (3) | 7 (1) | <0.001* | U vs T=0.05U vs D <0.001*T vs D=0.08 |
| Severe calcification | 43 (16) | 22 (4) | 20 (4) | <0.001* | U vs T <0.001*U vs D <0.001*T vs D=0.80 |
| Stenosis, % | 79 (74-82) | 80 (80-90) | 80 (75-90) | <0.001* | U vs T <0.001*U vs D <0.001*T vs D=0.13 |
| Target lesion | |||||
| LMLM/LAD/LCx | 4 (1.5)0 (0) | 55 (10)7 (1) | 45 (8)35 (6) | <0.001* | U vs T <0.001*U vs D <0.001*T vs D=0.27 |
| LAD | 128 (48) | 219 (41) | 215 (39) | 0.12 | U vs T=0.15U vs D=0.15T vs D=0.78 |
| LCx/OM | 51 (19) | 83 (15) | 86 (15) | <0.001* | U vs T=0.23U vs D=0.005T vs D <0.001* |
| RCA | 81 (30) | 183 (32) | 175 (31) | 0.51 | U vs T=0.65U vs D=0.76T vs D=0.65 |
| Other (diag/RI) | 5 (2) | 4 (1) | 1 (0.2) | 0.03* | U vs T=0.35U vs D=0.08T vs D=0.35 |
| Original stent length, mm | 24 (22-26) | 21 (18-24) | 24 (21-26) | <0.001* | U vs T <0.001*U vs D=0.03*T vs D <0.001* |
| Original stent diameter, mm | 3 (3-3.5) | 3 (3-3.5) | 3 (3-3.5) | <0.001* | U vs T <0.001*U vs D=0.35T vs D <0.001* |
| Balloon predilation | |||||
| Length, mm | 17 (15-20) | 15 (13-20) | 15 (15-18) | <0.001* | U vs T <0.001*U vs D <0.001*T vs D=0.27 |
| Type of ISR | |||||
| Focal | 15 (6) | 218 (40) | 312 (56) | <0.001* | U vs T <0.001*U vs D <0.001*T vs D <0.001* |
| Diffuse | 252 (94) | 184 (34) | 196 (35) | <0.001* | U vs T <0.001*U vs D <0.001*T vs D=0.73 |
| Proliferative | 2 (1) | 134 (25) | 33 (6) | <0.001* | U vs T <0.001*U vs D=0.001*T vs D <0.001* |
| Occlusive | 0 (0) | 6 (1) | 16 (3) | 0.004* | U vs T=0.19U vs D=0.03*T vs D=0.09 |
| Intravascular imaging and DAPT | |||||
| IV imaging | 16 (6) | 23 (4) | 23 (4) | 0.46 | U vs T=0.56U vs D=0.56T vs D=1 |
| DAPT duration, months | 12 (11-12) | 12 (12-12) | 12 (6-12) | <0.001* | U vs T <0.001*U vs D=0.02*T vs D <0.001* |
| Data are expressed in terms of median and interquartile ranges for continuous variables or as number (%) for categorical variables. Three-group comparison p-values correspond to the Kruskal-Wallis and chi-square tests for numerical and nominal data, respectively. Post hoc pairwise comparison p-values correspond to Dunn’s and chi-square tests for numerical and nominal data, respectively, considering the Benjamini-Hochberg correction. *Statistical significance, i.e., p-value<0.05. D: DEB; DAPT: dual antiplatelet therapy; DEB: drug-eluting balloon; DES: drug-eluting stent; diag: diagonal branch; ISR: in-stent restenosis; IV: intravascular; LAD: left anterior descending artery; LCx: left circumflex artery; LM: left main; OM: obtuse marginal; RCA: right coronary artery; RI: ramus intermedius; T: thin-strut DES; U: ultrathin-strut DES | |||||
LONG-TERM OUTCOMES AFTER PROPENSITY SCORE ADJUSTMENT
In this study, both PSM and IPW were considered. Incidences of the endpoints before these adjustments, considering a median of 3 (IQR 2.8-3.5) years of follow-up, are reported in Supplementary Table 3 and described in Supplementary Appendix 2. After PSM adjustment, 174 patients per group were selected. Supplementary Table 4 and Supplementary Table 5 show the distributions of baseline and procedural features, while the corresponding standardised mean differences of the features selected for the matching are reported in Supplementary Table 6 and Supplementary Figure 1. A detailed description of the outcomes, displayed in Table 3, is provided in Supplementary Appendix 2. Briefly, we observed that in the PSM-adjusted overall cohort, ultrathin DES showed significantly lower incidences of DOCE, TLR and TVR with respect to both thin-strut DES and DEBs. This result is preserved in the diffuse ISR cohort, except for the comparison between ultrathin DES and DEBs for DOCE (p=0.09).
We then considered also a probability weighting approach to perform the Cox regression. Supplementary Table 7 shows the standardised mean difference of the covariates considered in the model before and after the probability weighting, while Supplementary Figure 2 displays the corresponding plot. An absolute overall standardised difference below 10% was preserved.
Cox analysis with IPW and comparison with the PSM approach and the unadjusted cohort are reported in Table 4, Table 5 and Table 6. Considering the IPW-adjusted models in the overall cohort (Table 4), ultrathin DES significantly reduced the risk of DOCE compared to DEBs (HR 0.353, 95% CI: 0.194-0.642; p<0.001), as did thin-strut DES (HR 0.645, 95% CI: 0.457-0.911; p=0.013). In contrast to thin-strut DES, ultrathin DES also significantly reduced the risk of both TLR (HR 0.184, 95% CI: 0.081-0.417; p<0.001) and TVR (HR 0.188, 95% CI: 0.093-0.379; p<0.001) compared to DEBs.
Regarding focal ISR, neither ultrathin DES nor thin-strut DES reduced the risk of DOCE or the other endpoints (Table 5). However, it is worth noticing that the Cox models for TLR, TVR and MI considering ultrathin- and thin-strut DES together were able to achieve significant log-rank test p-values (p=0.016, 0.004 and 0.042, respectively).
On the other hand, considering patients with diffuse ISR (Table 6), ultrathin DES significantly reduced the risk of DOCE (HR 0.364, 95% CI: 0.188-0.705; p=0.003), as did thin-strut DES (HR 0.602, 95% CI: 0.367-0.987; p=0.044), while reduction of both TLR and TVR was achieved only with ultrathin DES (HR 0.220, 95% CI: 0.091-0.531; p<0.001, and HR 0.241, 95% CI: 0.113-0.513; p<0.001, respectively). The results obtained with PSM confirmed the reduced risk of DOCE, TLR and TVR with ultrathin DES in the overall cohort (p≤0.02) (Table 4) and of TLR and TVR in the group of patients with diffuse ISR (p≤0.009) (Table 6). Unfortunately, due to the absence of events, it was not possible to assess the risk of focal ISR patients in the PSM-adjusted cohort.
Table 3. Propensity match-adjusted incidences of endpoints in the overall cohort, in patients with focal ISR and non-focal ISR.
| Overall patients | |||||
|---|---|---|---|---|---|
| Ultrathin-strut DES (N=174) | Thin-strut DES (N=174) | DEB (N=174) | p-value (overall) | p-value (pairwise) | |
| TLR | 4 (2) | 25 (14) | 28 (16) | <0.001* | U vs T <0.001*U vs D <0.001*T vs D=0.88 |
| DOCE | 12 (7) | 31 (18) | 28 (16) | 0.006* | U vs T=0.01*U vs D=0.02*T vs D=0.78 |
| TVR | 6 (3) | 30 (17) | 32 (18) | <0.001* | U vs T <0.001*U vs D <0.001*T vs D=0.89 |
| TVMI | 6 (3) | 8 (5) | 7 (4) | 0.86 | U vs T=1U vs D=1T vs D=1 |
| MI | 11 (6) | 26 (15) | 19 (11) | 0.03* | U vs T=0.04*U vs D=0.27T vs D=0.34 |
| CV death | 7 (4) | 8 (5) | 2 (1) | 0.15 | U vs T=1U vs D=0.27T vs D=0.27 |
| All-cause death | 13 (8) | 21 (12) | 5 (3) | 0.005* | U vs T=0.21U vs D=0.14T vs D=0.007* |
| Focal ISR | |||||
| Ultrathin-strut DES (N=13) | Thin-strut DES (N=79) | DEB (N=96) | p-value (overall) | p-value (pairwise) | |
| TLR | 0 (0) | 11 (14) | 17 (18) | 0.23 | U vs T=0.50U vs D=0.50T vs D=0.64 |
| DOCE | 1 (8) | 13 (16) | 16 (17) | 0.7 | U vs T=1U vs D=1T vs D=1 |
| TVR | 0 (0) | 15 (19) | 19 (20) | 0.21 | U vs T=0.28U vs D=0.28T vs D=1 |
| TVMI | 0 (0) | 4 (5) | 1 (1) | 0.21 | U vs T=1U vs D=1T vs D=0.77 |
| MI | 0 (0) | 14 (18) | 9 (9) | 0.09 | U vs T=0.33U vs D=0.54T vs D=0.33 |
| CV death | 1 (8) | 2 (3) | 1 (1) | 0.28 | U vs T=0.90U vs D=0.90T vs D=0.90 |
| All-cause death | 1 (8) | 11 (14) | 2 (2) | 0.01* | U vs T=0.86U vs D=0.86T vs D=0.02* |
| Non-focal ISR | |||||
| Ultrathin-strut DES (N=161) | Thin-strut DES (N=95) | DEB (N =78) | p-value (overall) | p-value (pairwise) | |
| TLR | 4 (3) | 14 (15) | 10 (13) | <0.001* | U vs T=0.002*U vs D=0.006*T vs D=0.89 |
| DOCE | 11 (7) | 18 (19) | 12 (15) | 0.01* | U vs T=0.02*U vs D=0.09T vs D=0.68 |
| TVR | 6 (4) | 15 (16) | 13 (17) | <0.001* | U vs T=0.002*U vs D=0.002*T vs D=1 |
| TVMI | 6 (4) | 4 (4) | 6 (8) | 0.38 | U vs T=1U vs D=0.77T vs D=0.77 |
| MI | 11 (7) | 12 (13) | 10 (13) | 0.2 | U vs T=0.30U vs D=0.30T vs D=1 |
| CV death | 6 (4) | 6 (6) | 1 (1) | 0.23 | U vs T=0.52U vs D=0.52T vs D=0.52 |
| All-cause death | 12 (8) | 10 (11) | 3 (4) | 0.25 | U vs T=0.54U vs D=0.54T vs D=0.51 |
| Data are expressed in terms of number (%). All the endpoints have no missing values. Three-group comparison p-values correspond to the chi-square tests. Post hoc pairwise comparison p-values correspond to the chi-square tests, considering the Benjamini-Hochberg correction. *Statistical significance, i.e., p-value<0.05. CV: cardiovascular; D: DEB; DEB: drug-eluting balloon; DES: drug-eluting stent; DOCE: device-oriented composite endpoint; ISR: in-stent restenosis; MI: myocardial infarction; T: thin-strut DES; TLR: target lesion revascularisation; TVMI: target vessel myocardial infarction; TVR: target vessel revascularisation; U: ultrathin-strut DES | |||||
Table 4. Results of the Cox proportional hazard models of the endpoints considering the overall cohort.
| Endpoint | LR test unadjusted cohort | LR test PSM-adjusted cohort | LR test IPW on overall cohort | Method( DEB as reference) | HR (95% CI) unadjusted cohort | Wald testunadjusted cohort | HR (95% CI) PSM-adjusted cohort | Wald test PSM-adjusted cohort | HR (95% CI) IPW-adjusted model | Wald test IPW-adjusted model |
|---|---|---|---|---|---|---|---|---|---|---|
| DOCE | 0.003* | 0.034* | <0.001* | Thin-strut DES | 0.695 (0.507-0.952) | 0.023* | 1.005 (0.603-1.676) | 0.984 | 0.645 (0.457-0.911) | 0.013* |
| Ultrathin DES | 0.472 (0.290-0.766) | 0.002* | 0.449 (0.228-0.883) | 0.020* | 0.353 (0.194-0.642) | <0.001* | ||||
| TLR | <0.001* | <0.001* | <0.001* | Thin-strut DES | 0.593 (0.415-0.847) | 0.004* | 0.851 (0.494-1.467) | 0.562 | 0.686 (0.407-1.157) | 0.157 |
| Ultrathin DES | 0.277 (0.143-0.536) | <0.001* | 0.156 (0.054-0.445) | <0.001* | 0.184 (0.081-0.417) | <0.001* | ||||
| TVR | <0.001* | <0.001* | <0.001* | Thin-strut DES | 0.629 (0.458-0.864) | 0.004* | 0.852 (0.518-1.403) | 0.529 | 0.706 (0.453-1.101) | 0.124 |
| Ultrathin DES | 0.315 (0.180-0.553) | <0.001* | 0.195 (0.082-0.467) | <0.001* | 0.188 (0.093-0.379) | <0.001* | ||||
| MI | 0.228 | 0.139 | 0.239 | Thin-strut DES | 0.821 (0.574-1.174) | 0.291 | 1.273 (0.704-2.300) | 0.424 | 1.167 (0.722-1.886) | 0.528 |
| Ultrathin DES | 0.657 (0.394-1.096) | 0.108 | 0.63 (0.300-1.324) | 0.223 | 0.673 (0.355-1.275) | 0.224 | ||||
| TVMI | 0.757 | 0.969 | 0.758 | Thin-strut DES | 0.8 (0.439-1.458) | 0.467 | 1.067 (0.387-2.945) | 0.9 | 1.465 (0.591-3.636) | 0.41 |
| Ultrathin DES | 0.955 (0.455-2.007) | 0.904 | 0.932 (0.313-2.774) | 0.899 | 0.993 (0.431-2.290) | 0.987 | ||||
| CV death | 0.531 | 0.173 | 0.596 | Thin-strut DES | 1.522 (0.723-3.202) | 0.269 | 3.457 (0.733-16.290) | 0.117 | 1.468 (0.683-3.155) | 0.325 |
| Ultrathin DES | 1.395 (0.541-3.599) | 0.491 | 3.94 (0.818-18.970) | 0.087 | 1.303 (0.444-3.825) | 0.63 | ||||
| All-cause death | 0.039* | 0.020* | 0.049* | Thin-strut DES | 1.875 (1.129-3.114) | 0.015 | 3.688 (1.390-9.788) | 0.009 | 2.523 (1.314-4.846) | 0.005* |
| Ultrathin DES | 1.813(0.972-3.380) | 0.061 | 2.978 (1.062-8.356) | 0.038 | 1.636 (0.818-3.271) | 0.164 | ||||
| For each model, the log-rank (LR) test p-value, hazard ratio (HR) with 95% confidence intervals (CIs) and Wald test p-values are reported. *Statistical significance, i.e., p-value<0.05. CV: cardiovascular; DEB: drug-eluting balloon; DES: drug-eluting stent; DOCE: device-oriented composite endpoint; IPW: inverse probability weighting; MI: myocardial infarction; PSM: propensity score matching; TLR: target lesion revascularisation; TVMI: target vessel myocardial infarction; TVR: target vessel revascularisation; ultrathin DES: ultrathin-strut DES | ||||||||||
Table 5. Results of the Cox proportional hazard models of the endpoints considering the patients with focal ISR.
| Endpoint | LR test unadjusted cohort | LR test PSM-adjusted cohort | LR test IPW on overall cohort | Method (DEB as reference) | HR (95% CI) unadjusted cohort | Wald test unadjusted cohort | HR (95% CI) PSM-adjusted cohort | Wald test PSM-adjusted cohort | HR (95% CI) IPW-adjusted model | Wald test IPW-adjusted model |
|---|---|---|---|---|---|---|---|---|---|---|
| DOCE | 0.347 | 0.602 | 0.554 | Thin-strut DES | 0.706 (0.438-1.139) | 0.154 | 0.928 (0.446-1.929) | 0.841 | 0.767 (0.470-1.253) | 0.29 |
| Ultrathin DES | 0.742 (0.180-3.053) | 0.679 | 0.368 (0.049-2.778) | 0.333 | 0.926 (0.187-4.590) | 0.925 | ||||
| TLR | 0.171 | - | 0.016* | Thin-strut DES | 0.634 (0.376-1.068) | 0.087 | - | - | 0.683 (0.398-1.172) | 0.167 |
| Ultrathin DES | 0.417 (0.057-3.027) | 0.387 | - | - | 0.163 (0.020-1.327) | 0.09 | ||||
| TVR | 0.261 | - | 0.004* | Thin-strut DES | 0.747 (0.477-1.169) | 0.202 | - | - | 0.821 (0.517-1.303) | 0.403 |
| Ultrathin DES | 0.336 (0.046-2.430) | 0.28 | - | - | 0.131 (0.016-1.055) | 0.056 | ||||
| MI | 0.539 | - | 0.042* | Thin-strut DES | 1.277 (0.763-2.137) | 0.352 | - | - | 1.392 (0.821-2.358) | 0.219 |
| Ultrathin DES | 0.619 (0.084-4.537) | 0.637 | - | - | 0.244 (0.030-1.993) | 0.188 | ||||
| TVMI | 0.434 | - | 0.395 | Thin-strut DES | 1.709 (0.675-4.332) | 0.258 | - | - | 2.004 (0.772-5.203) | 0.153 |
| Ultrathin DES | 2.454 (0.307-19.629) | 0.397 | - | - | 0.947 (0.107-8.380) | 0.961 | ||||
| CV death | 0.49 | 0.356 | 0.515 | Thin-strut DES | 0.749 (0.219-2.562) | 0.645 | 2.265 (0.205-24.990) | 0.504 | 0.631 (0.185-2.157) | 0.463 |
| Ultrathin DES | 2.675 (0.329-21.768) | 0.358 | 6.36 (0.398-101.760) | 0.191 | 5.403 (0.787-37.104) | 0.086 | ||||
| All-cause death | 0.136 | 0.025* | 0.182 | Thin-strut DES | 2.114 (0.998-4.482) | 0.051 | 6.168 (1.366-27.860) | 0.018* | 2.013 (0.499-4.310) | 0.072 |
| Ultrathin DES | 1.666 (0.215-12.913) | 0.625 | 3.125 (0.283-34.510) | 0.352 | 3.703 (0.270-25.130) | 0.18 | ||||
| For each model, log-rank (LR) test p-value, hazard ratio (HR) with 95% confidence intervals (CIs) and Wald test p-values are reported. *Statistical significance, i.e., p-value <0.05. CV: cardiovascular; DEB: drug-eluting balloon; DES: drug-eluting stent; DOCE: device-oriented composite endpoint; IPW: inverse probability weighting; ISR: in-stent restenosis; MI: myocardial infarction; PSM: propensity score matching; TLR: target lesion revascularisation; TVMI: target vessel myocardial infarction; TVR: target vessel revascularisation; ultrathin DES: ultrathin-strut DES | ||||||||||
Table 6. Results of the Cox proportional hazard models of the endpoints considering the diffuse ISR patients.
| Endpoint | LR test unadjusted cohort | LR test PSM-adjusted cohort | LR test IPW on overall cohort | Method (DEB as reference) | HR (95% CI) unadjusted cohort | Wald test unadjusted cohort | HR (95% CI) PSM-adjusted cohort | Wald test PSM-adjusted cohort | HR (95% CI) IPW-adjusted model | Wald test IPW-adjusted model |
|---|---|---|---|---|---|---|---|---|---|---|
| DOCE | 0.006* | 0.074 | 0.013* | Thin-strut DES | 0.661 (0.430-1.015) | 0.059 | 1.089 (0.524-2.263) | 0.819 | 0.602 (0.367-0.987) | 0.044* |
| Ultrathin DES | 0.42 (0.241-0.731) | 0.002* | 0.482 (0.213-1.093) | 0.081 | 0.364 (0.188-0.705) | 0.003* | ||||
| TLR | <0.001* | 0.005* | 0.002* | Thin-strut DES | 0.564 (0.342-0.929) | <0.001* | 1.061 (0.471-2.390) | 0.887 | 0.749 (0.328-1.710) | 0.492 |
| Ultrathin DES | 0.262 (0.125-0.548) | <0.001* | 0.214 (0.067-0.681) | 0.009 | 0.22 (0.091-0.531) | <0.001* | ||||
| TVR | <0.001* | 0.005* | <0.001* | Thin-strut DES | 0.553 (0.351-0.872) | <0.001* | 0.848 (0.403-1.783) | 0.663 | 0.738 (0.353-1.541) | 0.418 |
| Ultrathin DES | 0.311 (0.166-0.582) | <0.001* | 0.243 (0.092-0.638) | 0.004* | 0.241 (0.113-0.513) | <0.001* | ||||
| MI | 0.020* | 0.433 | 0.417 | Thin-strut DES | 0.541 (0.329-0.890) | 0.016* | 0.868 (0.375-0.741) | 0.741 | 1.144 (0.544-2.406) | 0.722 |
| Ultrathin DES | 0.53 (0.299-0.938) | 0.029* | 0.585 (0.249-1.379) | 0.221 | 0.698 (0.359-1.354) | 0.287 | ||||
| TVMI | 0.087 | 0.42 | 0.837 | Thin-strut DES | 0.421 (0.189-0.940) | 0.035* | 0.489 (0.138-1.737) | 0.269 | 1.335 (0.360-4.952) | 0.666 |
| Ultrathin DES | 0.599 (0.262-1.368) | 0.224 | 0.532 (0.171-1.650) | 0.274 | 0.852 (0.340-2.131) | 0.731 | ||||
| CV death | 0.284 | 0.381 | 0.268 | Thin-strut DES | 2.289 (0.758-6.912) | 0.142 | 4.067 (0.489-33.820) | 0.194 | 2.318 (0.713-7.538) | 0.162 |
| Ultrathin DES | 1.51 (0.426-5.351) | 0.523 | 3.364 (0.405-27.950) | 0.261 | 1.385 (0.352-5.453) | 0.642 | ||||
| All-cause death | 0.376 | 0.384 | 0.281 | Thin-strut DES | 1.605 (0.801-3.218) | 0.183 | 2.288 (0.629-8.321) | 0.209 | 2.449 (0.935-6.418) | 0.068 |
| Ultrathin DES | 0.451 (0.735-3.351) | 0.244 | 2.288 (0.645-8.110) | 0.2 | 1.448 (0.6340-3.306) | 0.38 | ||||
| For each model, log-rank (LR) test p-value, hazard ratio (HR) with 95% confidence intervals (CI) and Wald test p-values are reported. *Statistical significance, i.e., p-value<0.05. CV death: cardiovascular death; DEB: drug-eluting balloon; DES: drug-eluting stent; DOCE: device-oriented composite endpoint; IPW: inverse probability weighting; ISR: in-stent restenosis; MI: myocardial infarction; PSM: propensity score matching; TLR: target lesion revascularisation; TVMI: target vessel myocardial infarction; TVR: target vessel revascularisation; ultrathin DES: ultrathin-strut DES | ||||||||||
Discussion
In this retrospective registry study, we evaluated the long-term outcomes of ultrathin DES compared to thin-strut DES and DEBs in patients with their first event of DES-ISR in native coronary disease. Our main findings can be summarised as follows (Central illustration):
– Overall, ultrathin DES were associated with a lower risk of TLR, DOCE and TVR compared to DEBs.
– The results of the adjusted analysis demonstrated that ultrathin DES were associated with a risk reduction of TLR and TVR by more than two-thirds, and they more than halved the risk of DOCE compared to DEBs in cases of diffuse DES-ISR over a midterm follow-up.
The observed incidence of TLR ranged from 4% with ultrathin DES to 14% with DEBs at 3 years. These rates underscore the persistent challenge of managing DES-ISR, with outcomes substantially worse than those typically expected for de novo coronary lesions. For instance, in the BIO-RESORT trial, 3-year TLR rates were reported as 2.9%, 3.3%, and 3.8% for ultrathin sirolimus-eluting DES and second-generation everolimus or zotarolimus DES, respectively18. Similarly, the Swedish Coronary Angiography and Angioplasty Registry (SCAAR) reported a 5.5% TLR rate at 4 years for DEB-treated de novo lesions19. These figures highlight that DES-ISR remains a significant clinical challenge, with higher TLR rates compared to primary PCI for de novo lesions.
Stent strut thickness and polymer permanency are known to influence endothelial inflammation, leading to neointimal hyperplasia and restenosis1. Despite this, there is limited evidence on the efficacy of ultrathin DES with biodegradable polymers specifically in the context of DES-ISR. The lack of evidence may stem from concerns that stents with ultrathin struts may provide insufficient radial force for the rigid, plaque-loaded coronary lesions frequently seen in ISR. While reassuring data from RCTs have led to the widespread adoption of ultrathin DES, it is pertinent to acknowledge that these devices may yield less favourable outcomes in heavily calcified lesions, requiring robust scaffolding for optimal treatment outcomes20. However, such a concern would be even greater when treating such lesions with DEBs.
The implementation of DEBs as an alternative to multiple stent layers is based on the notion that avoiding additional stent layers can reduce adverse clinical outcomes21. Nonetheless, evidence indicates that DEBs might have inferior late angiographic outcomes compared to newer DES. For example, the RIBS IV trial, which compared DEBs with thin-strut everolimus-eluting stents (EES), found that EES resulted in a larger minimal lumen diameter and lower binary restenosis rates. At 1-year follow-up, EES were associated with significantly lower TLR rates compared to DEBs4. This finding is supported by a large patient-level meta-analysis, which found DEBs to be significantly less effective than repeated DES implantation in reducing TLR (20.3% vs 13.4%, HR 1.58, 95% CI: 1.16-2.13)22. Two network meta-analyses also placed DEBs as the second most effective treatment for ISR after repeated PCI with conventional, thin-strut second-generation EES67. Thus, while DEBs have theoretical advantages, the current evidence supports repeated DES implantation as the superior treatment for DES-ISR. While our results confirm existing data suggesting that DES (both second-generation thin-strut and ultrathin-strut) are overall associated with more favourable outcomes compared to DEBs, they also suggest that ultrathin DES may potentially represent the ideal therapy for the first episode of DES-ISR. Ultrathin DES may maximise luminal gain by providing more adequate scaffolding compared to DEBs in heavily plaque-loaded lesions, with suboptimal results after predilation. Additionally, their reduced strut thickness would mitigate the endothelial inflammatory response and limit neointimal proliferation compared to second-generation DES8. Nevertheless, our study’s limitations include a small sample size and limited use of IVI, which affect the assessment of calcification and neoatherosclerosis. Given the reasonable concern that ultrathin-strut DES might offer insufficient radial force, our results should be considered hypothesis-generating and warrant further investigation in larger, well-powered trials. We acknowledge that, consistent with previous studies and meta-analyses comparing DES platforms, the thickness of the polymer was not included in the analysis based on DES strut thickness. Previous research highlights that differences in strut thickness, rather than specific stent features, are primary drivers of observed outcome differences2324. The ultrathin DES in our study all use sirolimus-eluting bioresorbable polymers. While polymer type and drug elution might influence outcomes, previous trials and meta-analyses suggest that clinical outcomes are not consistently improved with bioresorbable polymers compared to durable ones2324. Furthermore, no significant differences in 1-year outcomes have been observed between bioabsorbable polymer-based EES and durable polymer-based EES25. This suggests that, while polymer composition is important, strut thickness may be a more crucial factor in determining safety outcomes, provided the polymer is biocompatible and minimally inflammatory.
The use of IVI in guiding ISR treatment is endorsed by expert consensus, given its ability to accurately identify mechanical and biological causes of restenosis32627. Despite this, our analysis revealed disappointingly low IVI utilisation in this multicentre registry, which is consistent with prior reports28. Potential reasons for this underutilisation include cost, limited operator experience, and workflow challenges. While our analysis does not discourage the use of IVI, it provides valuable insights into DES-ISR management in scenarios where IVI is unavailable. The angiographic pattern of restenosis, as classified by Mehran et al, has been linked to different outcomes post-PCI, with TLR rates increasing from type I (focal restenosis) to type IV (occlusive restenosis), ranging from 19% to 83%15. It has been suggested that the initial angiographic pattern may predict the future pattern of recurrent ISR, with diffuse ISR often recurring as diffuse or occlusive and focal ISR as focal29. Based on these findings, expert consensus suggests repeated DES implantation for more aggressive scenarios like diffuse or occlusive ISR, while DEBs may be considered for focal ISR89. Our data support these recommendations, suggesting that focal restenosis might be adequately addressed with DEBs, while diffuse restenosis may require repeated stenting. Diffuse DES-ISR might indicate resistance to antiproliferative therapy5. Our findings suggest that while drug delivery alone may be partially effective, repeated DES implantation might provide better vessel scaffolding compared to DEBs, particularly in the early years. These results are hypothesis-generating and require confirmation in larger studies with IVI.
Lastly, although device differences primarily impact device-related endpoints rather than survival, even non-emergent TLR can affect long-term survival30. Therefore, patient age and long-term restenosis risk should be considered when determining the treatment strategy, potentially including surgical revascularisation where appropriate.
Limitations
Our study presents a retrospective analysis, which inherently carries limitations. Despite the relatively large sample size, the low event rate may have limited the ability to observe significant differences in outcomes according to treatment strategies. Despite extensive adjustment using propensity scores and Cox multivariable analysis, the impact of unknown and unmeasured variables cannot be excluded. In particular, as a consequence of the non-randomised design, we acknowledge that cases of procedural crossover during the index procedures were not assessed. Specifically, patients with ISR initially considered for DEB therapy but obtaining suboptimal predilation results might have been subsequently treated with DES. This could result in only the more favourable cases being treated with DEBs, which has variable implications on the interpretation of our findings.
Although the 70 μm cutoff was chosen to be consistent with existing literature, this threshold was previously selected for convenience in meta-analyses of aggregate-level data. As such, we acknowledge that the use of a 70 μm cutoff to categorise ultrathin DES in this study was somewhat arbitrary, with variable implications for the results.
This study is limited by its insufficient power to detect clinical endpoint differences, particularly for smaller subgroup analyses. The use of propensity score matching, while improving group comparability, further reduced statistical power, especially in the focal ISR subgroup with only 15 cases of ultrathin DES. Consequently, estimating the HR for TLR, TVR, MI, and TVMI in the propensity score-matched cohort was not feasible due to low event numbers. However, results from Cox regression with IPW confirmed significant differences for TLR, DOCE, and TVR in the overall cohort between ultrathin DES and DEBs, consistent with the PSM results. For diffuse ISR, significant differences were observed for TLR, TVR, and DOCE with IPW (p=0.003) compared to PSM (p=0.081). In focal ISR, although IPW-adjusted Cox models showed significant log-rank test p-values for TLR and TVR (p=0.016 and p=0.004), the HRs for both DES types were not significant, indicating insufficient evidence of risk differentiation.
The analysis of focal versus diffuse ISR reduced statistical power but aimed to identify treatment effect trends across subgroups. Another limitation was the low utilisation of IVI in the registry, affecting its analytical value.
While it is acknowledged that changes in stent iteration may introduce variability in strut thickness, our study primarily aimed to compare DES of different generations with distinct characteristics. While a reduction in strut thickness is known to be associated with improved outcomes, specific analyses accounting for stent iteration (e.g., from Resolute Integrity to Resolute Onyx) were not performed in this study, as this would extend beyond the scope of our investigation. Similarly, the impact of differences in polymer durability (i.e., durable or bioresorbable), composition, distribution (circumferential uniform, circumferential not uniform, or abluminal), and thickness were not addressed in the study.
Lastly, the different enrolment periods might have introduced variability due to evolving techniques and expertise, though only 17% of patients were enrolled before 2015, with no significant differences in intravascular imaging use.
Conclusions
This analysis of a large real-world registry revealed that in the context of diffuse DES-ISR, ultrathin DES could be associated with lower rates of TLR, DOCE and TVR compared to thin-strut DES and DEBs. No significant differences were observed among the three platforms with respect to other secondary endpoints nor in focal DES-ISR. These findings should be regarded as hypothesis-generating and require confirmation through appropriately powered future randomised controlled trials.
Impact on daily practice
The treatment of drug-eluting stent (DES) in-stent restenosis (ISR) typically involves repeated DES implantation or use of a drug-eluting balloon (DEB), with current evidence favouring DES over DEBs in terms of target lesion revascularisation (TLR). Advances in DES design, notably a reduced strut thickness, could decrease subsequent revascularisations. However, the efficacy of ultrathin-strut DES (ultrathin DES; strut ≤70 μm) for DES-ISR remains unexplored. Our findings reveal that ultrathin DES may be associated with a lower TLR risk compared with second-generation thin-strut DES or DEB in diffuse DES restenosis. For focal DES restenosis, the devices could instead yield comparable outcomes. Randomised controlled trials investigating the best treatment in the context of DES-ISR, using the latest-generation ultrathin DES as the standard of care, are warranted.
Guest Editor
This paper was guest edited by Franz-Josef Neumann, MD; Department of Cardiology and Angiology II, University Heart Center Freiburg - Bad Krozingen, Bad Krozingen, Germany.
Conflict of interest statement
C. Von Birgelen indicated previous institutional research funds to the Research Department of Thorax Centrum Twente from Abbott, Biotronik, Boston Scientific, and Medtronic. G. Patti indicated speaker/consultant fees from Abbott, AstraZeneca, Sanofi, Amgen, Menarini, Bayer, Pfizer, BMS, Daiichi Sankyo, PIAM, Malesci, Leadiant Biosciences, Chiesi, Medtronic, MSD, Boehringer Ingelheim, and Servier, outside the submitted work. G. Campo reports grants from SMT, Siemens, and Medis Medical Imaging Systems, outside the submitted work. D. Capodanno reports personal fees from Abbott, Novo Nordisk, Sanofi, Terumo, and Chiesi; institutional fees from Medtronic; participation on a data safety monitoring board or advisory board with MedAlliance, all outside the submitted work. G.M. De Ferrari indicated consulting fees from Amgen and Merck, outside the submitted work. The other authors have no conflicts of interest to declare. The Guest Editor reports consultancy fees from Novartis and Meril; speaker honoraria from Boston Scientific, Amgen, Daiichi Sankyo, and Meril; reports speaker honoraria paid to his institution from BMS/Pfizer, Daiichi Sankyo, Boston Scientific, Siemens, and Amgen; and research grants paid to his institution from Boston Scientific and Abbott.
Supplementary data
To read the full content of this article, please download the PDF.