Abstract
Background: Compared with thin-strut durable-polymer drug-eluting stents (DP-DES), ultrathin-strut biodegradable-polymer sirolimus-eluting stents (BP-SES) improve stent-related clinical outcomes in patients undergoing percutaneous coronary intervention (PCI). Reduced stent strut thickness is hypothesised to underlie these benefits, but this conjecture remains unproven.
Aims: We aimed to assess the impact of strut thickness on stent healing and clinical outcomes between ultrathin-strut and thin-strut BP-SES.
Methods: First, we performed a preclinical study of 8 rabbits implanted with non-overlapping thin-strut (diameter/thickness 3.5 mm/80 μm) and ultrathin-strut (diameter/thickness 3.0 mm/60 μm) BP-SES in the infrarenal aorta. On day 7, the rabbits underwent intravascular near-infrared fluorescence optical coherence tomography (NIRF-OCT) molecular-structural imaging of fibrin deposition and stent tissue coverage, followed by histopathological analysis. Second, we conducted an individual data pooled analysis of patients enrolled in the BIOSCIENCE and BIOSTEMI randomised PCI trials treated with ultrathin-strut (n=282) or thin-strut (n=222) BP-SES. The primary endpoint was target lesion failure (TLF) at 1-year follow-up, with a landmark analysis at 30 days.
Results: NIRF-OCT image analyses revealed that ultrathin-strut and thin-strut BP-SES exhibited similar stent fibrin deposition (p=0.49) and percentage of uncovered stent struts (p=0.63). Histopathological assessments corroÂborated these findings. In 504 pooled randomised trial patients, TLF rates were similar for those treated with ultrathin-strut or thin-strut BP-SES at 30-day (2.5% vs 1.8%; p=0.62) and 1-year follow-up (4.3% vs 4.7%; p=0.88).
Conclusions: Ultrathin-strut and thin-strut BP-SES demonstrate similar early arterial healing profiles and 30-day and 1-year clinical outcomes.
Compared with bare metal stents (BMS), drug-eluting stents (DES) improve clinical outcomes in patients undergoing percutaneous coronary intervention (PCI)1. Moreover, newer-generation DES offer improved stent designs, including reduced metallic stent platform strut thickness, and are associated with lower stent thrombosis and target lesion revascularisation (TLR) rates2. In particular, stent strut thickness has been a focus of newer stent designs, as stents with thinner struts have historically outperformed stents with thicker struts from the BMS and first-generation DES eras34.
After years of similar clinical outcomes among second-generation DES, newer-generation biodegradable-polymer sirolimus-eluting stents (BP-SES) containing an ultrathin-strut stent platform for certain stent sizes have demonstrated superior clinical outcomes compared to contemporary DES56789. These results were driven by the BIOFLOW-V and BIOSTEMI randomised controlled trials (RCTs), which compared BP-SES (Orsiro [Biotronik]; ultrathin-strut thickness of 60 μm for 3.0 mm diameter stent, or thin-strut thickness of 80 μm for 3.5 mm diameter stent) to durable-polymer everolimus-eluting stents (DP-EES; XIENCE [Abbott]; thin-strut thickness of 81 μm for all stent diameters). However, the specific impact of ultrathin stent strut thickness remains unclear, as a hypothesis-generating subgroup analysis did not show superior outcomes for the ultrathin-strut stent subgroup7.
In the BIOSTEMI trial, the clinical benefits of BP-SES over DP-EES emerged within 30 days5, suggesting the potential for BP-SES to exhibit improved stent healing early on after implantation, possibly related to the ultrathin-strut thickness, proving a possible mechanism of clinical benefit. Yet mechanisms underlying the favourable outcomes with ultrathin-strut DES remain unclear, because additional factors beyond strut thickness − including stent design, stent polymer, and different sirolimus analogues − might be operative.
In this experimental and clinical study, we investigated the specific role of stent strut thickness on in vivo stent healing in rabbits as well as its role on clinical outcomes in BP-SES patients undergoing PCI. To specifically investigate the role of stent strut thickness without changing the underlying polymer, stent design, or sirolimus analogue, we assessed stent healing in a single stent platform with non-overlapping implanted BP-SES of 3.0 mm diameter (Orsiro; 60 μm strut thickness, ultrathin-strut) and 3.5 mm diameter (Orsiro; 80 μm strut thickness, thin-strut). To assess stent healing in vivo we utilised intravascular near-infrared fluorescence (NIRF) optical coherence tomography (OCT) molecular-structural fibrin imaging10 and histopathological analysis. Next, to assess the clinical impact of ultrathin-strut versus thin-strut BP-SES, we performed a patient-level pooled analysis of PCI patients in the BIOSCIENCE and BIOSTEMI RCTs511. After stratifying patients by stent diameter (either 3.0 mm ultrathin-strut or 3.5 mm thin-strut BP-SES), we assessed target lesion failure (TLF) rates at 30 days and 1 year.
Methods
IN VIVO RABBIT STUDY OF ULTRATHIN-STRUT VERSUS THIN-STRUT BP-SES STENT HEALING
The Institutional Animal Care and Use Committee at Massachusetts General Hospital approved all animal studies (2013N000015). The study design is illustrated in Figure 1. After balloon injury, a BP-SES 3.5 mm (80 μm, Orsiro) and a BP-SES 3.0 mm (60 μm, Orsiro) were deployed with sufficient pressure to achieve apposition in the abdominal aorta of the New Zealand white rabbits (n=8). On day 7, to assess in vivo fibrin-specific deposition on stent struts, the rabbits underwent NIRF-OCT imaging with the fibrin-targeted NIRF molecular imaging agent FTP11-CyAm710. The rabbits were sacrificed, and the stented vessels were carefully resected, followed by ex vivo imaging and histological analysis. Full details are described in Supplementary Appendix 1.
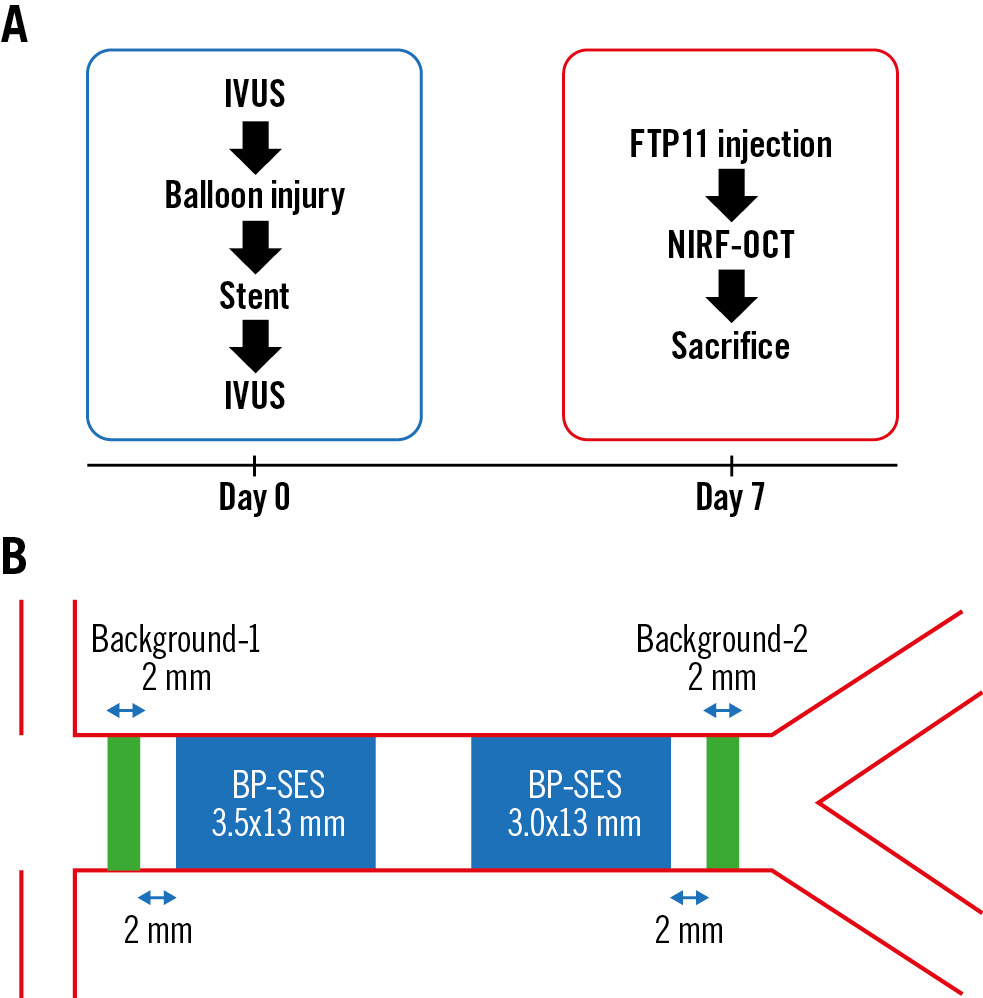
Figure 1. Preclinical study design comparing subacute stent-healing features of ultrathin-strut and thin-strut BP-SES. A) Eight rabbits underwent implantation of non-overlapping thin-strut 3.5x13 mm and ultrathin-strut 3.0x13 mm BP-SES in the rabbit aorta and postdilated with a 3.5 mm non-compliant balloon to obtain a stent expansion ratio of 1.1-1.2 under IVUS guidance. On day 7, intravascular in vivo NIRF-OCT assessed stent healing 2 hours after intravenous FTP11-CyAm7 fibrin molecular imaging agent injection. B) The NIRF target-to-background ratio (TBR) was calculated for each stent, with the background signal averaged between at the stent proximal and distal zones 2 mm away from the stents, as indicated in green. BP-SES: biodegradable-polymer sirolimus-eluting stent; IVUS: intravascular ultrasound; NIRF: near-infrared; OCT: optical coherence tomography
POOLED ANALYSIS OF INDIVIDUAL PATIENT DATA FROM THE BIOSCIENCE AND BIOSTEMI TRIALS
We performed an individual patient data pooled analysis from PCI patients enrolled in the BIOSCIENCE11 (ClinicalTrials.gov: NCT01443104; 2,119 patients: 1,063 BP-SES and 1,056 DP-EES) and BIOSTEMI5 (ClinicalTrials.gov: NCT02579031; 1,300 patients: 649 BP-SES and 651 DP-EES) RCTs, which compared 1-year clinical outcomes after BP-SES versus DP-EES implantation with respect to the primary endpoint of TLF at 1-year follow-up, stratified by 3.0 mm or 3.5 mm stent diameter, and included a landmark analysis at 30 days. To account for differences in baseline clinical presentation between patients included in BIOSCIENCE and those included in BIOSTEMI that might influence clinical outcomes, we performed a stratification reporting clinical outcomes from each individual (BIOSCIENCE and BIOSTEMI) randomised trial (Supplementary Appendix 1).
Results
EXPERIMENTAL SUBACUTE STENT HEALING IN THIN-STRUT VERSUS ULTRATHIN-STRUT BP-SES
As stent strut thickness modulates stent healing34, we assessed stent healing between ultrathin-strut and thin-strut BP-SES stents in rabbits at day 7, which corresponds approximately to the clinical timepoint of 1 month in humans12. We compared in vivo healing of BP-SES with diameters of 3.5 mm and 3.0 mm implanted concomitantly in 8 rabbits by using NIRF-OCT molecular imaging of fibrin and microstructural imaging of tissue coverage of the stent struts (Figure 1B).
On the day of stent implantation, intravascular ultrasound (IVUS) images demonstrated a higher stent area in the 3.5 mm BP-SES group but similar stent expansion ratios for both stent sizes (p=0.91) (Table 1). On day 7, in vivo NIRF-OCT demonstrated that the NIRF fibrin signal trended higher at the stent edge compared to the middle stent segment, for both BP-SES stent groups (Figure 2A, Figure 2B). When comparing the day 7 NIRF fibrin signal target-to-background ratio (TBR) between ultrathin-strut and thin-strut BP-SES, the fibrin deposition signal did not differ significantly (32 images per stent analysed; p=0.50) (Figure 2C). Likewise, the average of NIRF fibrin intensity per stent was also similar between the ultrathin-strut and thin-strut BP-SES groups (p=0.49) (Figure 2D).
Ex vivo fluorescence microscopy of longitudinally opened stents confirmed that stent struts exhibiting NIRF fibrin deposition corresponded to fibrin-positive regions on in vivo NIRF-OCT images (Supplementary Figure 1). The overall findings revealed similar in vivo fibrin deposition on ultrathin-strut and thin-strut BP-SES at 7 days.
Tissue coverage of stents was assessed using OCT, as previously performed10. On a per-strut analysis (n=260±26 struts/stent), OCT demonstrated a similarly low percentage of covered struts for both ultrathin-strut and thin-strut BP-SES (p=0.91) (Table 1, Figure 2E). Covered stent struts on OCT axial images were frequently NIRF fibrin positive (Supplementary Figure 2), consistent with prior studies demonstrating that early tissue coverage after DES placement is fibrin rich10. Histological assessment demonstrated that the NIRF signal colocalised with the fibrin, as detected by haematoxylin and eosin (H&E) and Carstairs’ staining (Figure 3). Histological evaluation revealed similar amounts of fibrin deposition among thin-strut and ultrathin-strut BP-SES.
Table 1. IVUS and NIRF-OCT intravascular imaging measures of stent expansion, fibrin, and coverage in BP-SES in rabbits.
| BP-SES 3.0 mm (n=8) |
BP-SES 3.5 mm (n=8) |
p-value | |
|---|---|---|---|
| D0 average stent diameter, mm | 3.31±0.09 | 3.60±0.08 | <0.001 |
| D0 average stent area, mm2 | 8.77±0.42 | 10.37±0.47 | <0.001 |
| D0 average stent expansion ratio | 1.11±0.03 | 1.12±0.03 | 0.91 |
| D7 average stent diameter, mm | 3.42±0.11 | 3.68±0.13 | <0.01 |
| D7 average stent area, mm2 | 9.76±0.68 | 11.40±1.01 | <0.01 |
| D7 average stent expansion ratio | 1.15±0.03 | 1.14±0.03 | 0.50 |
| D7 averageOCT-covered struts, % | 2.60±0.94 | 2.53±0.85 | 0.88 |
| D7 averageOCT-uncovered struts, % | 97.3±0.87 | 97.5±0.80 | 0.63 |
| D7 average NIRF fibrin, nm | 0.61±0.21 | 0.52±0.18 | 0.43 |
| D7 average NIRF fibrin TBR | 1.57±0.80 | 1.31±0.58 | 0.49 |
| Data are presented as mean±SD. BP-SES: biodegradable-polymer sirolimus-eluting stents; D0: day 0; D7: day 7; IVUS: intravascular ultrasound; NIRF: near-infrared fluorescence; OCT: optical coherence tomography; SD: standard deviation; TBR: target-to-background ratio | |||
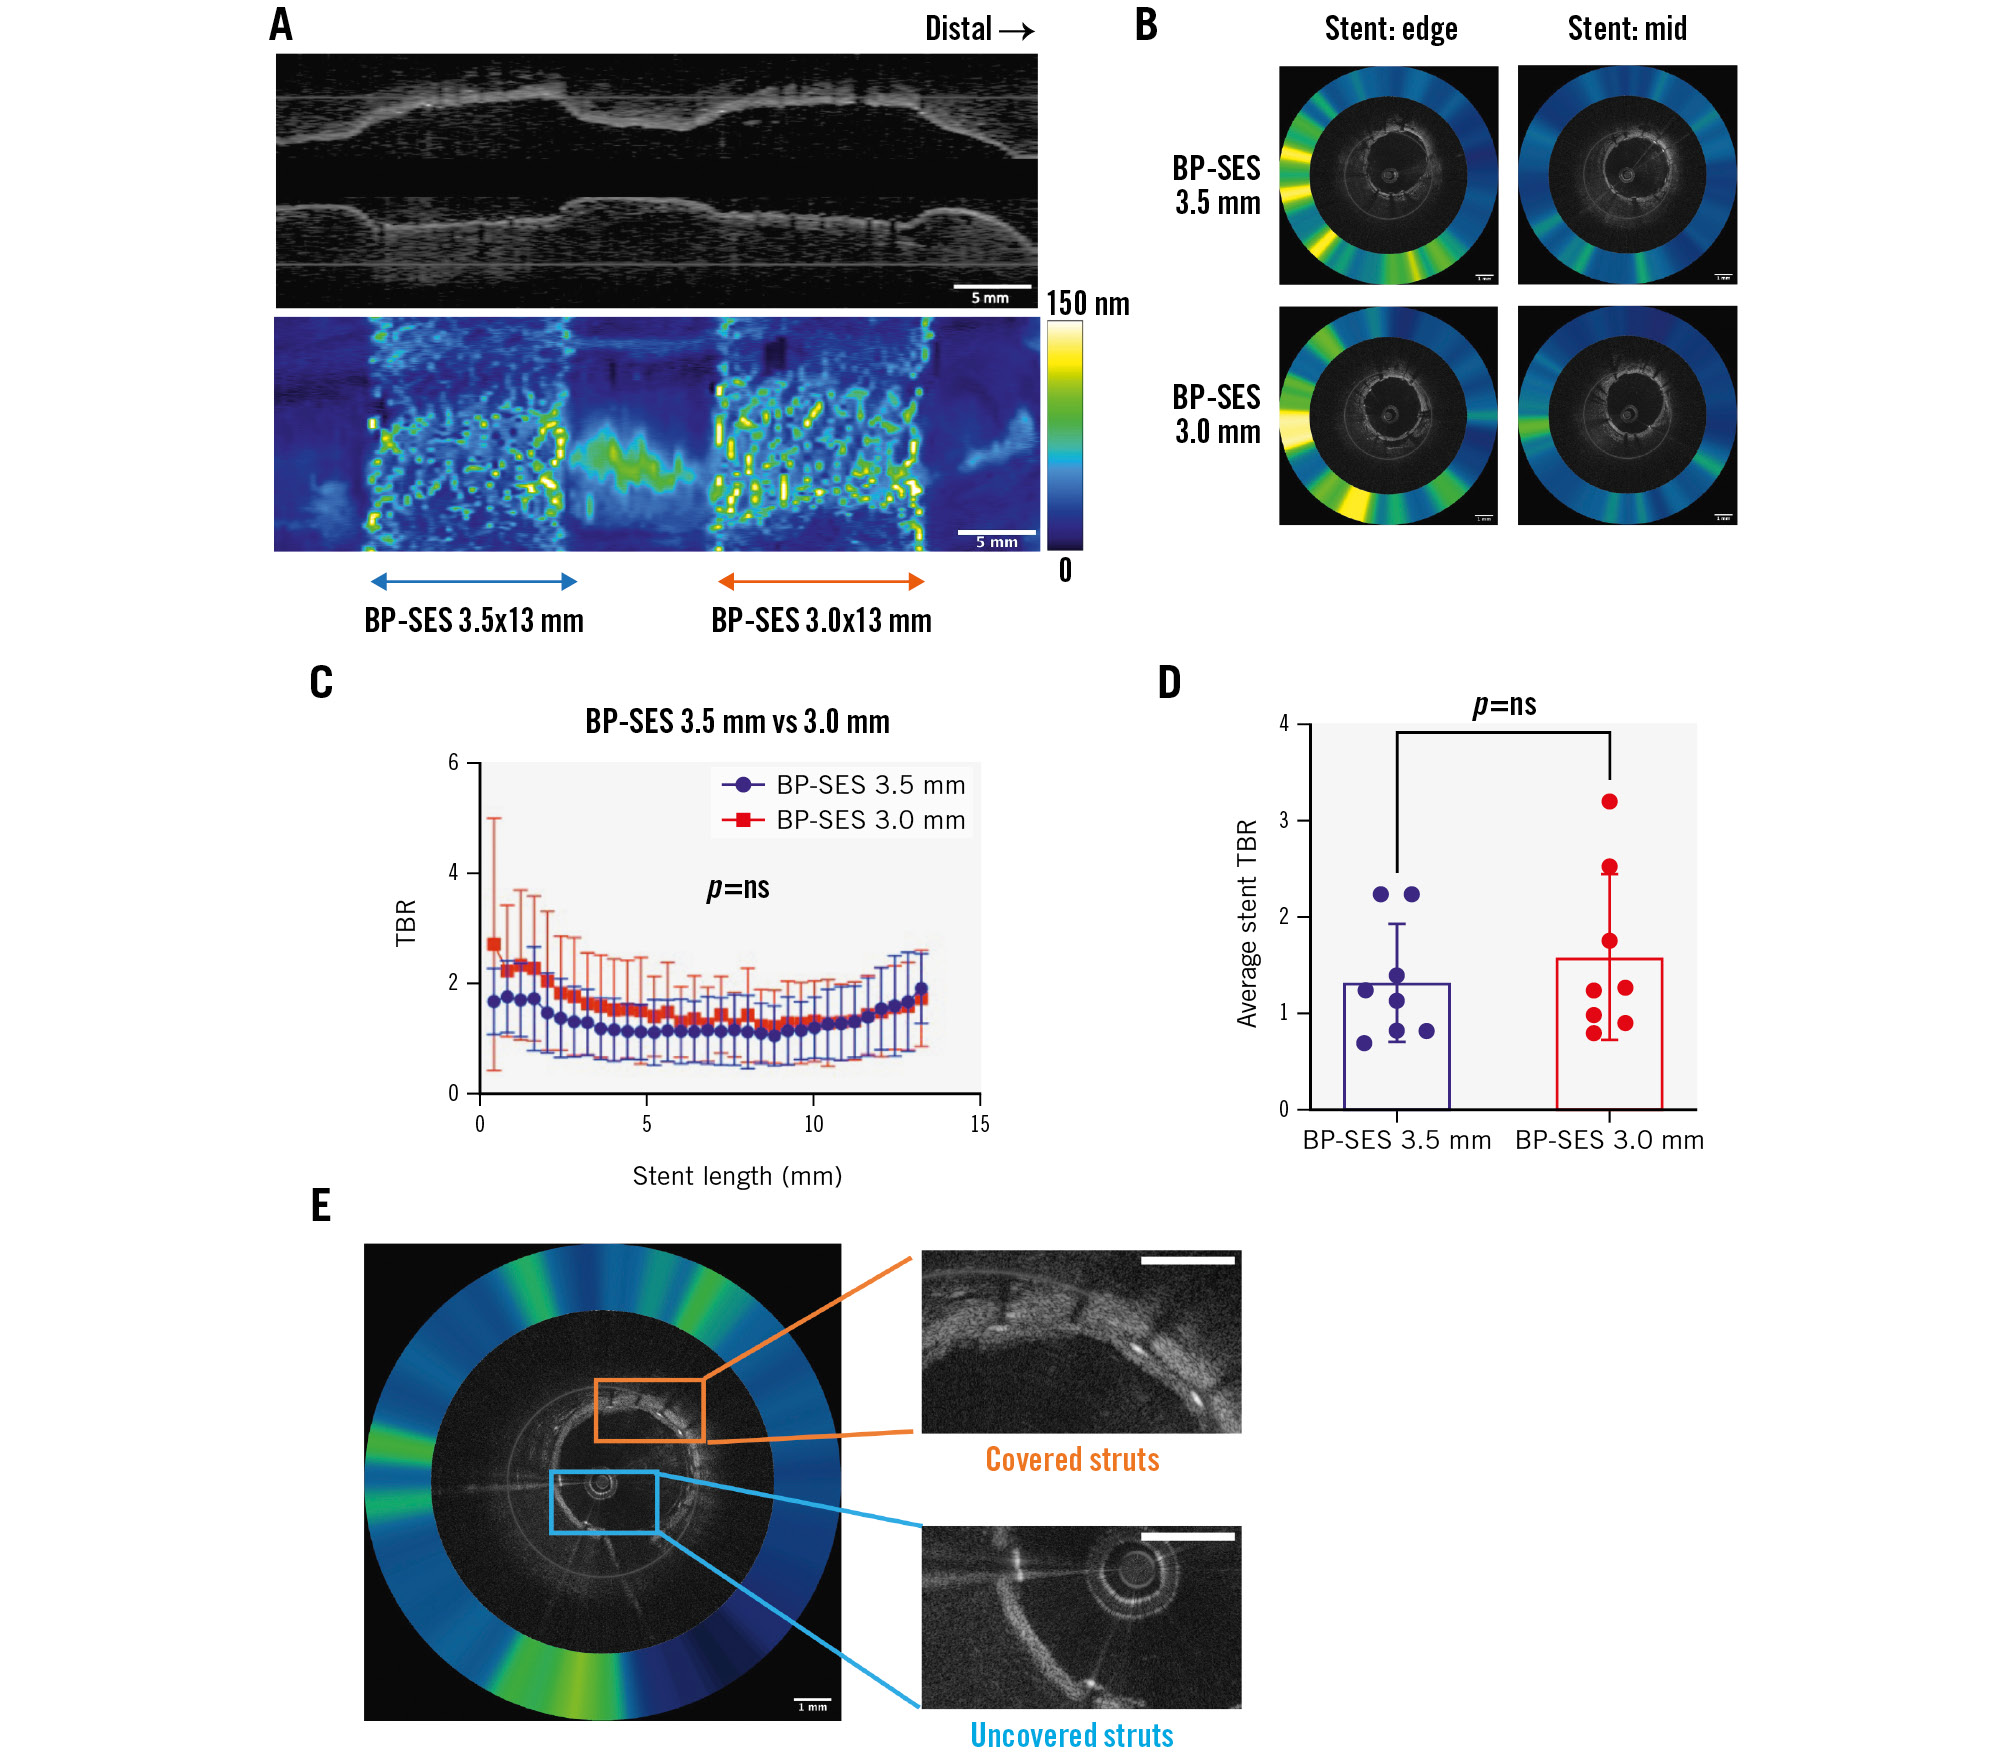
Figure 2. Fibrin deposition on ultrathin-strut versus thin-strut BP-SES as assessed by NIRF-OCT molecular-structural imaging. In vivo two-dimensional fibrin NIRF-OCT map at day 7 post-stent implantation of non-overlapping 3.5 mm and 3.0 mm BP-SES. A) Long-axis NIRF image and (B) cross-sectional NIRF-OCT image, where the coregistered NIRF fibrin signal intensity is displayed as a quantitative ring around the OCT image. C) The NIRF fibrin signal plotted from the proximal to distal stent edge of BP-SES 3.5x13 mm and BP-SES 3.0x13 mm, averaged from the 8 rabbits (n=8 stents per group). D) The average of NIRF fibrin TBR across each 13 mm stent length. E) Representative NIRF-OCT images of covered and uncovered stent struts. Scale bar: 5 mm (long-axis NIRF image) or 1 mm (cross-sectional NIRF-OCT image). BP-SES: biodegradable-polymer sirolimus-eluting stent; NIRF: near-infrared fluorescence; ns: non-significant; OCT: optical coherence tomography; TBR: target-to-background ratio
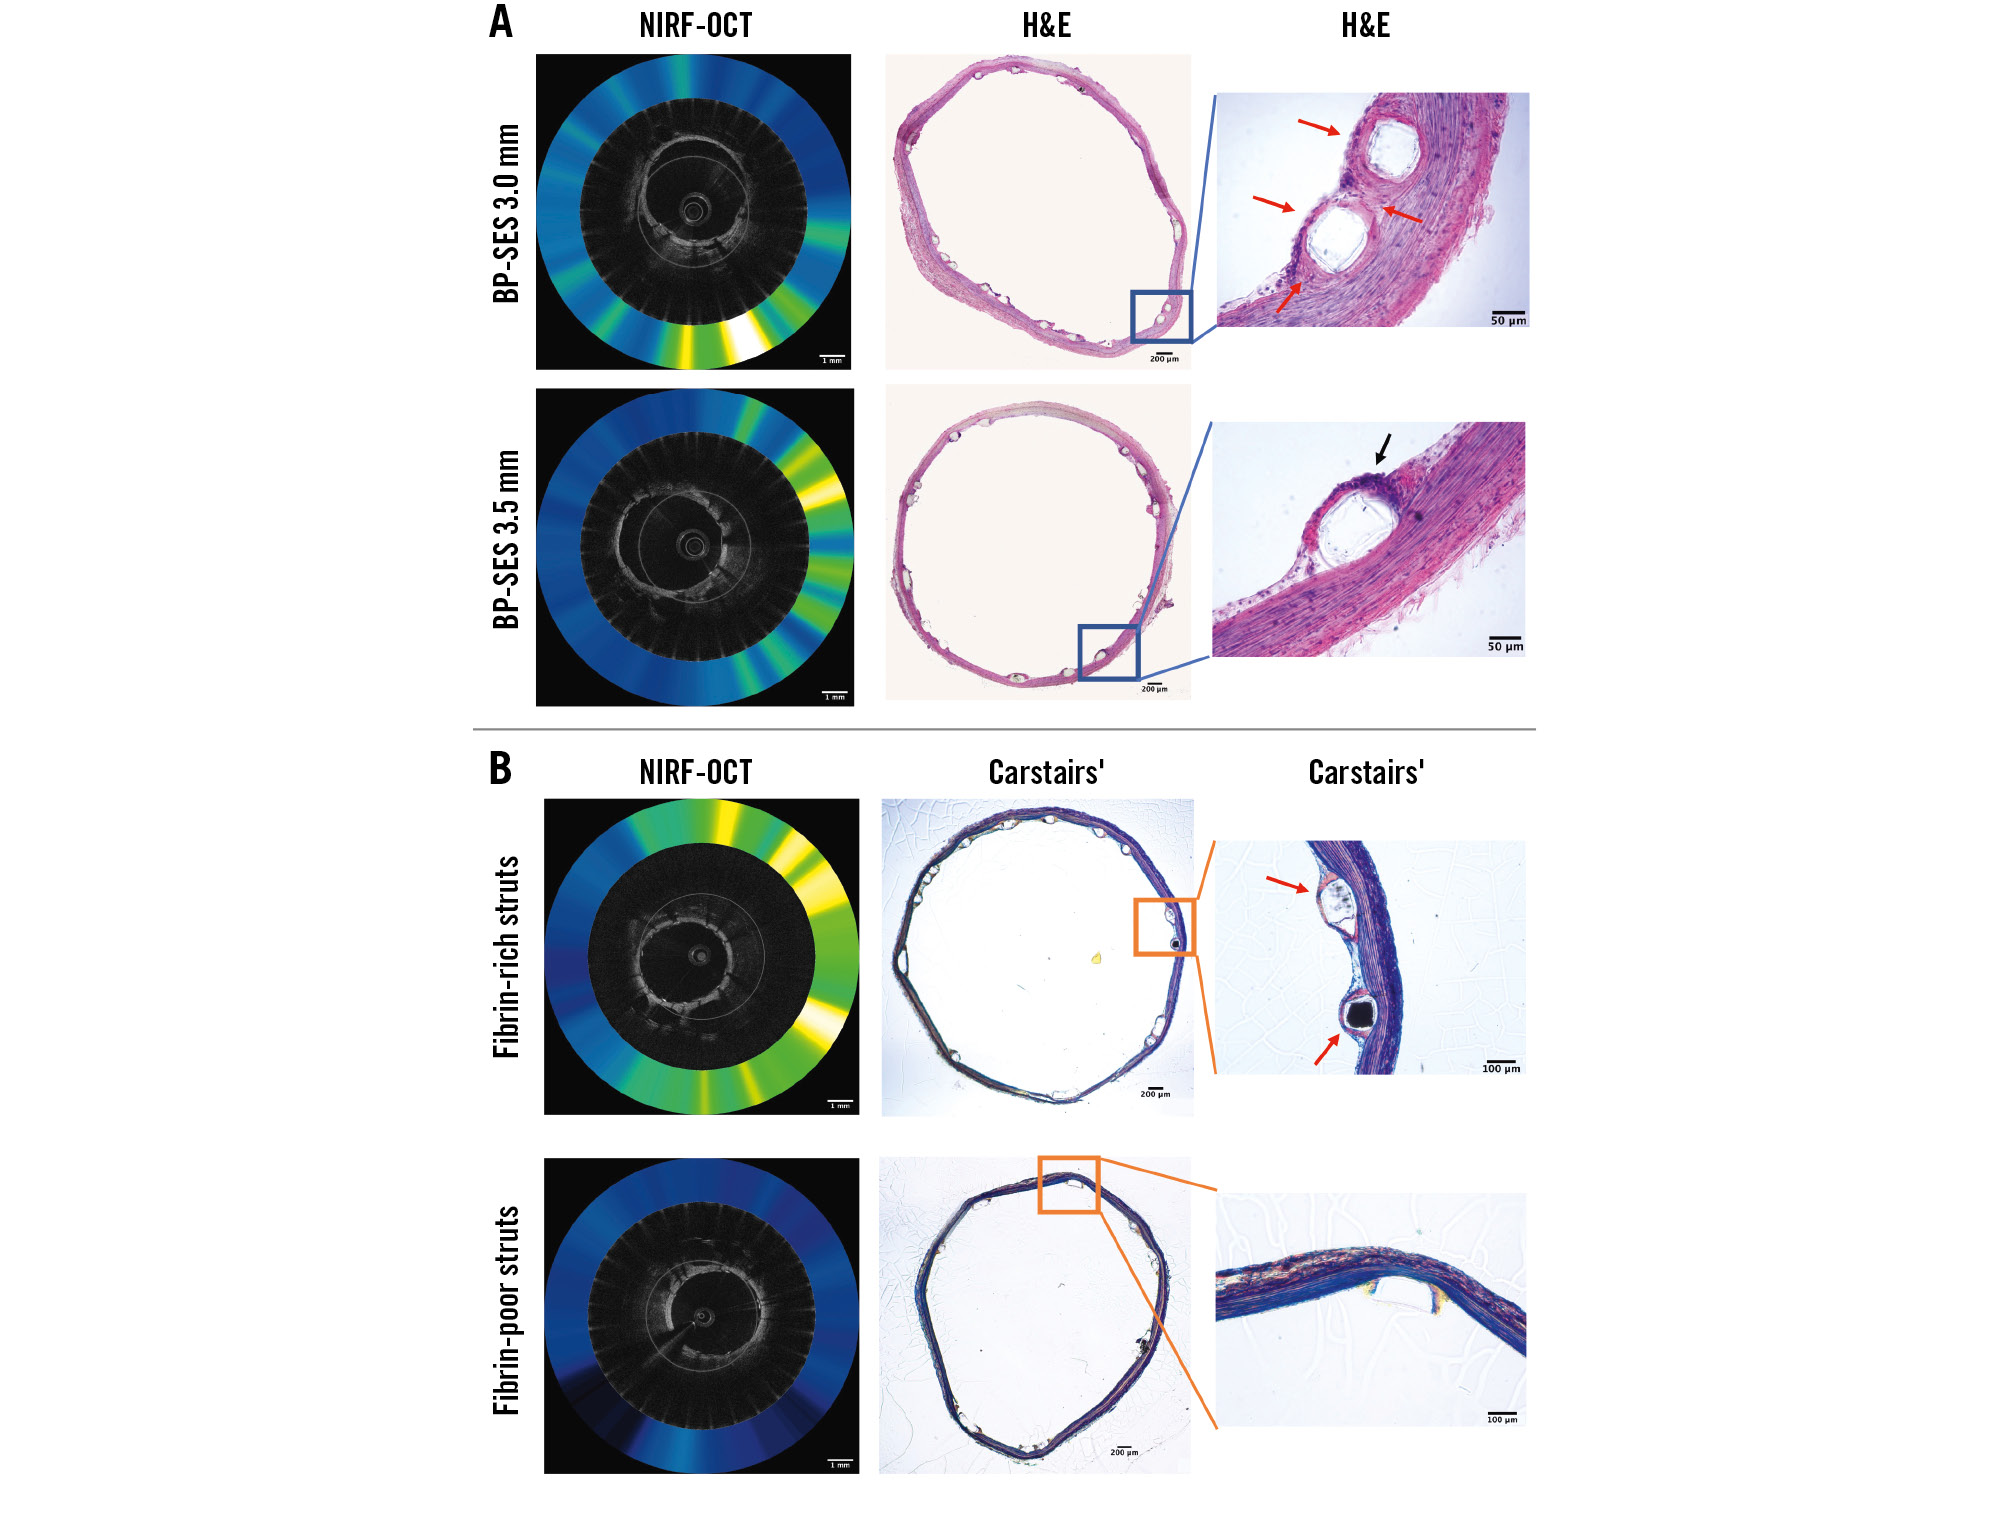
Figure 3. Histological assessment of stent healing of ultrathin-strut (60 µm) and thin-strut (80 µm) BP-SES. A) Representative images of matched NIRF-OCT and haematoxylin and eosin (H&E) stained sections. B) Representative images of matched NIRF-OCT and Carstairs’ histological images. Black arrows: inflammatory cells. Red arrows: fibrin deposition. Scale bar: 1 mm (NIRF-OCT image) or 200 µm, 100 µm, 50 µm (histological images). BP-SES: biodegradable-polymer sirolimus-eluting stent; NIRF-OCT: near-infrared fluorescence optical coherence tomography
CLINICAL OUTCOMES AFTER PCI WITH ULTRATHIN-STRUT VERSUS THIN-STRUT BP-SES
To assess the clinical relevance of these experimental findings, we performed a patient-level subgroup analysis of the BIOSTEMI5 and BIOSCIENCE11 randomised trials. In the overall pooled population from BIOSCIENCE and BIOSTEMI, we identified 2 subgroups of patients who were treated with either a single 3.0 mm (n=282, including 180 patients from BIOSCIENCE and 98 patients from BIOSTEMI) or 3.5 mm (n=222, including 120 patients from BIOSCIENCE and 102 patients from BIOSTEMI) BP-SES. In the overall combined population, we identified 4 subgroups of patients who were treated with a single stent (either 3.0 mm or 3.5 mm diameter): BP-SES 3.5 mm (n=222), DP-EES 3.5 mm (n=233), BP-SES 3.0 mm (n=282), DP-EES 3.0 mm (n=260). TLF rates among groups were similar (p>0.05) (Figure 4A). When comparing TLF rates for both stent platforms grouped into large diameter (3.5 mm, n=435) versus small diameter (3.0 mm, n=542), 1-year TLF rates remained similar for both stent platforms (pinteraction>0.05).
To specifically examine the difference in TLF rates as a function of stent strut thickness, we assessed differences between the ultrathin-strut BP-SES 3.0 mm and thin-strut BP-SES 3.5 mm groups. Differences in baseline clinical and procedural characteristics between treatment groups were controlled by the randomised allocation of the study stents (Table 2). Compared to the thin-strut group, the ultrathin-strut group included a higher proportion of males, had higher rates of acute coronary syndrome, thrombus aspiration and direct stenting, and lower rates of bifurcation lesions. Medications, including dual antiplatelet therapy, were similar between the 2 groups at discharge, 30 days, and 1 year (Supplementary Table 1). As a significant proportion of patients included in the present analysis had undergone a previous PCI, a small number of patients underwent PCI for de novo coronary lesions that required implantation of an overlapping study stent with a previously implanted non-study stent (Table 2).
We assessed the clinical outcomes at 30 days and 1 year between ultrathin-strut BP-SES and thin-strut BP-SES. Rates of TLF or the individual endpoints of cardiac death, target vessel myocardial infarction, or clinically indicated TLR did not differ significantly, at either 30 days or 1 year (Table 3). Clinical outcomes from each individual trial (BIOSCIENCE and BIOSTEMI) are reported in Supplementary Table 2 and Supplementary Table 3. Clinical outcomes at 1 year between ultrathin-strut BP-SES and thin-strut DP-EES were consistent when excluding patients (n=35) who had undergone PCI with either a single 3.0 mm or 3.5 mm stent for in-stent restenosis (Supplementary Table 4).
Kaplan-Meier curves demonstrated similar rates of event accrual, with numerically higher TLF rates in the ultrathin strut BP-SES group at 30 days, but numerically lower event rates between 30 days and 1 year (Figure 4B).
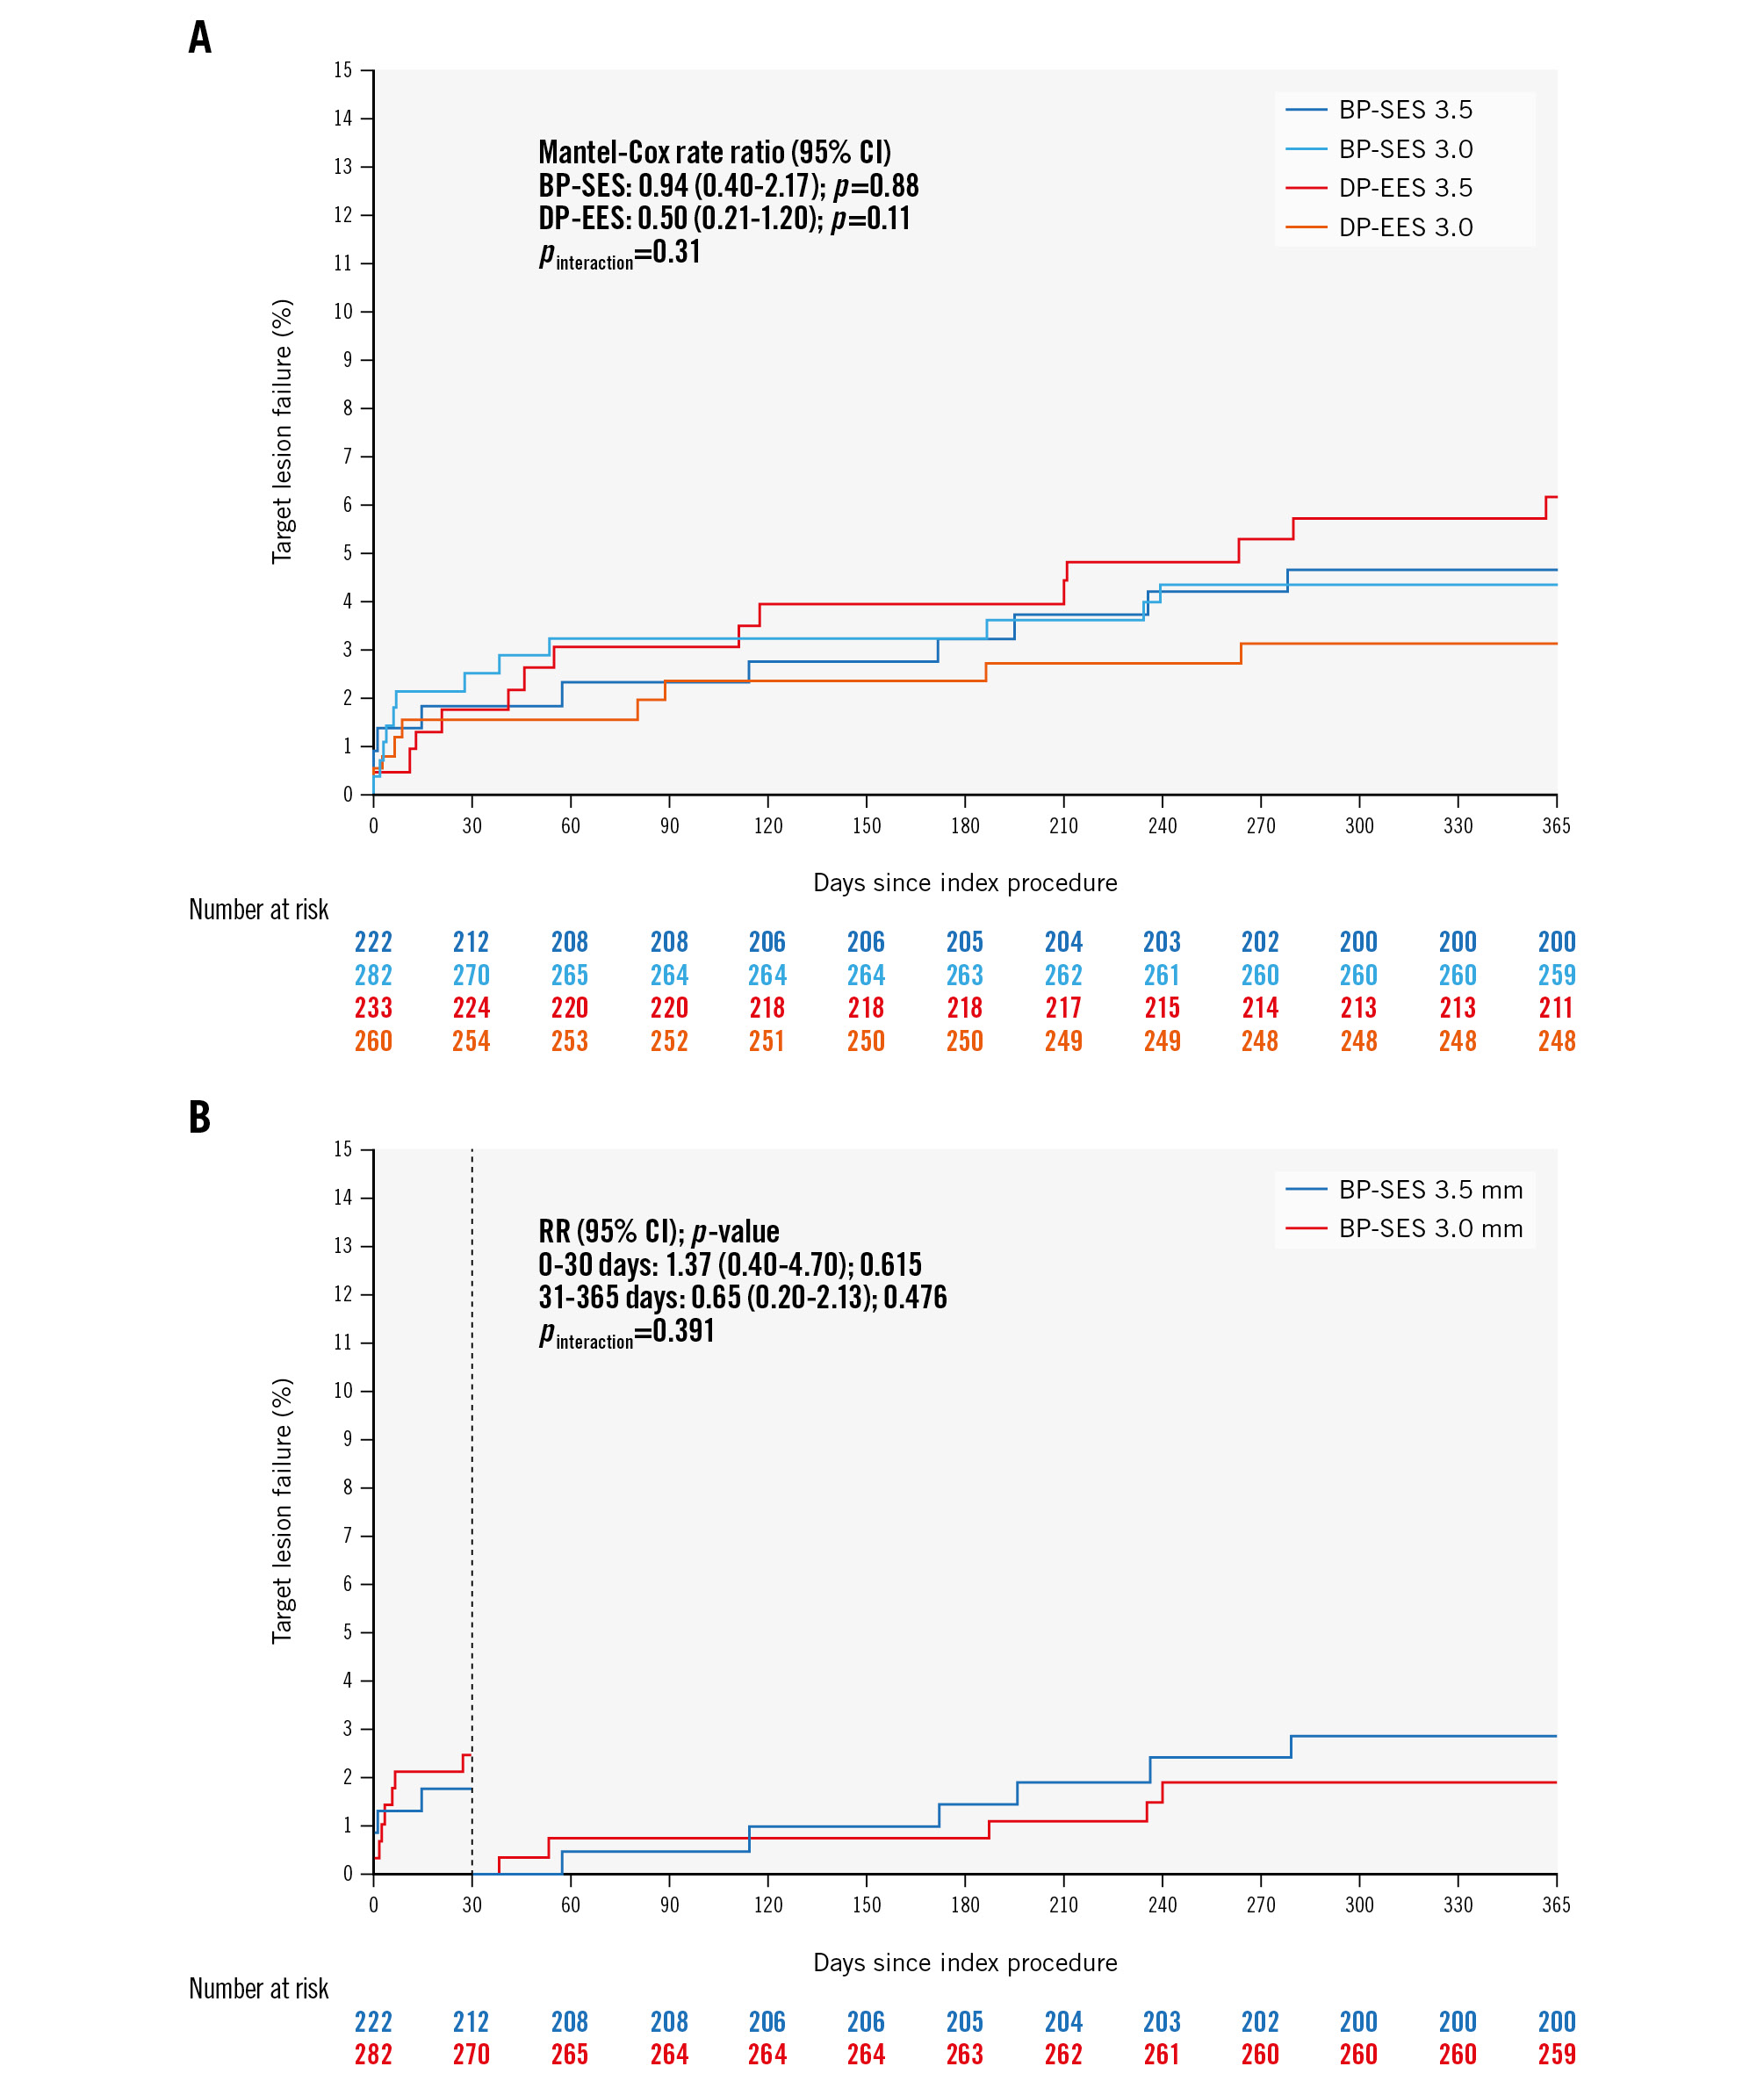
Figure 4. Clinical outcomes of 504 pooled patients from the BIOSCIENCE and BIOSTEMI trials treated with either a 3.0 mm diameter or 3.5 mm diameter BP-SES or DP-EES. A) Time-to-event curves for target lesion failure (TLF) at 1 year of follow-up for all 4 groups. Blue line: thin-strut BP-SES (diameter 3.5 mm; strut thickness 80 μm); light blue line: ultrathin-strut BP-SES (diameter 3.0 mm; strut thickness 60 μm); red line: thin-strut DP-EES (diameter 3.5 mm; strut thickness 81 μm); orange line: thin-strut DP-EES (diameter 3.0 mm; strut thickness 81 μm). B) Time-to-event curves for 1-year TLF events in the two BP-SES groups, with a landmark set at 30 days. Blue line: thin-strut BP-SES (diameter 3.5 mm; strut thickness 80 μm); red line: ultrathin-strut BP-SES (diameter 3.0 mm; strut thickness 60 μm). BP-SES: biodegradable-polymer sirolimus-eluting stent; CI: confidence interval; DP-EES: durable-polymer everolimus-eluting stents; RR: risk ratio
Table 2. Baseline clinical and procedural characteristics in the BP-SES groups from a pooled analysis of the BIOSCIENCE and BIOSTEMI trials.
| BP-SES 3.0 mm (60 μm) n=282 | BP-SES 3.5 mm (80 μm) n=222 | p-value | |
|---|---|---|---|
| Age, years | 64.6±11.4 | 62.9±11.9 | 0.096 |
| Male | 212 (75.2) | 186 (83.8) | 0.021 |
| BMI, kg/m² | 27.8±4.7 | 27.2±4.2 | 0.156 |
| Diabetes mellitus | 53 (18.8) | 34 (15.3) | 0.343 |
| Insulin-dependent | 20 (7.1) | 10 (4.5) | 0.258 |
| Hypertension | 168 (59.8) | 123 (55.4) | 0.363 |
| Hypercholesterolaemia* | 159 (56.8) | 135 (60.8) | 0.412 |
| Current smoker | 97 (34.9) | 85 (38.6) | 0.400 |
| Prior MI | 33 (11.7) | 27 (12.2) | 0.891 |
| Previous PCl | 56 (19.9) | 39 (17.6) | 0.567 |
| Prior CABG | 13 (4.6) | 12 (5.4) | 0.686 |
| Prior stroke/TIA | 8 (2.8) | 4 (1.8) | 0.563 |
| Peripheral arterial disease | 13 (4.6) | 12 (5.4) | 0.686 |
| Chronic renal failure# | 39 (14.6) | 27 (12.6) | 0.594 |
| Left ventricular ejection fraction, % | 53.9±12.1** | 51.4±12.4## | 0.064 |
| Baseline medication | |||
| Aspirin | 104 (38.0) | 77 (35.2) | 0.573 |
| Clopidogrel | 21 (7.7) | 11 (5.0) | 0.272 |
| Prasugrel | 11 (4.0) | 7 (3.2) | 0.810 |
| Ticagrelor | 4 (1.5) | 4 (1.8) | 1.000 |
| Any DAPT | 30 (10.9) | 18 (8.2) | 0.360 |
| Oral anticoagulation | 15 (5.5) | 8 (3.7) | 0.394 |
| Statin | 96 (35.2) | 80 (36.5) | 0.777 |
| ACE inhibitor | 48 (17.6) | 42 (19.2) | 0.725 |
| Beta blocker | 98 (36.0) | 61 (27.9) | 0.065 |
| Clinical presentation | |||
| Chronic coronary syndrome | 76 (27) | 55 (24.8) | 0.610 |
| Acute coronary syndrome | 206 (73) | 167 (75.2) | 0.012 |
| Unstable angina | 14 (6.8) | 10 (6.0) | 0.834 |
| NSTEMI | 55 (26.7) | 24 (14.4) | 0.005 |
| STEMI | 137 (66.5) | 133 (79.6) | 0.005 |
| Target vessel location | 0.239 | ||
| Left main | 1 (0.4) | 3 (1.4) | 0.325 |
| Left anterior descending | 141 (50.0) | 105 (47.3) | 0.590 |
| Left circumflex | 55 (19.5) | 32 (14.4) | 0.154 |
| Right circumflex | 82 (29.1) | 80 (36.0) | 0.103 |
| Bypass graft | 3 (1.1) | 2 (0.9) | 1.000 |
| TIMI flow pre-PCI | 0.091 | ||
| 0 or 1 | 99 (35.4) | 93 (42.7) | 0.115 |
| 2 | 46 (16.4) | 23 (10.6) | 0.067 |
| 3 | 135 (48.2) | 102 (46.8) | 0.786 |
| TIMI flow post-PCI | 0.510 | ||
| 2 | 6 (2.1) | 3 (1.4) | 0.738 |
| 3 | 275 (97.9) | 219 (98.6) | 0.738 |
| Thrombus aspiration | 61 (21.6) | 71 (32.0) | 0.011 |
| In-stent restenosis | 19 (6.7) | 16 (7.2) | 0.861 |
| Chronic total occlusion | 6 (2.1) | 3 (1.4) | 0.738 |
| Bifurcation lesion | 42 (14.9) | 18 (8.1) | 0.026 |
| Total stent length, mm | 22.00±6.92 | 21.54±6.80 | 0.460 |
| Maximum pressure, atm | 13.46±3.18 | 13.28±3.36 | 0.527 |
| Overlapping stents | 2 (0.7) | 1 (0.5) | 1.000 |
| Direct stenting | 67 (23.8) | 73 (32.9) | 0.027 |
| Post-dilatation | 136 (48.2) | 94 (42.3) | 0.208 |
| Data are expressed as mean±SD, n (%) or sample size [n]. *total cholesterol >5.0 mmol or 190 mg/dl or requiring treatment; #glomerular filtration rate <60 ml/min; **n=200; ##n=143. ACE: angiotensin-converting enzyme; BMI: body mass index; BP-SES: biodegradable-polymer sirolimus-eluting stents; CABG: coronary artery bypass grafting; DAPT: dual antiplatelet therapy; MI: myocardial infarction; NSTEMI: non-ST-segment elevation myocardial infarction; PCI: percutaneous coronary intervention; STEMI: ST-segment elevation myocardial infarction; TIA: transient ischaemic attack; TIMI: Thrombolysis in Myocardial Infarction | |||
Table 3. Clinical outcomes of BP-SES at 30 days and 1 year of follow-up.
| BP-SES 3.0 mm (60 μm) N=222 | BP-SES 3.5 mm (80 μm) N=222 | Rate ratio (95% CI) |
p-value | |
|---|---|---|---|---|
| At 30 days | ||||
| Target lesion failure* | 7 (2.5) | 4 (1.8) | 1.37 (0.40-4.70) | 0.615 |
| Cardiac death | 5 (1.8) | 1 (0.5) | 3.95 (0.46-34.03) | 0.176 |
| Target vessel MI | 1 (0.4) | 3 (1.4) | 0.26 (0.03-2.53) | 0.211 |
| Clinically indicated TLR | 2 (0.7) | 1 (0.5) | 1.58 (0.14-17.51) | 0.708 |
| All-cause death | 5 (1.8) | 2 (0.9) | 1.97 (0.38-10.17) | 0.409 |
| Myocardial infarction (any) | 1 (0.4) | 3 (1.4) | 0.26 (0.03-2.53) | 0.211 |
| Revascularisation (any) | 4 (1.4) | 1 (0.5) | 3.16 (0.35-28.39) | 0.277 |
| TLR (any) | 2 (0.7) | 1 (0.5) | 1.58 (0.14-17.51) | 0.708 |
| TVR (any) | 2 (0.7) | 1 (0.5) | 1.58 (0.14-17.51) | 0.708 |
| Clinically indicated TVR | 2 (0.7) | 1 (0.5) | 1.58 (0.14-17.51) | 0.708 |
| Stroke (any) | 0 (0.0) | 2 (0.9) | 0.34 (0.05-2.28) | 0.325 |
| Target vessel failure** | 7 (2.5) | 4 (1.8) | 1.37 (0.40-4.70) | 0.615 |
| Cardiac death, or MI (any) | 6 (2.1) | 4 (1.8) | 1.17 (0.33-4.18) | 0.804 |
| Death, MI, or any revascularisation | 9 (3.2) | 5 (2.3) | 1.41 (0.47-4.22) | 0.536 |
| Definite stent thrombosis | 1 (0.4) | 1 (0.5) | 0.79 (0.05-12.72) | 0.865 |
| Definite/probable stent thrombosis | 4 (1.4) | 4 (1.8) | 0.78 (0.19-3.14) | 0.728 |
| At 1 year | ||||
| Target lesion failure* | 12 (4.3) | 10 (4.7) | 0.94 (0.40-2.17) | 0.882 |
| Cardiac death | 7 (2.5) | 4 (1.9) | 1.38 (0.40-4.71) | 0.606 |
| Target vessel MI | 2 (0.7) | 5 (2.3) | 0.31 (0.06-1.62) | 0.142 |
| Clinically indicated TLR | 5 (1.8) | 5 (2.4) | 0.79 (0.23-2.73) | 0.708 |
| All-cause death | 9 (3.2) | 8 (3.7) | 0.89 (0.34-2.30) | 0.803 |
| Myocardial infarction (any) | 3 (1.1) | 8 (3.7) | 0.29 (0.08-1.10) | 0.053 |
| Revascularisation (any) | 13 (4.8) | 7 (3.3) | 1.49 (0.59-3.73) | 0.396 |
| TLR (any) | 6 (2.2) | 5 (2.4) | 0.95 (0.29-3.12) | 0.933 |
| TVR (any) | 8 (3.0) | 5 (2.4) | 1.27 (0.41-3.89) | 0.675 |
| Clinically indicated TVR | 7 (2.6) | 5 (2.4) | 1.11 (0.35-3.51) | 0.857 |
| Stroke (any) | 1 (0.4) | 3 (1.4) | 0.26 (0.03-2.54) | 0.212 |
| Target vessel failure** | 15 (5.4) | 10 (4.7) | 1.18 (0.53-2.62) | 0.690 |
| Cardiac death, or MI (any) | 10 (3.6) | 11 (5.1) | 0.71 (0.30-1.67) | 0.427 |
| Death, MI, or any revascularisation | 22 (8.0) | 16 (7.4) | 1.08 (0.57-2.07) | 0.805 |
| Definite stent thrombosis | 2 (0.7) | 3 (1.4) | 0.52 (0.09-3.15) | 0.473 |
| Definite/probable stent thrombosis | 5 (1.8) | 6 (2.8) | 0.65 (0.20-2.14) | 0.476 |
| Data are presented as number of first events (% cumulative incidence) from Kaplan-Meier estimate. Rate ratios, 95% confidence intervals (CI), and log-rank p-values are from Mantel-Cox regressions. *Composite of cardiac death: target vessel myocardial infarction, and clinically indicated TLR. **Composite of cardiac death, any myocardial infarction, and any target vessel revascularisation. BP-SES: biodegradable-polymer sirolimus-eluting stents; MI: myocardial infarction; TLR: target lesion revascularisation; TVR: target vessel revascularisation | ||||
Discussion
Multiple studies demonstrate that ultrathin-strut DES exhibit improved clinical outcomes compared to thin-strut DES, driven by a reduction in clinically driven TLR91314. However, the biophysical mechanisms underlying improved outcomes from ultrathin-strut DES remain uncertain. While ultrathin-strut thickness might underlie the observed clinical benefits, other features, such as the specific biodegradable polymer, antiproliferative drug/dose, and stent design, might also influence the observed benefits of BP-SES. To further investigate the specific feature of stent strut thickness, this integrative preclinical and clinical study compared the 60 μm and 80 μm BP-SES platforms utilising the same stent design, both experimentally and clinically. In summary, ultrathin-strut (60 μm) and thin-strut (80 μm) BP-SES exhibit similar preclinical stent healing profiles at subacute timepoints and demonstrate similar clinical outcomes at 30 days and 1 year.
Stent strut thickness has been long recognised as a critical feature that modulates stent healing. Kastrati et al first demonstrated improved clinical outcomes associated with a reduction of strut thickness4. Soucy et al showed that a lower stent strut thickness improved strut tissue coverage following stent implantation in rabbits15. In addition, reductions in stent strut thickness of second-generation DES (typically 81 μm stent strut thickness) were further associated with improved clinical outcomes, as compared to thicker-strut first-generation DES (132-140 μm strut thickness)16. This finding likely motivated the development of ultrathin-strut stents, including a BP-SES platform with a strut thickness of 60 μm for a 3.0 mm stent diameter17. Yet the specific parameter of ultrathin-strut thickness on stent healing and clinical outcomes has not been rigorously investigated.
The experimental arm of this study showed similar day 7 subacute stent healing and stent tissue coverage between BP-SES groups in rabbits. The day 7 rabbit timepoint was chosen specifically to mirror the ~1 month timepoint in humans18, when the early benefits of BP-SES emerged in the BIOSTEMI trial5. A strength of the experimental design was to vary the stent strut thickness without changing the antiproliferative drug (sirolimus), biodegradable polymer (poly-L-lactic acid [PLLA]), or stent design (3 connectors, 8 crowns at the end), while maintaining similar stent expansion ratios for the 2 platforms (Table 1). Consistent with an earlier preclinical stent fibrin imaging study10, we found that day 7 stent tissue coverage assessed by OCT was fibrin rich (Figure 2, Supplementary Figure 2), indicating an unhealed state in the subacute phase after stenting. These findings further reinforce the value of NIRF fibrin molecular imaging, as standalone OCT appears insufficient for understanding the pathogenicity of early stent tissue coverage, namely whether a covered stent strut is covered by fibrin (prothrombotic, unhealed) or endothelial cells (antithrombotic, healed)10.
To determine the clinical impact of ultrathin-strut thickness, we investigated whether clinical outcomes differed between ultrathin-strut BP-SES and thin-strut BP-SES in a pooled analysis of individual patient data from the BIOSCIENCE11 and BIOSTEMI5 randomised trials. These two trials compared BP-SES versus DP-EES in patients undergoing PCI. In a prespecified subgroup analysis from the BIOSCIENCE trial which included 407 ST-elevation myocardial infarction (STEMI) patients, BP-SES exhibited significantly lower 1-year TLF rates compared to DP-EES19. In the dedicated BIOSTEMI trial that randomised 1,300 STEMI patients 1:1 to treatment with BP-SES or DP-EES5, BP-SES demonstrated superior outcomes, compared to the DP-EES, with a 41% reduction in the risk of TLF at 1 year of follow-up, driven by reductions in clinically driven TLR. The clinical benefits of BP-SES over DP-EES emerged within the first month after PCI, which motivated the current rabbit day 7 timepoint analysis. However, consistent with our preclinical results, we found no significant differences in the 30-day and 1-year TLF rates between ultrathin-strut BP-SES and thin-strut BP-SES (Figure 4B). In addition, while prior studies suggest that TLF rates might be higher in smaller-diameter vessels20, which could affect the current results, we observed no statistically significant differences in 1-year TLF rates for small-diameter versus large-diameter stents in our pooled RCT analysis, for either BP-SES or DP-EES (Figure 4A). These results are also consistent with a recent study that compared TLF rates between multistent and single-stent lesions for BP-SES and DP-EES21. However, no specific analysis was performed between ultrathin-strut and thin-strut BP-SES.
From a translational imaging perspective, intracoronary NIRF-OCT has already been performed in patients with coronary artery disease to detect NIR autofluorescence (NIRAF)22, a high-risk plaque feature reflecting intraplaque haemorrhage, and ceroid derived from oxidative stress232425. From an imaging agent standpoint, the fibrin-targeted NIRF molecular imaging agent is peptide based10, and a magnetic resonance imaging analogue has already been tested clinically26. Therefore, clinical intracoronary NIRF-OCT fibrin molecular imaging appears feasible to unravel the mechanisms of DES healing, and potentially to detect the risk of stent thrombosis.
Limitations
This study has limitations. Experimentally, stent healing was assessed in normal rather than atheroma-bearing rabbit arteries, consistent with prior preclinical stent healing studies27 and, thus, may not recapitulate all features of stent healing in patients. In addition, stent deployment at day 0 was assessed with only IVUS and not OCT. Although OCT is preferred for assessing post-stenting malapposition, in a rabbit, OCT is more invasive than IVUS, because it requires a separate arterial access via the carotid artery cutdown to allow for balloon occlusion and blood clearance. Considering the degree of invasiveness, which could risk animal death, and the need to preserve an arterial access for the day 7 primary endpoint, we deferred OCT on day 0 and performed IVUS pullback only. While DP-EES were not experimentally studied for stent healing, the focus of this study was to assess the impact of the specific parameter of strut thickness between otherwise similarly constructed stents. We could not compare preclinical ultrathin-strut versus thin-strut stent healing in smaller vessels (e.g., 2.5 mm diameter) due to the risk of dissection with the larger 3.5 mm platform, and, intentionally, the clinical analysis matched the 3.0 mm/3.5 mm preclinical framework. Another limitation was that we could not specifically compare healing of the same diameter stent with thin-strut versus ultrathin-strut thickness in large arteries (e.g., a 3.5 mm BP-SES with 60 μm vs a 3.5 mm BP-SES with 80 μm strut thickness), nor in smaller arteries (e.g., a 2.5 mm BP-SES with 60 μm vs a 2.5 mm BP-SES with 80 μm strut thickness) that typically have poorer outcomes20, as the manufacturer only provides 1 strut thickness for a given stent diameter. The latter inability to compare small-diameter vessel healing and outcomes between ultrathin-strut and thin-strut BP-SES remains a limitation, as it is still possible that ultrathin-strut thickness could confer an advantage in smaller-diameter arteries. However, it is also noteworthy that for 3.0 mm diameter vessels, ultrathin-strut BP-SES showed numerically higher event rates than thin-strut DP-EES (Figure 4A), again supporting the concept that ultrathin-strut thickness may not confer improved clinical outcomes in large vessels. The day 7 timepoint for preclinical assessment was chosen based on the BIOSTEMI trial showing benefits emerging by 30 days post-PCI; later timepoints might reveal differences in stent healing, although prior preclinical data shows smaller differences in stent coverage and fibrin deposition at later timepoints such as day 281027. While the NIRF-OCT fibrin/coverage imaging protocol was focused on assessing subacute stent healing, separate preclinical studies might evaluate neointimal hyperplasia and neoatherosclerosis at later timepoints, features that could also underlie the improved TLF rates noted with BP-SES. In the BIOSTEMI and BIOSCIENCE trials, patients were not randomised to receive thin-strut versus ultrathin-strut stents of otherwise similar stent designs, and were not randomised based on the presence or absence of a bifurcation lesion. Finally, the present analysis included a small number of patients (n=3) who underwent PCI with a single ultrathin-strut BP-SES that overlapped a previously implanted non-study stent. While PCI with overlapping stents may induce different arterial wall response patterns than those caused by single stent implantation, the inclusion of a limited number of patients with overlapping stents in the present analysis is unlikely to have influenced the overall study results.
Conclusions
In conclusion, this experimental and clinical study found similar early stent healing patterns and 30-day and 1-year clinical outcomes for ultrathin-strut and thin-strut BP-SES (Central illustration). These findings provide evidence that features beyond ultrathin-strut thickness may underlie the observed benefits of BP-SES compared to current DP-EES913. Furthermore, we surmise that further reduction of stent strut thickness beyond 60 μm may not offer additional clinical advantages, given the current results and potential for lower radial strength. However, further investigation of ultrathin-strut DES in smaller arteries, which have higher event rates in general20, may be needed, as the lower ratio of strut thickness to stent diameter is more favourable for ultrathin-strut DES. Other stent features to investigate and refine in the ongoing quest to improve DES outcomes may include stent design, novel stent metals and polymers, and antiproliferative drug candidates. Overall, based on the current data, the potential clinical benefits observed with BP-SES may be independent of stent strut thickness.
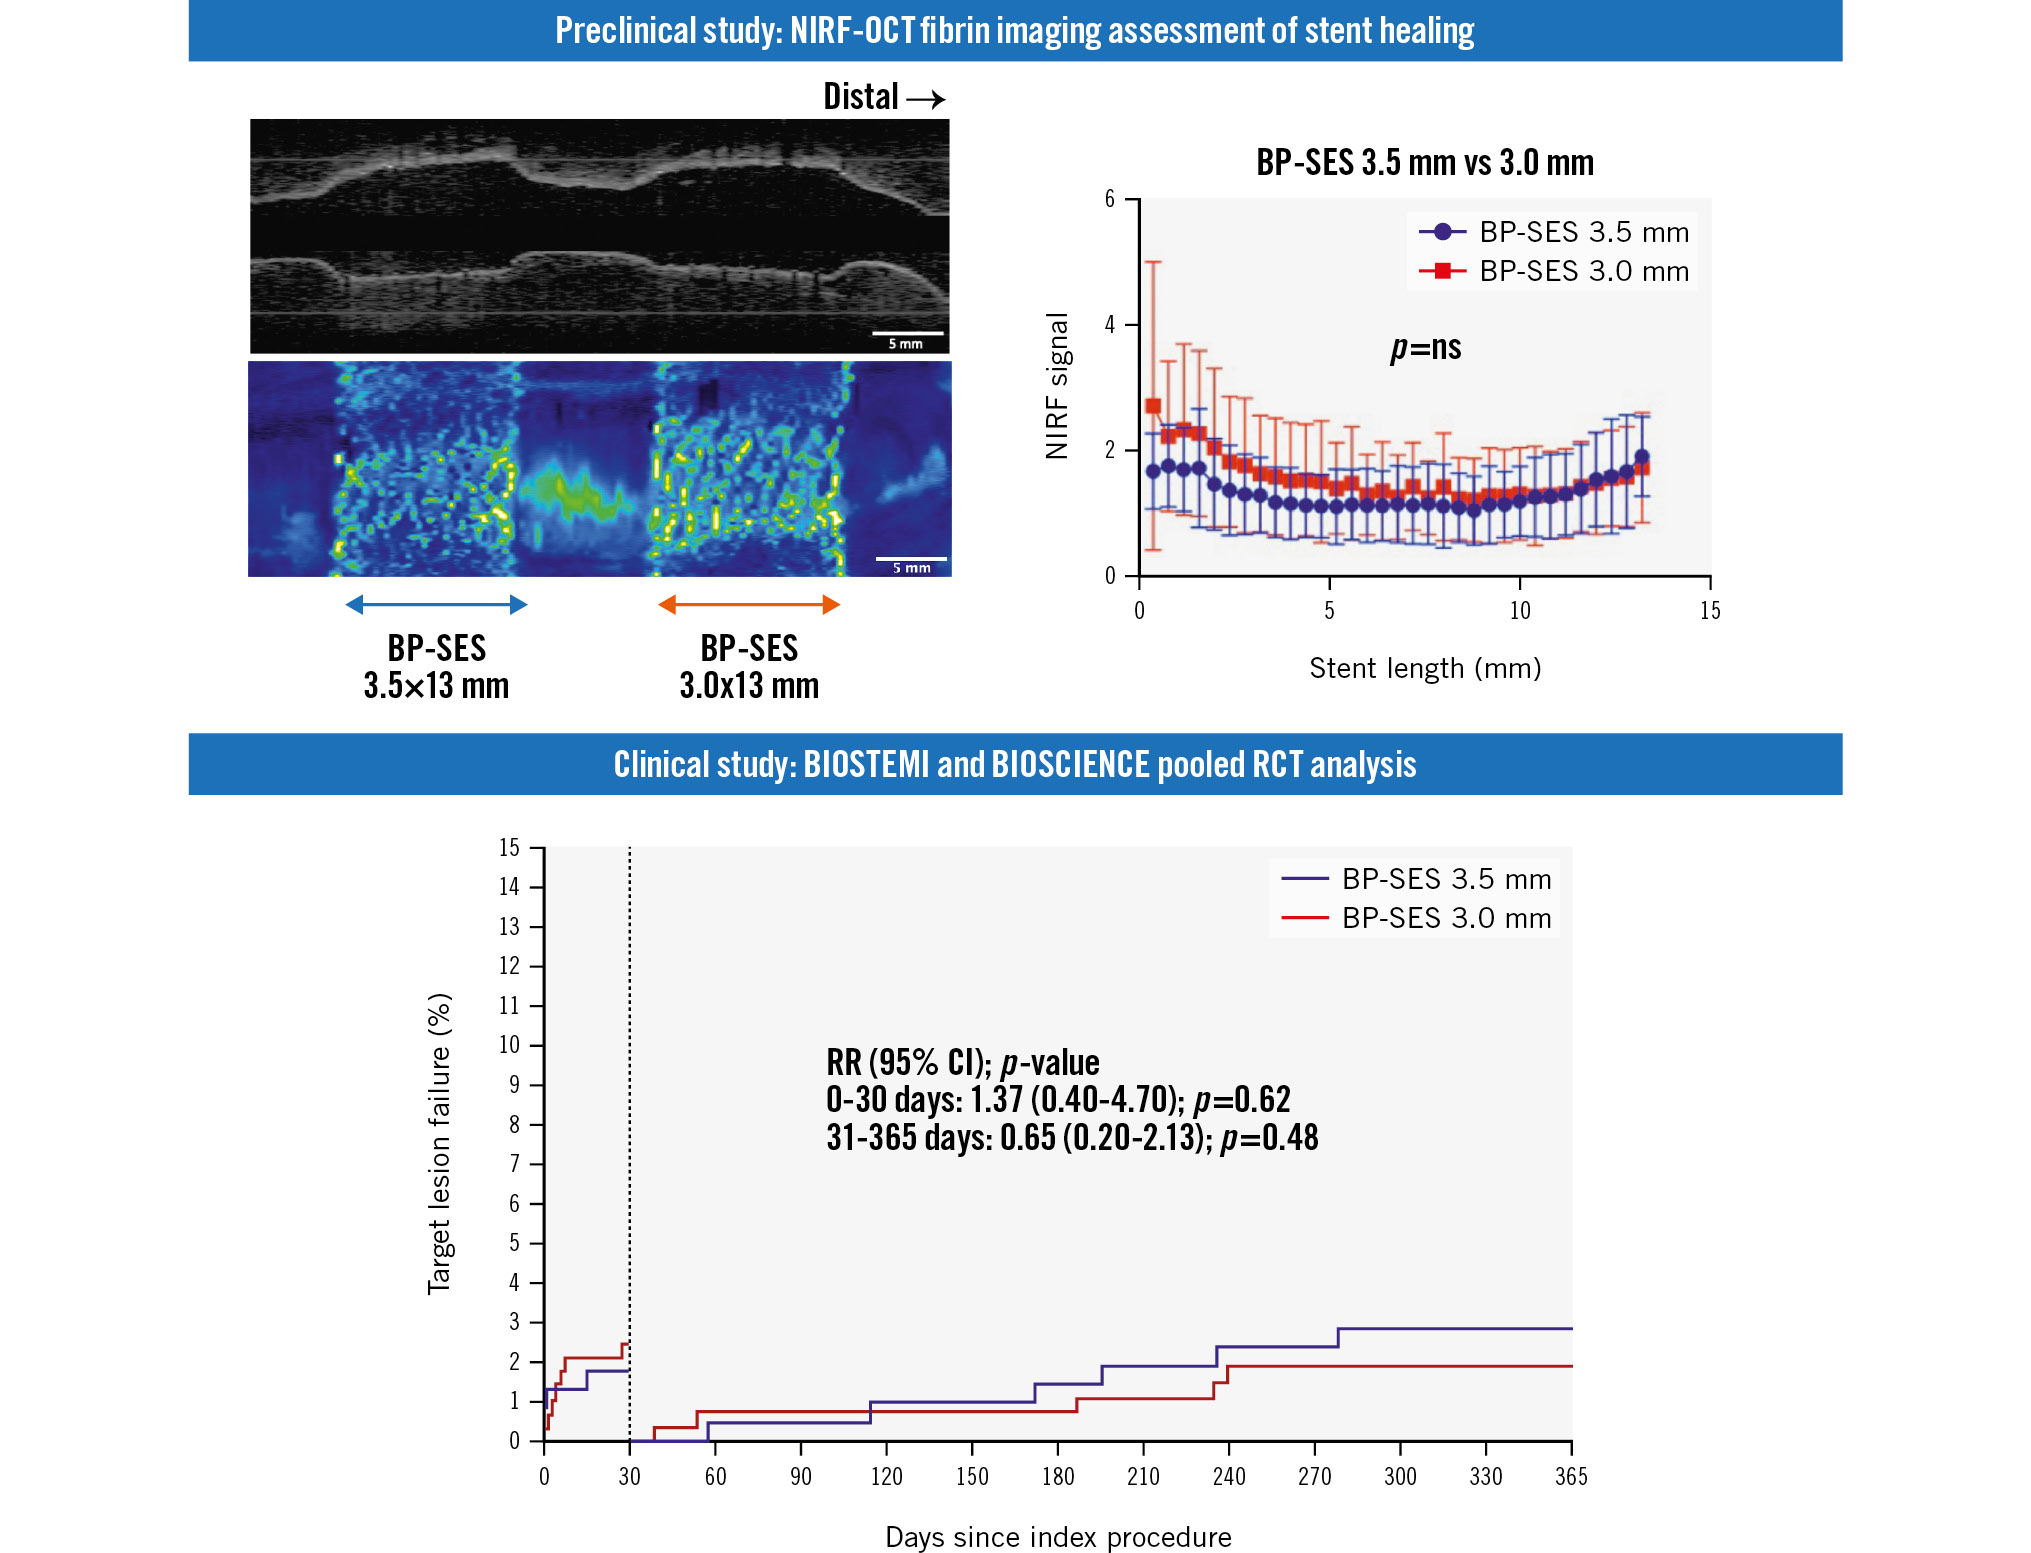
Central illustration. Preclinical and clinical investigation of ultrathin-strut versus thin-strut BP-SES shows similar early healing and 1-year clinical outcomes. BP-SES: biodegradable-polymer sirolimus-eluting stent; CI: confidence interval; NIRF: near-infrared fluorescence; ns: non-significant; OCT: optical coherence tomography; RCT: randomised controlled trial; RR: risk ratio
Funding
The following NIH grants provided funding for our study: R01HL137913, R01HL144550, R01HL150538, R01HL165453. The NIRF-OCT system was developed in part under R01HL093717 to Guillermo J. Tearney. Elazer R. Edelman was funded in part by NIH R01HL161069. FTP11-CyAm7 was synthesised under Halfond-Weil fellowship and AHA953662 to Khanh Ha. The BIOSCIENCE and BIOSTEMI trials were supported by dedicated grants from Biotronik.
Conflict of interest statement
F.A. Jaffer - sponsored research: Canon, Siemens, Shockwave Medical, Teleflex, Amarin, Mercator, Boston Scientific, HeartFlow, and Neovasc; consultant/speaker fees: Boston Scientific, Siemens, Magenta Medical, Philips, Biotronik, Terumo, Mercator, Abiomed, Medtronic, and FastWave; and equity interest: Intravascular Imaging Inc, DurVena, and FastWave. G.J. Tearney - sponsored research: Merck Sharp & Dohme and Canon; catheter components: Terumo; consultant: Samsung; consultant and board member and holds equity: SpectraWAVE. Massachusetts General Hospital - licensing arrangements: Terumo, Canon, SpectraWAVE, for which G.J. Tearney and F.A. Jaffer have the right to receive royalties. J.F. Iglesias - research grant to the institution and personal fees from Biotronik during the conduct of the BIOSTEMI trial; research grants to the institution from Abbott, AstraZeneca, Biosensors, Biotronik, Concept Medical, Philips Volcano, and Terumo Corp., outside of the submitted work; personal fees from AstraZeneca, Biotronik, Bristol-Myers Squibb, MedAlliance, Novartis, Terumo, Medtronic, Philips Volcano, and Cordis, outside the submitted work; consultant for Biotronik, Cordis, Medtronic, ReCor Medical, and Terumo Corp. T. Pilgrim - received research grants to the institution from Biotronik, Boston Scientific, and Edwards Lifesciences; and speaker fees/consultancy from Biotronik, Boston Scientific, Edwards Lifesciences, Abbott, Medtronic, and HighLife SAS. D. Heg - employed by CTU Bern, University of Bern, which has a staff policy of not accepting honoraria or consultancy fees; however, CTU Bern is involved in the design, conduct, or analysis of clinical studies funded by not-for-profit and for-profit organisations; in particular, pharmaceutical and medical device companies provide direct funding to some of these studies; for an up-to-date list of CTU Bern’s conflicts of interest see https://www.ctu.unibe.ch/research_projects/declaration_of_interest/index_eng.html. D.E. Kandzari - institutional research/grant support from Biotronik, Boston Scientific, CSI, Medtronic, OrbusNeich, and Teleflex; and personal consulting honoraria from CSI, Medtronic, and Orchestra BioMed. The other authors have no conflicts of interest to declare.Impact on daily practiceThis preclinical and clinical investigation of biodegradable-polymer sirolimus-eluting stents (BP-SES) demonstrates that ultrathin-strut thickness does not appear to modulate the observed benefits of BP-SES. Therefore, use of BP-SES might improve percutaneous coronary intervention outcomes independent of stent strut thickness.
Supplementary data
To read the full content of this article, please download the PDF.