Abstract
BACKGROUND: Little is known about the effects of left ventricular ejection fraction (LVEF) worsening after transcatheter edge-to-edge valve repair (TEER) for mitral regurgitation (MR).
AIMS: This study investigated the predictors and clinical impact of LVEF worsening after TEER for primary MR (PMR) and secondary MR (SMR).
METHODS: This study included 2,019 patients (493 with PMR and 1,526 with SMR) undergoing successful TEER (postprocedural MR grade ≤2+) in the OCEAN-Mitral registry. The patients were categorised into worsened LVEF (wEF), defined as a relative decrease of >12.9% in LVEF at discharge, and preserved LVEF (pEF). The serial changes in left ventricular (LV) function at 1 year were also evaluated.
RESULTS: Following TEER, 657 (32%) patients demonstrated wEF. The pEF group demonstrated both decreased left ventricular end-diastolic volumes (LVEDV) and end-systolic volumes (LVESV), and the wEF group showed significantly increased LVESV at discharge. Higher LVEF, larger LVEDV, higher B-type natriuretic peptide levels, and moderate/severe aortic regurgitation predicted wEF. Compared with baseline, the wEF group still demonstrated lower LVEF (46% to 43%; p<0.001) but significantly increased stroke volume (48 mL to 53 mL; p=0.001) at 1 year. The incidence of death or heart failure hospitalisation was similar between the wEF and pEF groups (hazard ratio 1.14, 95% confidence interval: 0.72-1.80; p=0.84) and also in patients with PMR and SMR.
CONCLUSIONS: LVEF worsening after TEER was not uncommon and was caused by the increased LVESV. LV volumes and some patient-specific factors predicted worsened LVEF which was not associated with long-term clinical outcomes. OCEAN-Mitral registry: UMIN-CTR ID: UMIN000023653.
Transcatheter edge-to-edge repair (TEER) for mitral regurgitation (MR) is becoming a popular and promising alternative for treating primary MR (PMR) and secondary MR (SMR) in high surgical risk patients. Moderate or severe MR progressively reduces left ventricular (LV) function and causes congestive heart failure1. A persistent imbalance in preload and afterload due to MR may lead to LV remodelling and poor long-term prognosis2. LV ejection fraction (LVEF) worsens immediately following surgical mitral valve repair and has increased postoperative mortality34. Several factors can cause LV systolic dysfunction, including open-heart surgery, cardiopulmonary bypass, and cardioplegic arrest. In patients undergoing mitral valve surgery, pulmonary hypertension, atrial fibrillation, low preoperative LVEF, and large LV have been reported to predict a reduced postoperative LVEF456. In contrast, in patients undergoing TEER, a procedure that does not require open-heart surgery or cardiac arrest, myocardial damage due to increased afterload after MR reduction may be the only factor leading to reduced LVEF. Several studies have reported postinterventional changes in LVEF after TEER, but their predictors have not been investigated7891011. A few studies with limited sample sizes reported the clinical outcomes of patients who experienced LVEF reduction, but the clinical impact of worsened LVEF in patients with PMR and SMR remains unclear.
This study aimed to investigate the predictors and clinical impact of LVEF worsening after successful MR reduction with TEER from a large-scale registry and evaluate them in PMR and SMR separately.
Methods
STUDY POPULATION
The Optimized CathEter vAlvular iNtervention (OCEAN)-Mitral registry is an ongoing, prospective, investigator-initiated, multicentre registry assessing the safety and efficacy of TEER for patients with significant MR. This registry included 21 Japanese institutions. Acute and 1-year outcomes have previously been reported1213. From April 2018 to June 2021, 2,150 consecutive patients with symptomatic MR underwent TEER with the MitraClip (Abbott) device. The multidisciplinary local Heart Team, consisting of an interventional cardiologist, a cardiothoracic surgeon, and an echocardiologist, reviewed patient data. This study excluded 131 patients due to unsuccessful TEER procedures (postprocedural MR ≥3; n=97), early surgical mitral valve interventions (n=8), or inadequate echocardiographic images at baseline and at discharge follow-up (n=26). Therefore, the analysis included 2,019 patients. This study was registered with the University Hospital Medical Information Network Clinical Trials Registry, as accepted by the International Committee of Medical Journal Editors (UMIN000023653). The institutional review board of each institution approved the study protocol. This study was conducted under the provisions of the Declaration of Helsinki and the guidelines for epidemiological studies issued by the Ministry of Health, Labour, and Welfare of Japan.
TEER PROCEDURE
TEER with the MitraClip device was performed under general anaesthesia with fluoroscopic and transoesophageal echocardiographic guidance as previously described1. After transseptal puncture through femoral vein access, a 24 Fr guiding catheter is advanced into the left atrium. The clip delivery system is inserted above the MR jet origin and then advanced into the LV. The mitral leaflets are grasped, and the clip is closed to approximate the leaflets. If adequate MR reduction is obtained without relevant mitral stenosis, assessed by transmitral mean pressure gradient, the clip is released. If further reduction of MR is necessary, a second clip implantation is considered.
ECHOCARDIOGRAPHIC EVALUATION
All echocardiographic examinations were carried out by trained sonographers using high-quality cardiovascular ultrasound systems at baseline, discharge, and 1 year. MR severity was graded according to the American Society of Echocardiography guidelines based on a validated multi-integrative method14. Both qualitative (colour flow mapping) as well as quantitative measurements (proximal velocity surface area whenever feasible) were used to grade the MR severity from grades 0 to 4 (grade 0: no/trace; grade 1: mild; grade 2: moderate; grade 3: moderate to severe; grade 4: severe). LV end-diastolic and end-systolic diameters were measured using two-dimensional images. The LV outflow tract velocity time integral values were measured at the timing of the most averaged RR interval on the electrocardiogram. Patients were categorised into two groups according to the occurrence of LVEF worsening as either worsened LVEF (wEF) or preserved LVEF (pEF). The change in LVEF was assessed by calculating the percentage of changes as follows: (early postinterventional LVEF−preinterventional LVEF)/preoperative LVEF. This study defined wEF as a >12.9% decrease in LVEF, which represented the median value of LVEF reduction and was considered the threshold to determine LVEF worsening. Further, the changes in LVEF, LV end-diastolic volume (LVEDV), LV end-systolic volume (LVESV), and stroke volume (SV) were assessed at 1 year, and these changes were compared between the wEF and pEF groups. The biplane Simpson disk method, from the apical 4- and 2-chamber views, was used to calculate LVEF, LVEDV, and LVESV. SV was calculated non-invasively by measuring the Doppler-derived velocity time integral of the left ventricular outflow tract. The degree of MR reduction was calculated based on the difference in the MR grade between pre- and post-TEER (preinterventional grade–postinterventional grade).
CLINICAL FOLLOW-UP
The primary study endpoint includes a composite of all-cause death and hospitalisation for heart failure. The secondary endpoint includes all-cause death, hospitalisation for heart failure, and the New York Heart Association (NYHA) Functional Class at 1 year. Information on survival status and clinical events was obtained from patient records or telephone calls with the patient, the patient’s family, or family physicians.
STATISTICAL ANALYSIS
Categorical variables are reported as numbers with relative percentages and were compared using the chi-square test or Fisher’s exact test. Continuous variables are presented as mean±standard deviation or median [interquartile range]. Paired and unpaired Student’s t-tests were used to compare continuous variables with a normal distribution, and the Mann-Whitney U test or Wilcoxon signe-rank test was used to compare those without a normal distribution. The Bonferroni correction was used for post hoc analysis. The Kaplan-Meier method was used to estimate the cumulative incidences of clinical events, and the log-rank test was used to assess differences. The multivariate logistic regression analysis was used to calculate independent predictors of worsened LVEF, and a multivariable Cox proportional hazard model was used to obtain the hazard ratio (HR) of wEF for the primary and secondary endpoints. The multivariate model included statistically significant variables (p<0.05) from the univariate analysis. The results were expressed as odds ratios (OR) and HR with associated 95% confidence intervals (CI). In addition, a restricted cubic spline with 5 knots was used to show a continuous relationship between the rate of change in LVEF and adjusted HR for the primary endpoint. The locations of the 5 knots were determined as the 5th, 27.5th, 50th, 72.5th, and 95th percentiles of the distribution of the change in LVEF. The reference value for the rate of change in LVEF was set at −12.9%, which was the median value of LVEF reduction in the study population. The HR was adjusted for statistically significant variables for the primary endpoint in univariate analysis. JMP (version 10.0 for Windows [SAS Institute]) or Stata 17 (StataCorp) were used for all statistical analyses.
Results
BASELINE PATIENT CHARACTERISTICS AND PERIPROCEDURAL RESULTS
Among the 2,019 patients of this study, 657 (32%) demonstrated >12.9% decrease in LVEF. Therefore, there were 657 patients in the wEF group and 1,362 patients in the pEF group. Table 1 shows the baseline clinical characteristics. Compared with the pEF group, the wEF group showed more history of ventricular tachycardia or fibrillation and cardiac resynchronisation therapy. Diuretics were more commonly used in the wEF group. The atrial fibrillation prevalence was lower in the wEF group. Table 2 summarises the echocardiographic findings. The wEF group included 184 of the total 493 patients with PMR (37%) and 473 of the 1,526 patients with SMR (31%). The wEF group had a higher PMR prevalence, more severe MR, more pulmonary hypertension, and more moderate or severe aortic and tricuspid regurgitation. Additionally, the wEF group demonstrated larger LVEDV, larger LVESV, larger left atrial volume index, and lower SV. Table 3 presents the periprocedural results. The wEF group had a higher prevalence of multiple clip implantation and a longer procedure time. The echocardiographic results at discharge showed lower LVEF and larger LV volumes in the wEF group. Figure 1 shows the degree of MR reduction in the wEF and pEF groups. The degree of MR reduction was greater in the wEF group than in the pEF group, and the patients with wEF were more likely to have an MR grade reduction ≥3 (Table 3). This trend was similarly observed in both SMR and PMR (SMR: wEF 49.9% vs pEF 44.2%; p=0.04; PMR: wEF 72.3% vs pEF 60.8%; p=0.01). The residual MR grade did not differ between the two groups, but SV was significantly lower in the wEF group.
Table 1. Baseline demographic and clinical characteristics.
| Total n=2,019 | wEF n=657 | pEF n=1,362 | p-value | |
|---|---|---|---|---|
| Clinical | ||||
| Male | 1,127 (55.8) | 374 (56.9) | 753 (55.3) | 0.50 |
| Age, years | 78.3±9.5 | 78.2±9.4 | 78.4±9.5 | 0.68 |
| Body surface area, m2 | 1.5±0.2 | 1.5±0.2 | 1.5±0.2 | 0.27 |
| Hypertension | 1,363 (67.5) | 434 (66.1) | 929 (68.2) | 0.33 |
| Dyslipidaemia | 1,041 (51.6) | 338 (51.5) | 703 (51.6) | 0.96 |
| Diabetes | 552 (27.3) | 188 (27.3) | 364 (26.7) | 0.39 |
| Smokers | 687 (34.0) | 237 (36.1) | 450 (33.0) | 0.19 |
| Bleeding | 130 (6.5) | 49 (7.5) | 81 (6.0) | 0.21 |
| Atrial fibrillation | 1,281 (63.5) | 393 (59.8) | 888 (65.2) | 0.02 |
| Ventricular tachycardia or fibrillation | 212 (10.5) | 87 (13.2) | 125 (9.2) | 0.007 |
| Previous coronary artery disease | 731 (36.2) | 235 (35.8) | 496 (36.4) | 0.80 |
| Prior stroke | 231 (11.4) | 69 (10.5) | 162 (11.9) | 0.37 |
| Open-heart surgery | 224 (11.1) | 63 (9.6) | 161 (11.8) | 0.15 |
| Peripheral vascular disease | 208 (10.3) | 73 (11.1) | 135 (9.9) | 0.41 |
| Chronic obstructive pulmonary disease | 199 (9.9) | 67 (10.3) | 132 (9.7) | 0.75 |
| Dialysis dependent | 103 (5.1) | 33 (5.0) | 70 (5.1) | 1.00 |
| STS score for mitral valve repair, % | 6.3 [3.6-10.1] | 6.6 [3.6-10.3] | 6.2 [3.6-10.1] | 0.62 |
| EuroSCORE II, % | 4.7 [3.0-8.0] | 4.6 [2.7-8.0] | 4.8 [8.1-3.1] | 0.15 |
| Haemoglobin, g/dL | 11.7±1.9 | 11.7±1.9 | 11.7±1.9 | 0.42 |
| eGFR, mL/min/1.73 m2 | 39.5±19.2 | 39.4±19.3 | 39.6±19.2 | 0.90 |
| BNP, pg/mL | 336.8 [168.7-675.0] | 405.2 [200.1-785.9] | 309.1 [160.9-627.3] | 0.001 |
| Related to heart failure | ||||
| NYHA Functional Class | 0.03 | |||
| I | 44 (2.2) | 16 (2.4) | 28 (2.1) | |
| II | 703 (34.8) | 210 (32.0) | 493 (36.2) | |
| III | 993 (49.2) | 320 (48.7) | 673 (49.4) | |
| IV | 279 (13.8) | 111 (16.9) | 168 (12.3) | |
| NYHA Functional Class ≥III | 1,272 (63.0) | 431 (65.6) | 841 (61.8) | 0.09 |
| Hospitalisation for heart failure within the previous 1 year | 1,455 (72.3) | 469 (71.4) | 986 (72.7) | 0.56 |
| Previous cardiac resynchronisation therapy | 207 (10.3) | 85 (12.9) | 122 (9.0) | 0.01 |
| Previous implantation of a defibrillator | 283 (14.0) | 101 (15.4) | 182 (13.4) | 0.24 |
| Medications at baseline | ||||
| Beta blocker | 1,519 (75.2) | 481 (73.2) | 1,038 (76.2) | 0.15 |
| ACEI, ARB or ARNI | 1,255 (62.2) | 395 (60.1) | 860 (63.1) | 0.20 |
| Mineralocorticoid receptor antagonist | 1,109 (54.9) | 376 (57.2) | 733 (53.8) | 0.15 |
| SGLT-2 inhibitors | 204 (10.1) | 67 (10.2) | 137 (10.1) | 0.94 |
| Diuretic | 1,760 (87.2) | 592 (90.1) | 1,168 (85.8) | 0.01 |
| Oral anticoagulant agent | 1,296 (64.2) | 412 (62.7) | 884 (64.9) | 0.35 |
| Oral antiplatelet agent | 823 (40.8) | 273 (41.6) | 550 (40.4) | 0.63 |
| Data are presented as the mean value±standard deviation, median [interquartile range], or as a proportion, n (%). ACEI: angiotensin-converting enzyme inhibitor; ARB: angiotensin receptor blocker; ARNI: angiotensin receptor-neprilysin inhibitor; BNP: B-type natriuretic peptide; eGFR: estimated glomerular filtration rate; EuroSCORE: European System for Cardiac Operative Risk Evaluation; NYHA: New York Heart Association; pEF: preserved left ventricular ejection fraction; SGLT-2: sodium-glucose cotransporter 2; STS: Society of Thoracic Surgeons; wEF: worsened left ventricular ejection fraction | ||||
Table 2. Baseline echocardiographic parameters.
| Total n=2,019 | wEF n=657 | pEF n=1,362 | p-value | |
|---|---|---|---|---|
| Severity of MR | ||||
| ≤Moderate, ≤grade 2+ | 263 (13.0) | 54 (8.2) | 209 (15.3) | <0.0001 |
| Moderate to severe, grade 3+ | 522 (25.9) | 137 (20.9) | 385 (28.3) | 0.0003 |
| Severe, grade 4+ | 1,234 (61.1) | 466 (70.9) | 768 (56.4) | <0.0001 |
| Cause of MR | 0.01 | |||
| Primary | 493 (24.4) | 184 (28.0) | 309 (22.7) | |
| Secondary | 1,526 (75.6) | 473 (72.0) | 1,053 (77.3) | |
| Ischaemic MR | 454 (29.8) | 151 (31.9) | 303 (28.8) | 0.23 |
| EROA, cm2 | 0.39±0.25 | 0.43±0.24 | 0.37±0.25 | <0.0001 |
| Regurgitant volume, mL/beat | 55.9±25.8 | 59.9±28.4 | 54.0±24.4 | <0.0001 |
| Mitral valve orifice area, cm2 | 5.3±1.6 | 5.4±1.6 | 5.3±1.6 | 0.12 |
| Transmitral mean pressure gradient, mmHg | 1.8±1.2 | 1.9±1.1 | 1.7±1.2 | 0.07 |
| LVDs, mm | 44.3±13.2 | 45.7±13.8 | 43.7±13.0 | 0.002 |
| LVDd, mm | 57.2±10.2 | 58.8±10.4 | 56.4±10.0 | <0.0001 |
| LVESV, mL | 90.0±63.3 | 92.2±63.6 | 88.9±63.2 | 0.29 |
| LVEDV, mL | 150.3±72.1 | 159.4±72.6 | 146.0±71.9 | <0.0001 |
| LVEF, % | 43 [31-60] | 44 [33-62] | 42 [30-59] | 0.001 |
| Left atrial volume index, mL/m2 | 87.3±44.3 | 90.6±42.9 | 85.7±45.0 | 0.01 |
| LVOT VTI, cm | 14.1±4.7 | 13.7±4.5 | 14.4±4.9 | 0.006 |
| Stroke volume, mL | 48.8±16.3 | 47.7±15.9 | 49.3±16.5 | 0.05 |
| Moderate or severe aortic stenosis | 59 (2.9) | 19 (2.9) | 40 (2.9) | 1.00 |
| Moderate or severe aortic regurgitation | 181 (9.0) | 78 (11.9) | 103 (7.6) | 0.002 |
| Moderate or severe tricuspid regurgitation | 711 (35.3) | 253 (38.6) | 458 (33.7) | 0.03 |
| RVFAC, % | 36.6±10.7 | 36.2±10.8 | 36.7±10.6 | 0.38 |
| Tricuspid regurgitation peak gradient, mmHg | 35.1±14.0 | 36.7±14.7 | 34.3±13.6 | 0.0004 |
| Right ventricular systolic pressure, mmHg | 41.3±15.7 | 43.1±16.2 | 40.5±15.4 | 0.002 |
| Data are presented as the mean value±standard deviation, median [interquartile range], or as a proportion, n (%). EROA: effective regurgitant orifice area; LVDd: left ventricular end-diastolic dimension; LVDs: left ventricular end-systolic dimension; LVEDV: left ventricular end-diastolic volume; LVEF: left ventricular ejection fraction; LVESV: left ventricular end-systolic volume; LVOT VTI: left ventricular outflow tract velocity time integral; MR: mitral regurgitation; pEF: preserved left ventricular ejection fraction; RVFAC: right ventricular fractional area change; wEF: worsened left ventricular ejection fraction | ||||
Table 3. Procedural and echocardiographic parameters at discharge.
| Total n=2,019 | wEF n=657 | pEF n=1,362 | p-value | |
|---|---|---|---|---|
| Procedure | ||||
| Number of MitraClip* devices implanted ≥2 | 781 (38.7) | 296 (45.1) | 485 (35.6) | <0.0001 |
| Total procedure time, min | 95.7±46.5 | 100.2±45.6 | 93.6±46.7 | 0.005 |
| Discharge | ||||
| Mitral regurgitation at discharge | 0.29 | |||
| None-trivial, grade 0 | 386 (19.1) | 121 (18.4) | 152 (23.1) | |
| Mild, grade 1+ | 1,207 (59.8) | 384 (58.5) | 823 (60.4) | |
| Moderate, grade 2+ | 426 (21.1) | 152 (23.1) | 274 (20.1) | |
| Degree of MR reduction ≥3 | 1,022 (50.6) | 369 (56.2) | 653 (47.9) | 0.0006 |
| Transmitral mean pressure gradient, mmHg | 3.0±1.6 | 3.0±1.6 | 3.0±1.5 | 0.77 |
| Mitral valve orifice area, cm2 | 2.7±1.0 | 2.7±1.0 | 2.8±1.0 | 0.11 |
| LVDs, mm | 44.0±13.5 | 46.2±13.9 | 42.9±13.3 | <0.0001 |
| LVDd, mm | 55.3±10.7 | 56.6±11.2 | 54.6±10.5 | 0.0002 |
| LVESV, mL | 90.3±62.9 | 101.0±66.9 | 85.0±60.9 | <0.0001 |
| LVEDV, mL | 141.9±72.0 | 146.6±73.9 | 139.7±71.0 | 0.046 |
| LVEF, % | 40 (29-55) | 34 (25-48) | 44 (32-58) | <0.0001 |
| Rate of change in LVEF, % | −5.5±15.9 | −24.3±10.0 | 3.6±18.0 | <0.0001 |
| LVOT VTI, cm | 14.9±5.1 | 14.0±4.7 | 15.4±5.3 | <0.0001 |
| Stroke volume, mL | 51.6±16.3 | 49.1±15.8 | 52.9±16.5 | <0.0001 |
| Tricuspid regurgitation peak gradient, mmHg | 30.3±10.0 | 29.8±9.8 | 30.6±10.1 | 0.11 |
| RVFAC, % | 39.3±10.1 | 38.4±10.5 | 39.7±10.0 | 0.041 |
| Left atrial volume index, mL/m2 | 80.4±38.5 | 80.6±37.1 | 80.3±39.2 | 0.84 |
| Moderate or severe tricuspid regurgitation | 569 (28.2) | 203 (30.9) | 366 (27.0) | 0.07 |
| Data are presented as the mean value±standard deviation, median [interquartile range], or as a proportion, n (%). *By Abbott. LVDd: left ventricular end-diastolic dimension; LVDs: left ventricular end-systolic dimension; LVEDV: left ventricular end-diastolic volume; LVEF: left ventricular ejection fraction; LVESV: left ventricular end-systolic volume; LVOT VTI: left ventricular outflow tract velocity time integral; MR: mitral regurgitation; pEF: preserved left ventricular ejection fraction; RVFAC: right ventricular fractional area change; wEF: worsened left ventricular ejection fraction | ||||
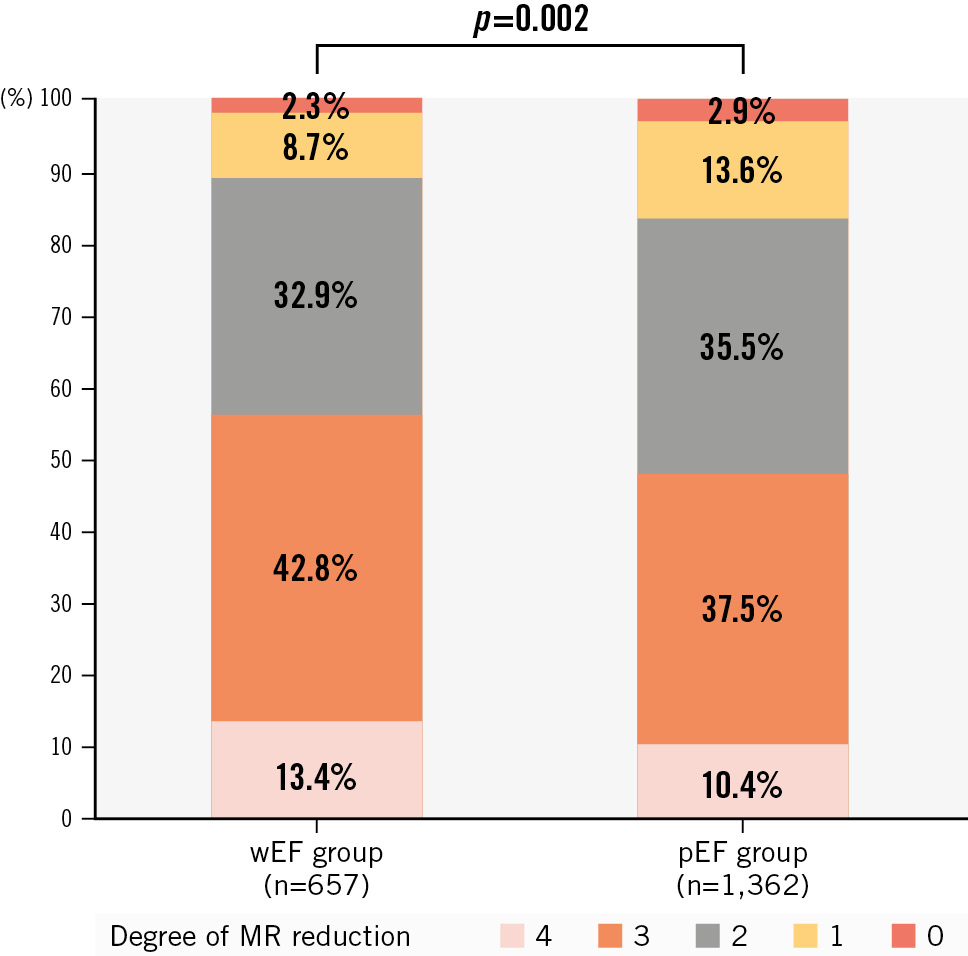
Figure 1. The degree of MR reduction in wEF and pEF groups. LVEF: left ventricular ejection fraction; MR: mitral regurgitation; pEF: patients with preserved LVEF; wEF: patients with worsened LVEF
PREDICTORS OF WORSENED LVEF
Table 4 and the Central illustration show predictors of wEF in multivariable analysis. Higher baseline LVEF (OR 1.01, 95% CI: 1.00-1.01; p<0.0001), larger baseline LVEDV (OR 1.05, 95% CI: 1.03-1.06; p<0.0001), higher baseline B-type natriuretic peptide (BNP) levels (OR 1.00, 95% CI: 1.00-1.00; p=0.02), and moderate or severe aortic regurgitation (OR 1.65, 95% CI: 1.01-2.72; p=0.04) were independently associated with wEF after TEER in the total cohort. Larger baseline LVEDV, smaller baseline LVESV, higher baseline BNP levels, previous cardiac resynchronisation therapy, and longer procedural time were independently associated with wEF in patients with SMR. Higher baseline LVEF, larger LVEDV, a degree of MR reduction ≥3, and lower SV were independently associated with wEF in patients with PMR.
Table 4. Independent predictors of worsened LVEF.
| OR (95% CI) | p-value | |
|---|---|---|
| Overall | ||
| LVEF | 1.01 (1.00-1.01) | <0.0001 |
| LVEDV | 1.05 (1.03-1.06) | <0.0001 |
| BNP | 1.00 (1.00-1.00) | 0.02 |
| Moderate or severe aortic regurgitation | 1.65 (1.01-2.72) | 0.04 |
| Diuretic | 1.55 (0.96-2.49) | 0.07 |
| Moderate or severe tricuspid regurgitation | 1.35 (0.97-1.87) | 0.08 |
| Previous cardiac resynchronisation therapy | 1.53 (0.93-2.52) | 0.09 |
| Atrial fibrillation | 0.76 (0.56-1.04) | 0.10 |
| Procedural time | 1.00 (1.00-1.01) | 0.10 |
| Tricuspid regurgitation peak gradient | 0.99 (0.98-1.00) | 0.10 |
| Stroke volume | 0.99 (0.98-1.00) | 0.12 |
| Ventricular tachycardia or fibrillation | 1.35 (0.84-2.18) | 0.22 |
| Number of implanted clips ≥2 | 1.19 (0.86-1.66) | 0.29 |
| Degree of MR reduction ≥3 | 1.14 (0.84-1.53) | 0.40 |
| EROA | 1.22 (0.70-2.13) | 0.49 |
| Degenerative MR | 1.09 (0.71-1.68) | 0.69 |
| Left atrial volume index | 1.00 (1.00-1.00) | 0.84 |
| SMR | ||
| LVEDV | 1.03 (1.02-1.05) | <0.0001 |
| LVESV | 0.96 (0.94-0.98) | <0.0001 |
| BNP | 1.00 (1.00-1.00) | 0.009 |
| Previous cardiac resynchronisation therapy | 1.87 (1.15-3.03) | 0.01 |
| Procedural time | 1.00 (1.00-1.01) | 0.04 |
| Mineralocorticoid receptor antagonist | 1.41 (0.99-2.00) | 0.06 |
| Moderate or severe aortic regurgitation | 1.68 (0.97-2.92) | 0.06 |
| Atrial fibrillation | 0.74 (0.51-1.06) | 0.10 |
| Stroke volume | 0.99 (0.98-1.00) | 0.11 |
| Diuretic | 1.46 (0.80-2.64) | 0.21 |
| EROA | 1.75 (0.70-4.39) | 0.23 |
| Ventricular tachycardia or fibrillation | 1.22 (0.77-1.94) | 0.40 |
| LVEF | 0.99 (0.96-1.02) | 0.55 |
| Tricuspid regurgitation peak gradient | 1.00 (0.98-1.01) | 0.57 |
| Number of implanted clips ≥2 | 0.99 (0.67-1.46) | 0.94 |
| Degree of MR reduction ≥3 | 1.01 (0.72-1.41) | 0.97 |
| PMR | ||
| LVEF | 1.01 (1.00-1.02) | 0.0002 |
| LVEDV | 0.98 (0.96-1.00) | 0.006 |
| Degree of MR reduction ≥3 | 2.06 (1.15-3.66) | 0.01 |
| Stroke volume | 0.98 (0.96-1.00) | 0.03 |
| Left atrial volume index | 1.01 (1.00-1.01) | 0.07 |
| Chronic obstructive pulmonary disease | 1.97 (0.89-4.39) | 0.09 |
| ACEI/ARB/ARNI | 0.69 (0.41-1.15) | 0.16 |
| Number of implanted clips ≥2 | 1.30 (0.79-2.15) | 0.30 |
| Regurgitant volume | 1.00 (0.99-1.01) | 0.62 |
| Moderate or severe tricuspid regurgitation | 1.13 (0.65-1.97) | 0.66 |
| BNP | 1.00 (0.99-1.01) | 1.00 |
| ACEI: angiotensin-converting enzyme inhibitor; ARB: angiotensin receptor blocker; ARNI: angiotensin receptor-neprilysin inhibitor; BNP: B-type natriuretic peptide; CI: confidence interval; EROA: effective regurgitant orifice area; LVEDV: left ventricular end-diastolic volume; LVEF: left ventricular ejection fraction; LVESV: left ventricular end-systolic volume; MR: mitral regurgitation; OR: odds ratio; PMR: primary mitral regurgitation; SMR: secondary mitral regurgitation | ||
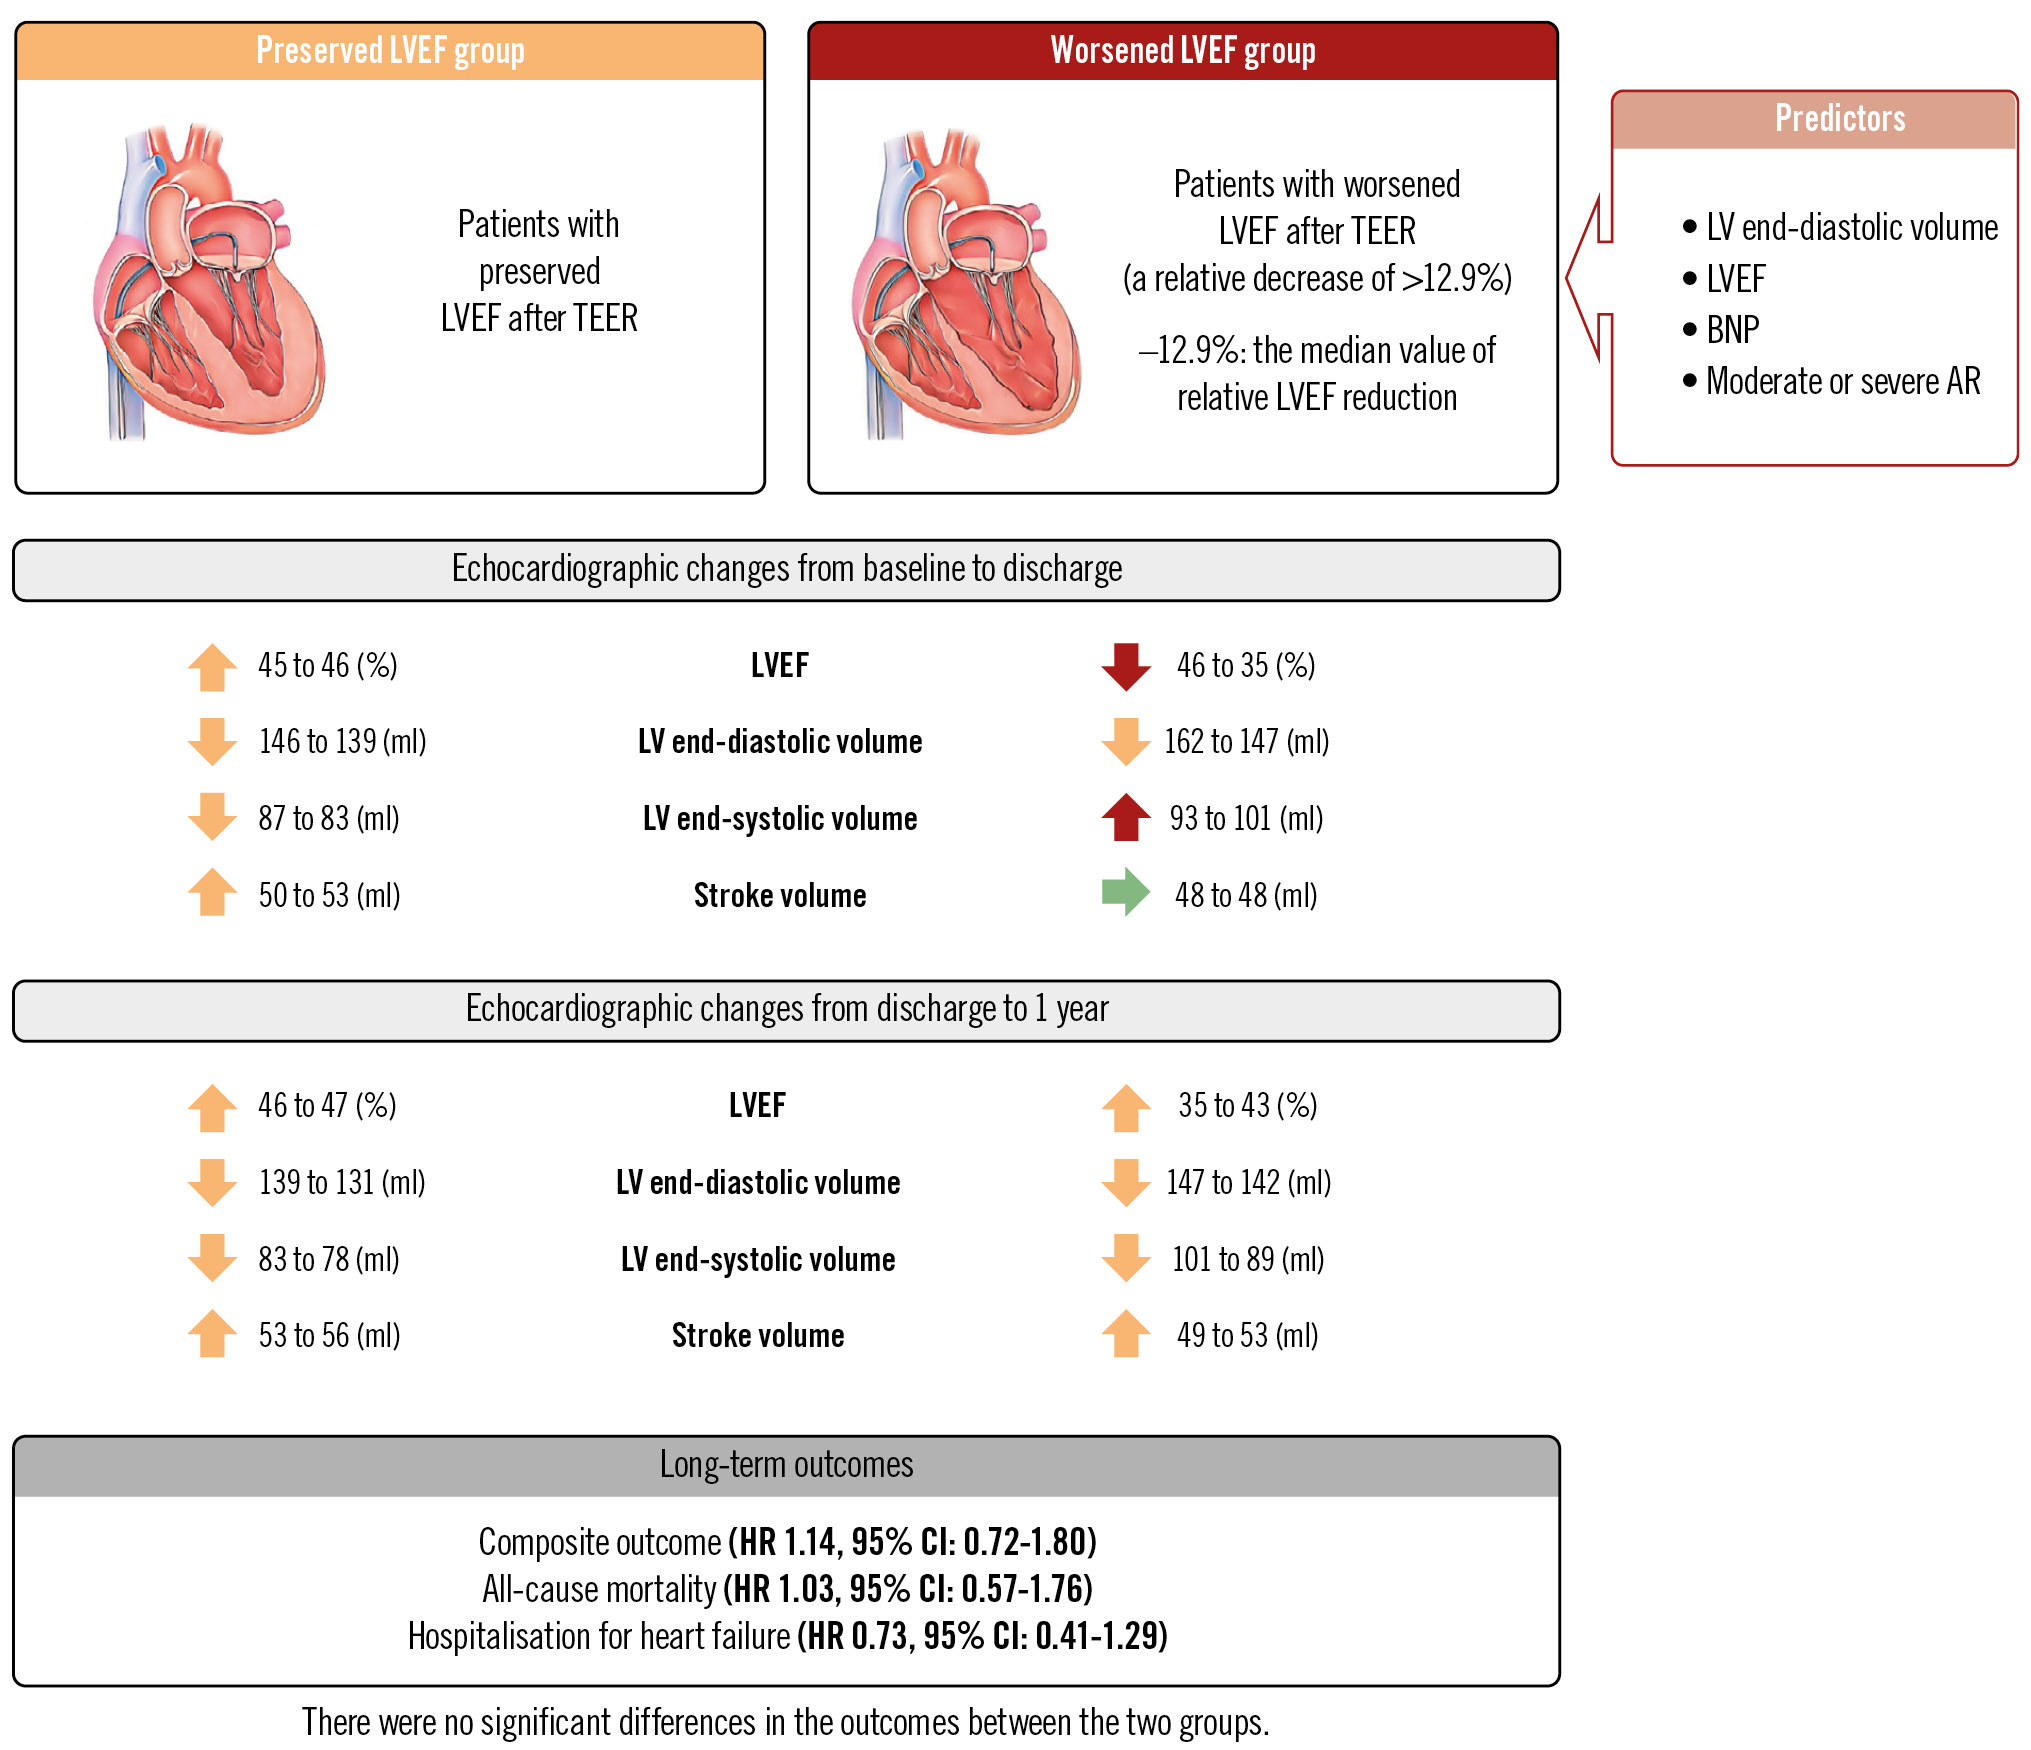
Central illustration. Outcomes of patients undergoing TEER according to LVEF change: predictors and clinical impact of LVEF worsening. The OCEAN-Mitral registry observed worsened LVEF after TEER in approximately 30% of patients with MR mainly due to the increased LV end-systolic volume, but LVEF tended to improve after 1 year with reverse remodelling (the red, orange, and green arrows indicate adverse change, positive change, and no change in the left ventricle, respectively). Worsened LVEF was predicted by LV volume and patient-specific factors, and was not associated with long-term outcomes regardless of MR aetiology. AR: aortic regurgitation; BNP: B-type natriuretic peptide; CI: confidence interval; HR: hazard ratio; LV: left ventricular; LVEF: left ventricular ejection fraction; MR: mitral regurgitation; TEER: transcatheter edge-to-edge valve repair
CHANGES IN LVEF, LV VOLUME, SV, AND CLINICAL OUTCOME
Figure 2 and the Central illustration show the serial changes in LVEF, SV, and LV volumes for 1 year. In the pEF group, LVEF and SV consistently increased and LV volumes decreased from baseline to 1 year. In the wEF group, LVEF and LVESV showed a biphasic pattern: LVEF decreased and LVESV increased after the procedure, but LVEF increased and LVESV decreased at 1 year. Further, LVEDV decreased and SV increased from baseline to 1 year. LVEF remained lower at 1 year than at baseline (from 46% to 43%; p<0.001), but SV significantly increased at 1 year (from 48 mL to 53 mL; p=0.001). Both SMR and PMR demonstrated similar trends (Supplementary Figure 1, Supplementary Figure 2).
Over a follow-up period of 436 days (range: 369-744), 380 deaths and 366 hospitalisations for heart failure were recorded in the total population. There were no significant differences in the primary endpoint between the wEF and pEF groups (HR 1.14, 95% CI: 0.72-1.80; p=0.84) (Figure 3A, Central illustration). The incidences of all-cause death (HR 1.03, 95% CI: 0.57-1.76; p=0.19) and hospitalisation for heart failure (HR 0.73, 95% CI: 0.41-1.29; p=0.49) were also similar between the two groups (Figure 3B, Figure 3C, Central illustration). An improvement of NYHA Functional Class was observed in both the wEF (n=343; p<0.0001) and pEF (n=718; p<0.0001) groups (Figure 4). NYHA Functional Class at baseline was higher in the wEF group than in the pEF group (p=0.03), but there was no significant difference between the two groups at 1 year (p=0.34) (Figure 4). In both SMR and PMR patients, the incidence of the primary endpoint was similar between the wEF and pEF groups (SMR: HR 0.80, 95% CI: 0.48-1.35; p=0.41, PMR: HR 0.58, 95% CI: 0.17-1.99; p=0.58). In addition, the impact of wEF on the primary endpoint was not significant in patients with baseline LVEF <30% (n=400, HR 1.13, 95% CI: 0.57-2.23; p=0.73) or ≥30% (n=1,619, HR 1.03, 95% CI: 0.62-1.70; p=0.91).
The effect of changes in LVEF on the primary endpoint was further investigated. The ratio of changes in LVEF from baseline to discharge was also similar between patients who met and did not meet the primary endpoint (−5.0±22.4% vs −5.7±19.7%; p=0.50). Neither absolute (HR 0.99, 95% CI: 0.95-1.03; p=0.66) nor relative (HR 0.99, 95% CI: 0.97-1.01; p=0.38) changes in LVEF as a continuous variable were associated with the primary endpoint. In a restrictive cubic spline curve, a greater reduction in LVEF did not increase the risk of the primary endpoint (Supplementary Figure 3). These results indicated that the risk of death or heart failure hospitalisation cannot be predicted by greater LVEF reduction.
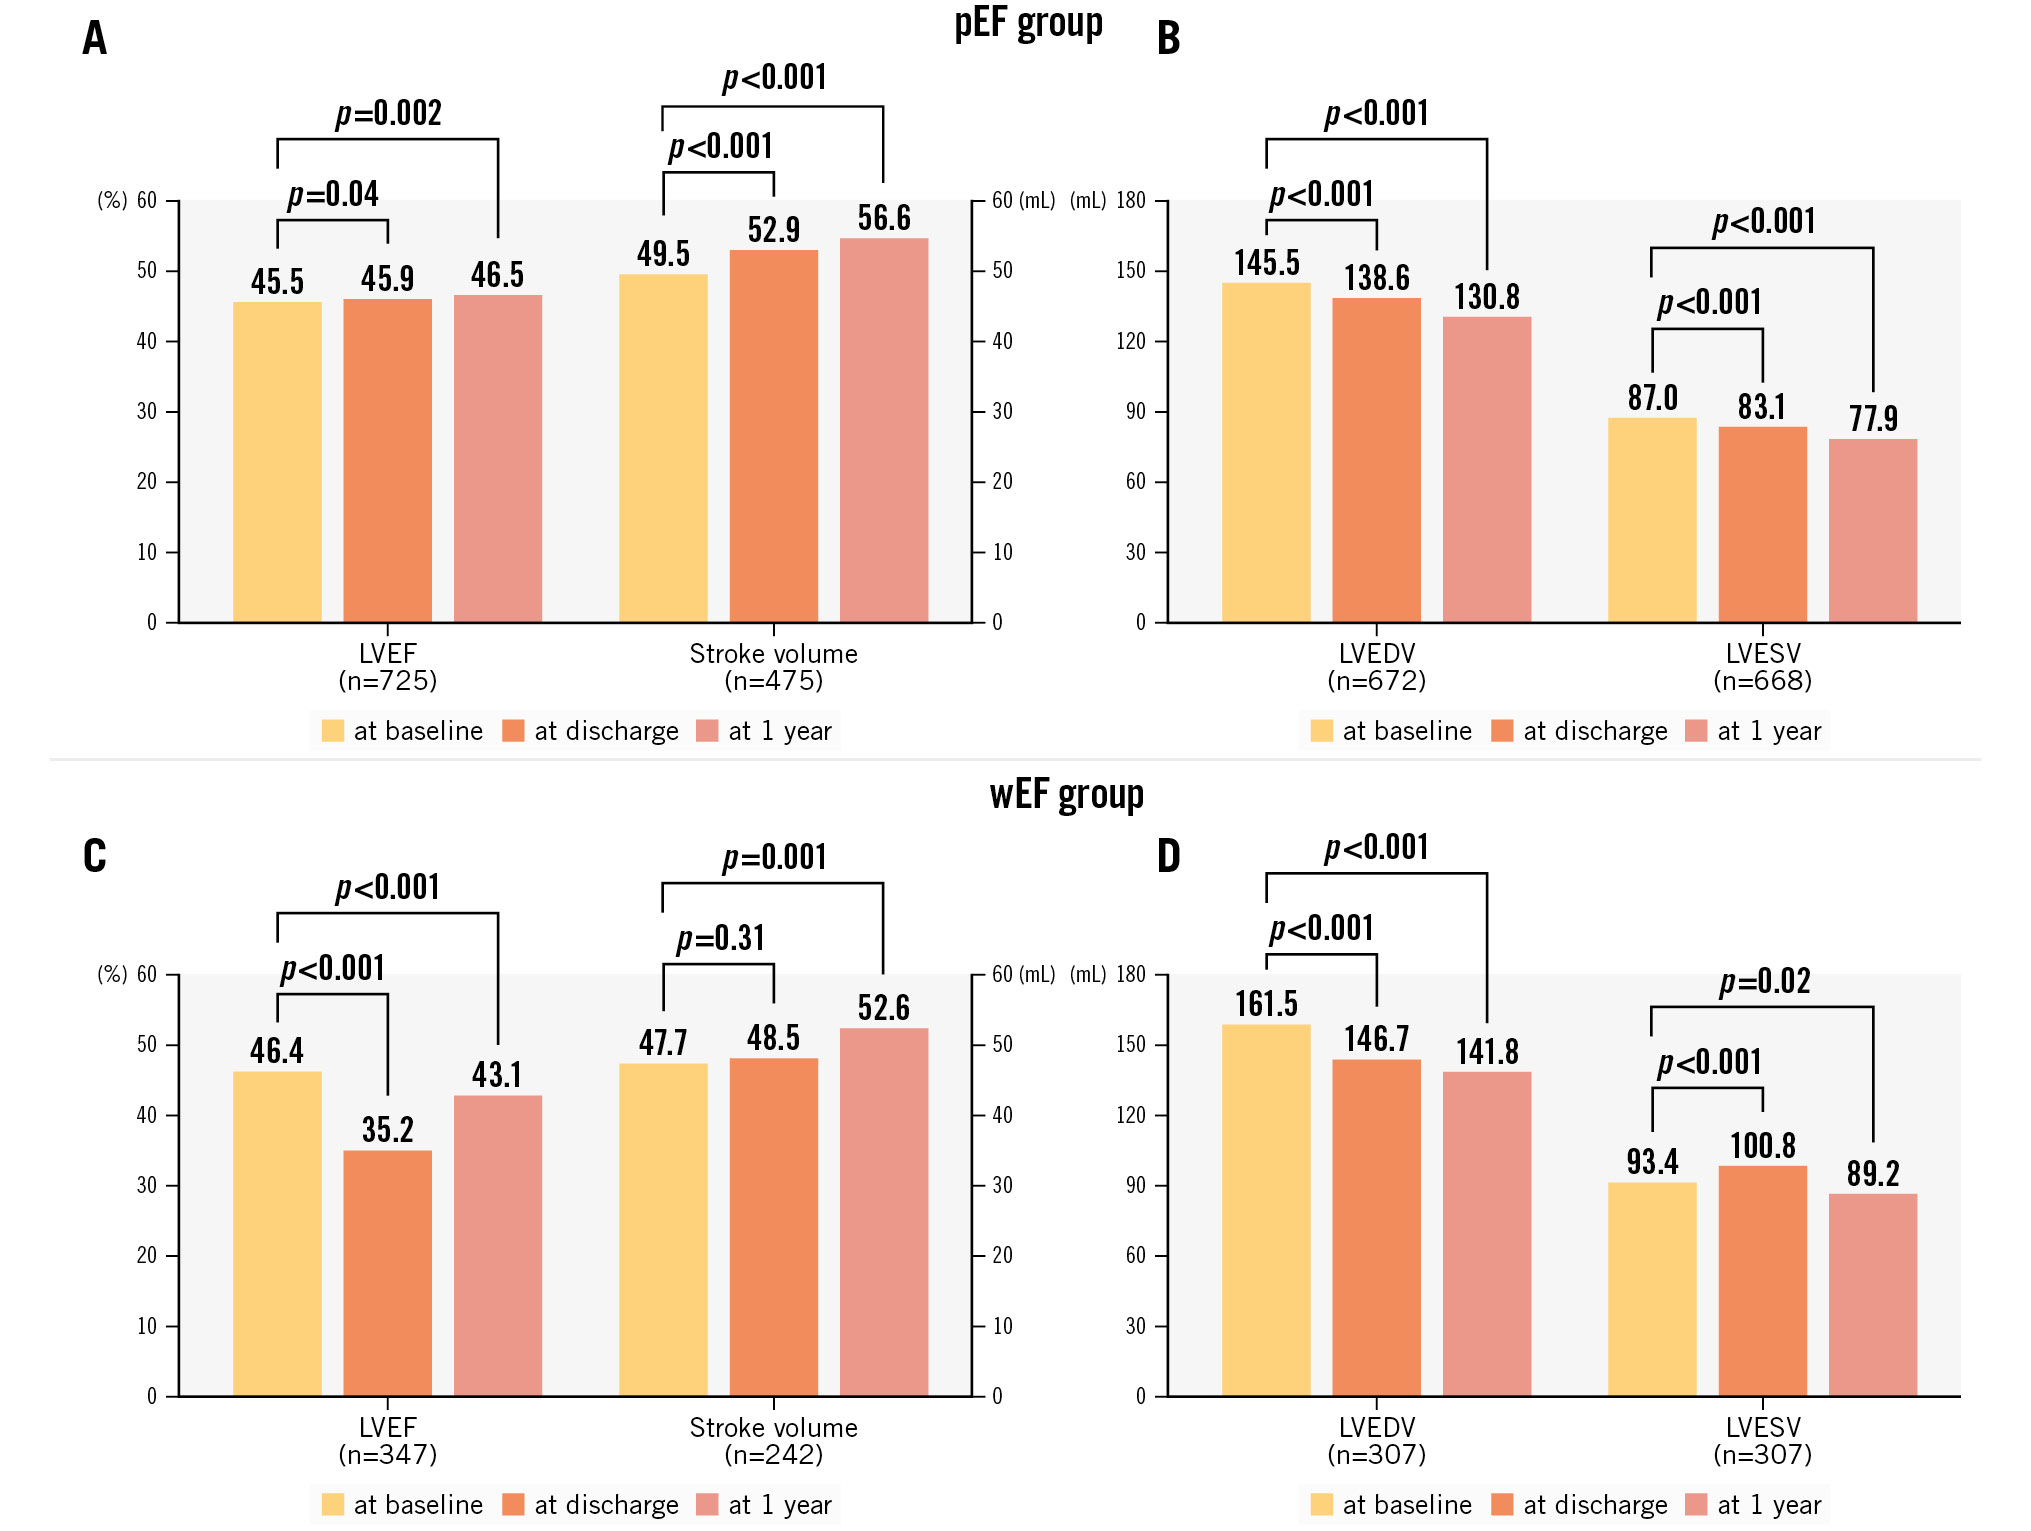
Figure 2. Serial changes in LVEF, stroke volume, and LV volumes. LVEF, stroke volume, LVEDV, and LVESV at baseline, discharge, and 1 year in the pEF groups (A,B) and wEF (C,D). LVEDV: left ventricular end-diastolic volume; LVEF: left ventricular ejection fraction; LVESV: left ventricular end-systolic volume; pEF: patients with preserved LVEF; wEF: patients with worsened LVEF
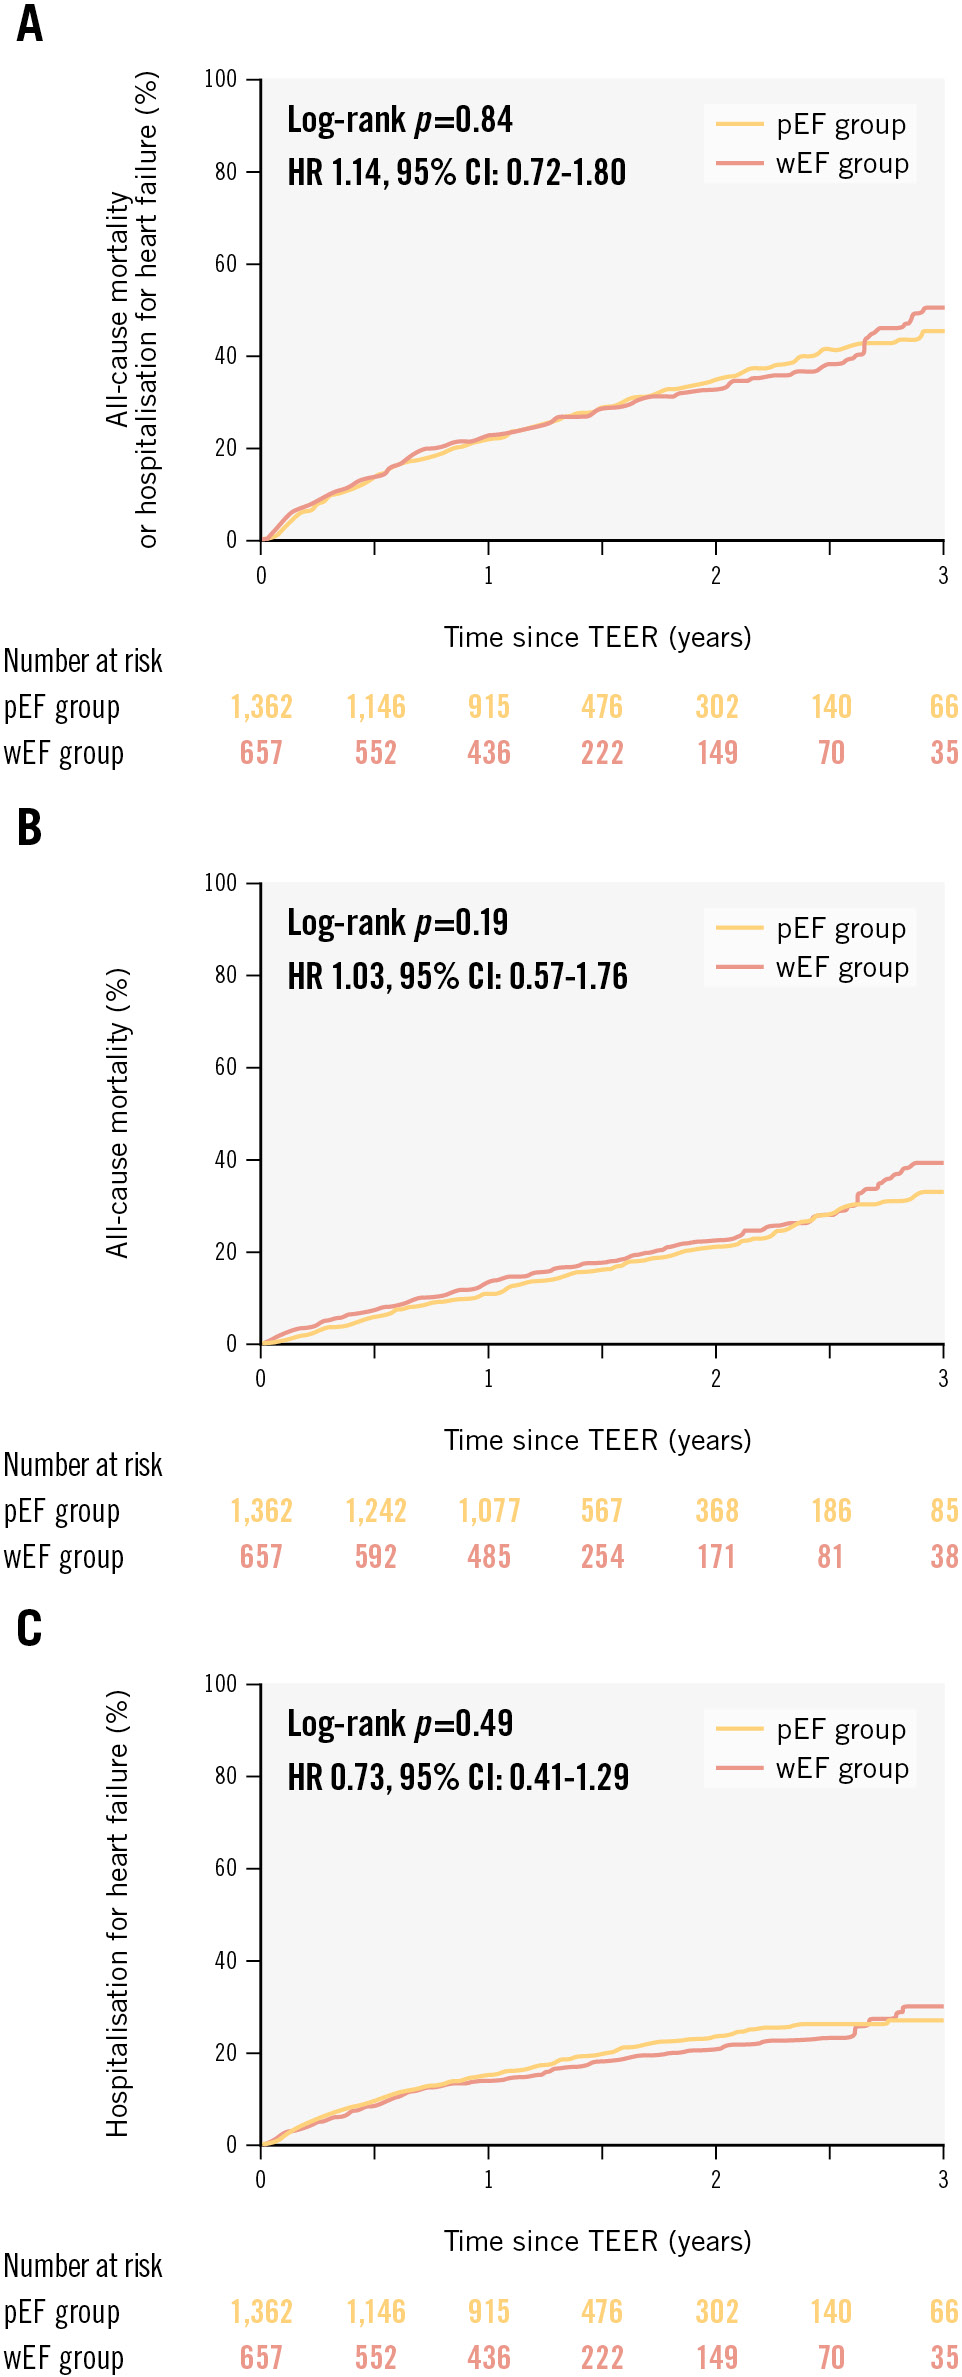
Figure 3. Time-to-first event curves for the primary and secondary endpoints. Kaplan-Meier curves of (A) all-cause mortality or hospitalisation for heart failure, (B) all-cause mortality, and (C) hospitalisation for heart failure, stratified according to LVEF changes after TEER. CI: confidence interval; HR: hazard ratio; LVEF: left ventricular ejection fraction; pEF: patients with preserved LVEF; TEER: transcatheter edge-to-edge repair; wEF: patients with worsened LVEF
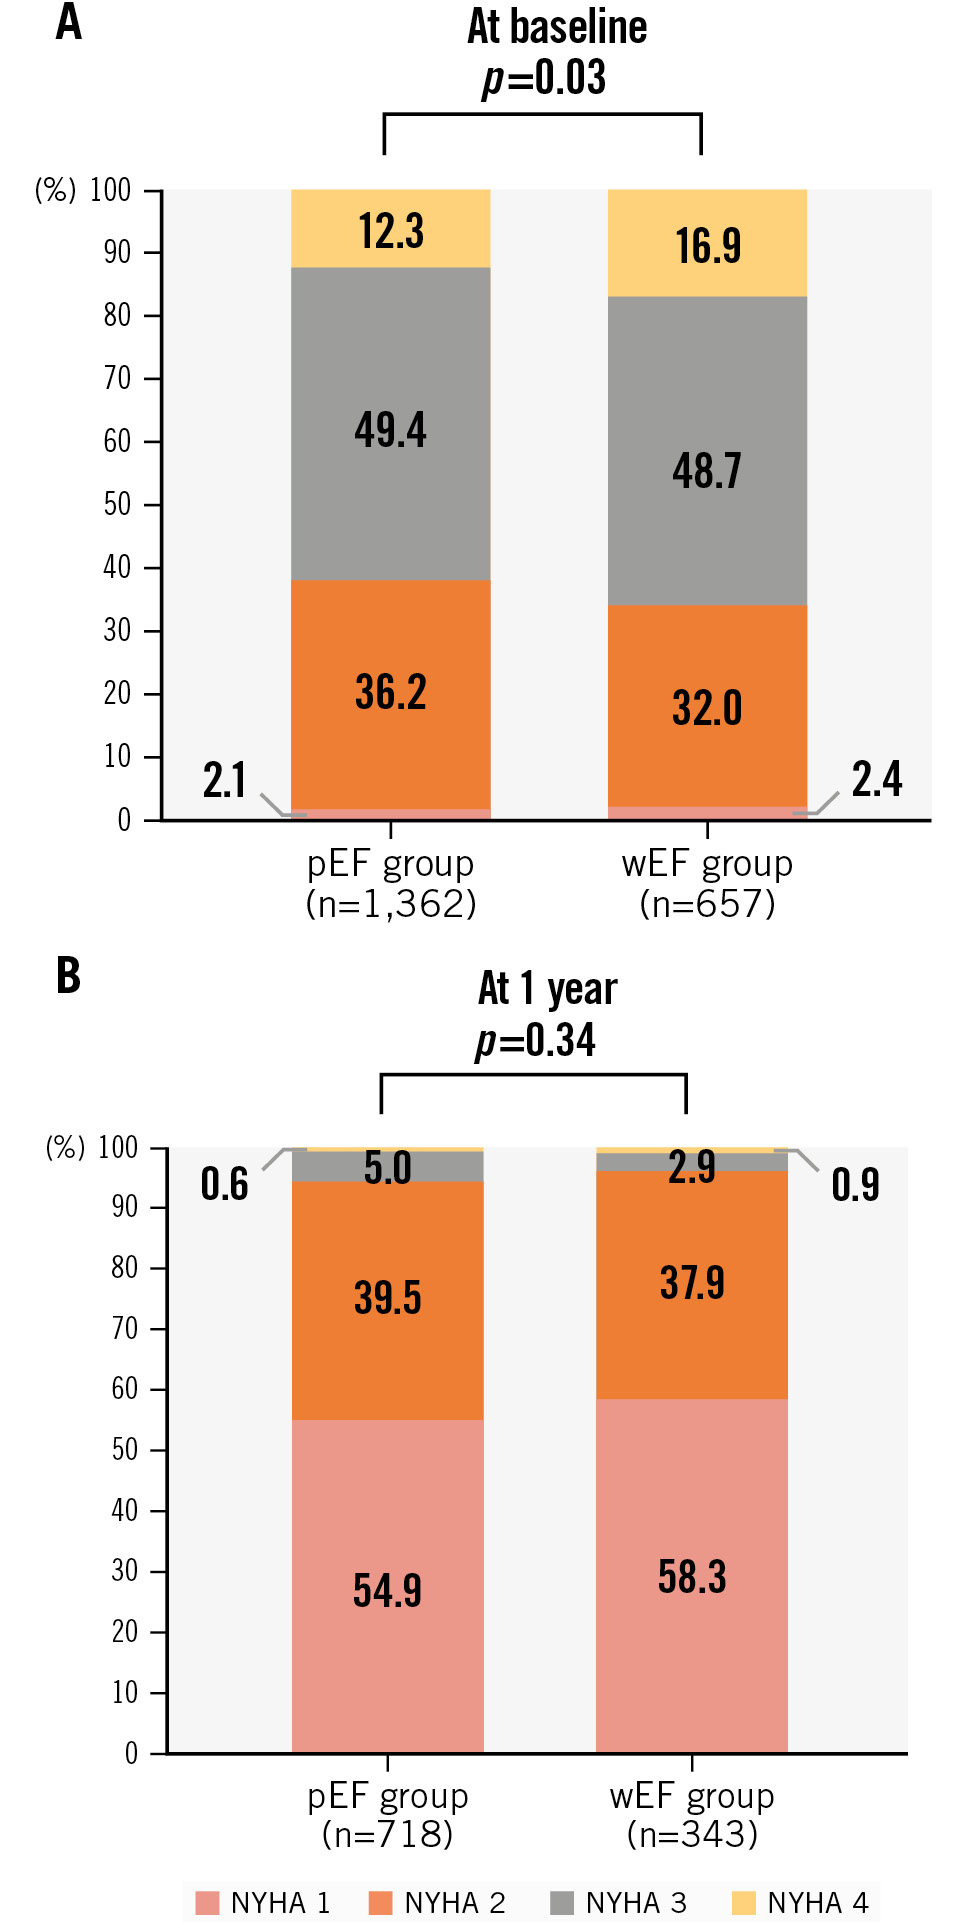
Figure 4. NYHA Functional Class at baseline and 1 year. NYHA Functional Class at baseline (A) and 1 year (B) in the wEF and pEF groups. LVEF: left ventricular ejection fraction; NYHA: New York Heart Association; pEF: patients with preserved LVEF; wEF: patients with worsened LVEF
Discussion
The main study results include (1) worsened LVEF was identified in approximately 30% of patients with MR undergoing TEER, caused by the increased LVESV after TEER; (2) predictors of wEF were LVEDV in both SMR and PMR; LVESV, BNP levels, previous cardiac resynchronisation therapy, and procedural time in SMR; and LVEF, SV, and the degree of MR reduction being ≥3 in PMR; and (3) SV and LVEF improved over time in the wEF group, and wEF after TEER was temporary and unrelated to prognosis.
Previous studies emphasised that the increased afterload due to the MR correction caused a dramatic decrease in LVEF after open-heart surgery315. This phenomenon reflects that mitral valve surgery unmasks the decreased myocardial contractility, and the SV forwardly ejects into the high impedance of the aorta. The acute change in loading conditions without any effects of intraoperative myocardial injury associated with cardiopulmonary bypass or cardiopulmonary arrest caused the decrease in LVEF in patients undergoing TEER. LVESV was used to determine the afterload and cardiac contractility as previously reported16. In this study, whereas the pEF group showed a decrease in both LVEDV and LVESV after TEER, LVESV significantly increased in the wEF group regardless of MR aetiology. This indicates that the worsened LVEF due to afterload changes post-TEER is generated by changes in LVESV in both PMR and SMR.
This study revealed larger LVEDV at baseline as a wEF predictor in both SMR and PMR. Conversely, a higher LVEF at baseline predicted wEF only in PMR. Increased preload and decreased afterload due to MR often keep LVEF within normal limits and sometimes cause hyperkinetic contraction to maintain SV in patients with PMR. Previous studies revealed that preload and afterload normalised and LVEF decreased after mitral valve surgery, revealing myocardial dysfunction17. The degree of systolic contractility can be a risk of worsened LVEF, because the hyperkinetic LV indicates the presence of myocardial disorder in PMR. LV volumes, not LVEF, predicted wEF in SMR. These data indicate that LV volumes were more important factors for worsened LVEF after TEER than baseline LVEF, and concerns about wEF due to TEER may not be a reason to exclude patients with low LVEF as candidates for TEER. In our study, an MR grade reduction ≥3 was an independent predictor of wEF in patients with PMR. A greater MR reduction can cause wEF in patients with PMR, but this had no prognostic impact in our study. Therefore, maximum MR reduction should be achieved in order to allow the reduction in LVEF after the procedure. Higher BNP levels at baseline were identified as a factor of wEF in SMR. High BNP levels are induced by increased preload and afterload. Patients with high BNP levels have a severe haemodynamic status with both increased preload and afterload. Because MR reduction by TEER generally increases afterload further, the effect of TEER on the LV might be greater in patients with high BNP levels. A previous study reported that BNP activation in MR was more prominent in SMR and linked with LV remodelling18. Therefore, high BNP levels in SMR may be associated with increased LVESV and decreased contractility after MR reduction.
Previous studies reported that reduced LVEF after surgery or TEER indicates irreversible LV remodelling and a risk of adverse events41920. The current study revealed that LVEF improved, SV increased, and LV volumes became smaller at 1 year in patients with worsened LVEF compared to those at discharge in both PMR and SMR, indicating LV reverse remodelling for 1 year after discharge. These data indicate that worsened LVEF after MR reduction with TEER is temporary and does not necessarily mean “irreversible myocardial damage”. Additionally, the benefits of increased SV and reverse remodelling after TEER seem to be significant.
Previous studies have shown that wEF after surgery or TEER is associated with worse outcomes421. Additionally, a recent large cohort study demonstrated that wEF (>15% postinterventional LVEF reduction) in PMR was associated with a worse prognosis at 1 year22. However, our study revealed that wEF is not related to long-term prognosis in either SMR or PMR. Also, no apparent linear relationship of greater reduction in LVEF with adverse events was demonstrated. The positive effects of reverse remodelling, increased stroke volume, and improved ejection fraction over time by MR reduction may outweigh the temporary worsening in LVEF after TEER. The benefit of TEER is currently controversial for patients with advanced heart failure and a very low LVEF of <20%2324. However, our data indicate that TEER is safe and effective even when LVEF is worsened after TEER in patients with reduced LVEF.
Limitations
First, this is a retrospective, observational study, and concomitant factors may have affected the results. Second, echocardiographic data were not analysed in an independent core laboratory. To standardise the measurement, we developed a consensus document on the periprocedural echocardiographic assessment before and after TEER based on the guidelines and shared it with the participating institutions before enrolment. Additionally, several echocardiographic examinations for valvular heart disease had already been performed by experienced echocardiographers at the participating institutions when they started their TEER programmes. Third, the exclusion of 26 patients due to inadequate imaging data potentially introduces bias into our results. However, the low proportion of excluded patients means the effect of this bias on results may be limited. Fourth, it was difficult to eliminate the effects of certain variables, such as haemodynamic conditions, volume status, aortic regurgitation, and LV outflow tract obstruction on SV in transthoracic echocardiography (TTE). In addition, heart rate and blood pressure during TTE are not available in this registry. Fifth, detailed information on invasive haemodynamics and medical therapy at follow-up was not available in this study. Therefore, this study did not investigate the effects of periprocedural haemodynamic and postinterventional heart failure drugs. Sixth, wEF was defined based on the median values of the decrease in LVEF, and this value was used in both SMR and PMR. While the relative decrease in LVEF of 12.9% represents a greater absolute decrease in LVEF in patients with PMR, this value represents a smaller absolute decrease in patients with SMR. However, when the clinical effect of an absolute decrease of ≥10% after TEER on the primary endpoint was evaluated in patients with baseline LVEF ≤40%, an absolute decrease of ≥10% was not associated with the incidence of the primary endpoint (58.2% vs 47.2%, HR 0.94, 95% CI: 0.61-1.47; p=0.80). Finally, postinterventional LVEF is measured until discharge, and it does not accurately reflect the immediate postinterventional LVEF.
Conclusions
The OCEAN-Mitral registry observed wEF after TEER in approximately 30% of patients with MR mainly due to their increased LVESV. LVEDV in both SMR and PMR; LVESV, higher BNP levels, longer procedural time, and previous cardiac resynchronisation therapy in SMR; and LVEF, an MR reduction ≥3 grades, and SV in PMR were wEF predictors. LVEF in patients with wEF tended to improve after 1 year with reverse remodelling, and wEF after TEER was not associated with long-term outcomes regardless of MR aetiology.
Impact on daily practice
The OCEAN-Mitral registry observed worsened left ventricular ejection fraction (LVEF) after transcatheter edge-to-edge repair (TEER) in approximately 30% of patients with mitral regurgitation (MR) mainly because of the increased left ventricular (LV) end-systolic volume. Worsened LVEF was predicted by baseline LV volume and patient-specific factors, and was not associated with long-term clinical outcomes regardless of MR aetiology. Worsened LVEF after TEER was temporary and did not affect the outcomes, and thus, TEER can be safely and effectively performed even when LVEF is reduced after TEER.
Acknowledgements
The authors thank all investigators participating in this registry.
Funding
The OCEAN-Mitral registry, which is part of the OCEAN-SHD registry, is supported by Edwards Lifesciences, Medtronic Japan, Boston Scientific, Abbott Medical Japan, and Daiichi Sankyo.
Conflict of interest statement
S. Kubo, M. Saji, M. Izumo, Y. Watanabe, M. Amaki, Y. Nakajima, Y. Enta, S. Shirai, S. Mizuno, H. Bota, and M. Yamamoto are clinical proctors of transcatheter edge-to-edge repair for Abbott; and have received speaker fees from Abbott. M. Asami and K. Kodama have received speaker fees from Abbott. J. Yamaguchi is a clinical proctor of transcatheter edge-to-edge repair for Abbott; and has received a lecture fee and a scholarship donation from Abbott. Y. Ohno has received consultant, advisor, and speaker fees from Abbott. The other authors have no conflicts of interest relevant to the content of this article to declare.
Supplementary data
To read the full content of this article, please download the PDF.