Abstract
Background: Recent studies report a discordance between invasive and echocardiography-derived gradients after transcatheter aortic valve implantation (TAVI) with balloon-expandable (BEV) and self-expanding valves (SEV). There are limited data on the determinants and clinical implications of this discordance.
Aims: We aimed to examine the prognostic value of invasive and echocardiography-derived gradients after implantation of SEV and BEV and to compare gradients for SEV versus BEV.
Methods: We performed a retrospective, propensity score-matched study. Invasive measurements were obtained before and immediately after TAVI. Echocardiography was performed before and within 24 hours after TAVI, and at 1 year. Clinical outcomes were assessed at 30 days, 1 year, and 2 years.
Results: The 1:1 propensity score matching resulted in 436 matched pairs (436 SAPIEN 3 and 436 Evolut). Invasive gradients post-TAVI independently predicted higher risk for all-cause mortality at 30 days, 1 year and 2 years as a continuous variable (hazard ratio [HR] 1.07, 95% confidence interval [CI]: 1.00-1.14; p=0.038; HR 1.06, 95% CI: 1.01-1.11; p=0.007; HR 1.05, 95% CI: 1.01-1.09; p=0.011, respectively) and by using >10 mmHg as a cutoff (HR 1.95, 95% CI: 1.13-4.78; p=0.028; HR 1.91, 95% CI: 1.11-3.65; p=0.030; HR 1.61, 95% CI: 1.03-2.96; p=0.021, respectively), but echocardiography-derived gradients did not (HR 1.13, 95% CI: 0.87-1.75; p=0.247; HR 1.02, 95% CI: 0.95-1.10; p=0.639; HR 0.99, 95% CI: 0.94-1.07; p=0.979, respectively). Mean gradients before and after TAVI were higher by echocardiography than by invasive measurements. The difference was more pronounced after implantation with BEV than SEV (7.0 [25th-75th percentile: 4.0-11.0] mmHg vs 5.0 [2.0-7.0] mmHg; p<0.001). Smaller valve size, higher ejection fraction and higher stroke volume amplified the discordance. Invasive mean gradients were similar after SEV and BEV (3.0 [0.0-6.0] mmHg vs 3.0 [0.0-6.0] mmHg; p=0.166), but echo-derived mean gradients were lower after SEV versus BEV (8.0 [6.0-11.0] mmHg vs 11.0 [8.0-14.0] mmHg; p<0.001).
Conclusions: Only invasively measured but not echocardiography-derived transvalvular mean gradients correlate with 30-day, 1-year and 2-year mortality. Aortic gradient measurements are higher by echocardiography than by invasive assessment and more so for BEV than SEV. Smaller valve size, higher ejection fraction and higher stroke volume increase this discordance between echocardiography and invasive assessment.
Transcatheter aortic valve implantation (TAVI) is a guideline-recommended treatment for selected patients with symptomatic severe aortic stenosis12. Randomised controlled trials have demonstrated equal haemodynamic valve performance for surgical and balloon-expandable valves (BEV) and consistently superior performance with self-expanding valves (SEV) characterised by larger valve areas and lower residual transvalvular pressure gradients up to 5 years345.
There is increased interest in the evaluation of haemodynamic valve performance post-TAVI with different modalities. Recent studies reported equal transvalvular gradients measured invasively immediately after implantation with BEV and SEV but consistently higher gradients by predischarge echocardiography, and more so for BEV than SEV678910111213141516. The scientific underpinning of this observation is limited and involves intrinsic limitations of echocardiography-derived measurements. There are limited data on the determinants for discordance between invasive and echocardiographic measurements.
It is also unclear whether these different gradient acquisitions may correlate differently with clinical outcome. Previous studies found weak correlations between invasive or echocardiographic mean gradients after TAVI and mortality, or they showed opposite results for echocardiographic and invasive measurements681718.
Objectives of the study
We aimed to examine the predictive value of invasive and echocardiography-derived transvalvular mean gradients post-TAVI for mortality and for the occurrence of bioprosthetic valve failure. Furthermore, we compared the difference between invasive and echocardiography-derived gradients for BEV versus SEV. The impact of different valve size, ejection fraction, indexed stroke volume and degree of aortic valve calcification on this discordance were also assessed.
Methods
We retrospectively included all consecutive patients who had undergone TAVI with a contemporary SAPIEN 3 (Edwards Lifesciences) or Evolut (Medtronic) valve for severe native aortic stenosis in our centre from January 2014 to March 2023. Exclusion criteria were TAVI in a failed surgical or transcatheter bioprosthesis and the need for more than one transcatheter heart valve (THV) due to initial malpositioning. Bicuspid valve patients were included in the analysis.
Echocardiography was performed before and within 24 hours after TAVI and at the 1-year follow-up visit. All echocardiography exams were performed according to the 2011 guidelines by the European and American Association of Echocardiography19.
Invasive measurements were obtained minutes before and minutes after valve deployment. Invasive gradients were calculated as the difference between simultaneously measured pressures in the left ventricular outflow tract (LVOT) and the ascending aorta with 2 fluid-filled catheters (IMPULSE [Boston Scientific]) for simultaneous left ventricular (LV) and aortic pressure measurements. The LV catheter was positioned in the mid-ventricle at the level of the papillary muscles. The aortic catheter was positioned 2 cm above the stent frame for BEV and within the upper quadrant of the stent frame for SEV.
The Sensis Vibe haemodynamic system software program (Siemens Healthineers) was used for recording haemodynamic measurements. Measurements were first standardised with stable heartbeats, after which an average of 3 heartbeats in regular sinus or paced rhythm and 5 heartbeats in atrial fibrillation was used for the calculation of haemodynamic parameters. TAVI was performed under local anaesthesia with personalised close monitoring by trained nursing staff and without systematic intravenous administration of fluids, sedatives or anaesthetics. Patients remained wide awake, cooperative and communicative throughout the procedure.
The decision to predilate was per the operator’s discretion and based on aortic root calcium content as determined by multislice computed tomography (MSCT). The trigger to predilate was typically lower for SEV than BEV. Non-circular frame expansion, more than mild paravalvular leakage or an invasive mean gradient >15 mmHg across the transcatheter valve were triggers for balloon post-dilatation.
Baseline demographics and clinical datapoints were captured in a dedicated electronic database. Clinical outcome was assessed at 30-day, 1-year, and 2-year follow-up visits. Clinical events, including the prevalence of bioprosthetic valve dysfunction, were defined according to Valve Academic Research Consortium (VARC)-3 criteria. The study was approved by the Medical Ethics Committee of the Erasmus University Medical Center (IRB: MEC-2023-0419), and the need for individual informed consent was waived because of the retrospective nature of the study.
To evaluate the impact of THV size on postprocedural gradients, THV size was classified into 4 categories: very small (SAPIEN 3 20 mm/Evolut 23 mm), small (SAPIEN 3 23 mm/Evolut 26 mm), medium (SAPIEN 3 26 mm/Evolut 29 mm) and large (SAPIEN 3 29 mm/Evolut 31/34 mm).
To evaluate the impact of LV ejection fraction (LVEF) and stroke volume index (SVI) on postprocedural gradients, the most recent baseline echocardiogram prior to the TAVI procedure was used. To evaluate the impact of the aortic valve calcification degree, the computed tomography (CT) scan previously performed for TAVI planning was used.
A subanalysis of invasive and echocardiographic gradients and comparison of clinical outcomes was performed on patients with a small aortic annulus (<430 mm2).
Statistical analysis
Distributions of continuous variables were tested for normality using the Kolmogorov-Smirnov test. Continuous variables are expressed as median (25th-75th percentile); categorical variables are expressed as numbers and percentages. Comparison of continuous variables between (sub)groups was performed using the Mann-Whitney U and Kruskal-Wallis tests. Comparison of categorical variables between groups was performed with the chi-square test. Comparison of paired observations was performed with the Wilcoxon signed-rank test. Propensity scores were constructed using logistic regression. The THV platform (SEV or BEV) was used as the dependent variable, while baseline characteristics demonstrating significant differences between groups were the independent variables, along with other variables considered to be clinically relevant. We included the following variables into the propensity matching: age, sex, body mass index (BMI), body surface area (BSA), Society of Thoracic Surgeons (STS) score, hypertension, hypercholesterolaemia, atrial fibrillation, diabetes, estimated glomerular filtration rate (eGFR), LVEF, mean aortic valve gradient, peak aortic valve gradient, aortic valve area, valve size group, and aortic calcification degree. Using a 0.1 calliper setting and “nearest neighbour” matching without replacement, a propensity score-matched cohort with a 1:1 SEV versus BEV ratio was obtained. Standardised mean differences (SMD) were calculated for all variables to assess bias reduction. An SMD <0.2 was considered an indicator of adequate bias reduction. Comparison of continuous and categorical variables between matched groups were performed using the Wilcoxon signed-rank and McNemar tests. To test for the association between continuous variables and all-cause mortality, baseline variables of presumed prognostic importance and post-TAVI invasive and echocardiography-derived mean gradients (both continuous and dichotomised) were first analysed by univariable Cox proportional hazards regression. Afterwards, parameters with p-values of <0.10 were integrated into a multivariable Cox proportional hazards regression model. A separate Cox proportional hazards regression was performed to examine the association between continuous variables (including the gradients and variables of presumed prognostic importance) and the occurrence of bioprosthetic valve dysfunction at 1 year. Kaplan-Meier analysis was performed to compare clinical outcome between groups. P-values<0.05 were considered significant. Analyses were performed using SPSS, version 25.0 (IBM) and Rstudio version 4.3 (Posit Software, PBC).
Results
The flowchart of the study population is shown in Supplementary Figure 1. Overall, 1,227 patients underwent TAVI from January 2014 to March 2023 (Evolut: n=573; SAPIEN 3: n=654). Baseline characteristics are shown in Table 1. Propensity score matching resulted in 436 matched pairs. The median age was 80 (74-84) years for both groups, and the median STS score was 3.41 (2.40-5.02) for SEV versus 3.10 (2.01-4.99) for BEV; p=0.082. Baseline echocardiography displayed no differences between groups regarding LVEF (SEV: 57 [51-59]% vs BEV: 56 [48-59]%; p=0.108), moderate/severe mitral regurgitation (SEV: 13.5% vs BEV: 11.0%; p=0.216) or pulmonary hypertension (SEV: 9.6% vs BEV 10.8%; p=0.640). Seven patients were lost to follow-up at 30 days, 14 were lost to follow-up at 1 year, and 30 at 2 years.
Echocardiographic and invasive transvalvular gradient measurements before and after TAVI are shown in Table 2, Figure 1A, and Figure 1B. Baseline mean gradients were higher by echocardiography than by invasive measurements for both patients planned for SEV (39.0 [30.0-48.0] mmHg vs 36.0 [26.0-46.0] mmHg; p<0.001) and BEV (38.0 [30.0-48.0] mmHg vs 34.0 [27.0-42.0] mmHg; p<0.001). There were no differences between SEV and BEV for the baseline echocardiographic (39.0 [30.0-48.0] mmHg vs 38.0 [30.0-48.0] mmHg; p=0.379) or invasive measurements (36.0 [26.0-46.0] mmHg vs 34.0 [27.0-42.0] mmHg; p=0.311).
Invasive mean gradients post-TAVI were equal for BEV and SEV (3.0 [0.0-6.0] mmHg vs 3.0 [0.0-6.0] mmHg; p=0.166) (Central illustration); however, the mean and maximum gradients by transthoracic echocardiography within 24 hours after TAVI were significantly lower in SEV as compared to BEV patients (8.0 [6.0-11.0] mmHg vs 11.0 [8.0-14.0] mmHg; p<0.001 and 14.0 [12.0-19.0] mmHg vs 19.0 [15.0-27.0] mmHg; p<0.001, respectively).
The mean gradients by echocardiography post-TAVI displayed higher values than invasive measurements, and the difference was more pronounced with BEV than SEV (7.0 [4.0-11.0] mmHg for BEV and 5.0 [2.0-7.0] mmHg for SEV patients; p<0.001) (Figure 1C). A clinical example of this discordance between invasive and echocardiographic measurements is illustrated in Supplementary Figure 2. Of the 19 patients with a mean gradient of 20 mmHg or higher on post-TAVI echocardiography, only 5 had an invasive gradient of >20 mmHg.
Patients with a smaller THV exhibited a higher level of discordance between echocardiographic and invasive measurements, and this difference was more pronounced for BEV in each THV size category. With SEV, the difference between the invasive and echocardiographic mean gradient was 7.0 (2.0-10.0) mmHg for Evolut 23 mm versus 4.5 (2.0-6.5) mmHg for Evolut 31/34 mm; p=0.011. With BEV, the difference between invasive and echocardiographic mean gradients was 11.0 (5.5-17.0) mmHg for the SAPIEN 3 20 mm versus 7.0 (3.0-9.0) mmHg for the SAPIEN 3 29 mm; p=0.001 (Table 3).
Patients with a higher LVEF exhibited a higher rate of discordance for the total group (7.0 [3.0-10.0] mmHg for LVEF >50% vs 5.0 [2.0-8.0] mmHg for LVEF <40%; p=0.041), and for BEV (8.0 [5.0-11.0] mmHg for LVEF >50% vs 6.0 [3.0-9.0] mmHg for LVEF <40%; p=0.021) (Table 3). For each LVEF category (<40%, 40-50%, >50%), BEV exhibited a higher rate of discordance compared to SEV (8.0 [5.0-11.0] mmHg vs 5.0 [2.0-7.0] mmHg; p<0.001; 7.0 [5.0-10.0] mmHg vs 5.0 [1.0-7.0] mmHg; p<0.001; 6.0 [3.0-9.0] mmHg vs 5.0 [1.0-8.0] mmHg; p=0.227, respectively).
A high SVI increased the discordance for the total group (7.0 [3.0-9.0] mmHg for SVI >35 ml/m2 vs 5.0 [3.0-8.0] mmHg for SVI <35 ml/m2; p=0.048). This difference was statistically significant for BEV (9.0 [5.0-12.0] mmHg for SVI >35 ml/m2 vs 6.0 [4.0-10.0] mmHg for SVI <35 ml/m2; p=0.002) but not for SEV (5.0 [2.0-7.0] mmHg vs 5.0 [2.0-8.0]; p=0.730).
The degree of aortic valve calcification did not significantly affect the discordance between echo-derived and invasive measurements (7.0 [3.0-10.0] mmHg for severe calcification vs 7.0 [3.0-9.0] mmHg for mild calcification; p=0.638).
Clinical outcomes at 30 days, 1 year and 2 years are depicted in Table 4. Outcomes were similar after TAVI with SEV and BEV.
In small annulus patients (annulus area <430 mm2), the mean gradients were lower for SEV than BEV by echocardiography (8.0 [6.0-11.0] mmHg vs 12.0 [9.0-16.0] mmHg; p<0.001) but not by invasive measurements (3.0 [0.0-5.0] mmHg vs 3.0 [0.0-6.0] mmHg; p=0.740) (Supplementary Table 1). The median discordance between echo-derived and invasive mean gradients was larger for BEV than SEV (8.0 [5.0-12.0] mmHg vs 5.0 [2.0-8.0] mmHg; p<0.001). Clinical outcomes were similar for SEV and BEV except for a higher rate of bioprosthetic valve failure in BEV at 2 years (4.9% vs 11.1%; p=0.042). The clinical outcomes of small aortic annulus patients are displayed in Supplementary Table 2.
Invasive transvalvular mean gradients post-TAVI independently predicted a higher risk for all-cause mortality at 30 days, 1 year and 2 years (hazard ratio [HR] 1.07, 95% confidence interval [CI]: 1.00-1.14; p=0.038; HR 1.06, 95% CI: 1.01-1.11; p=0.007; and HR 1.05, 95% CI: 1.05-1.09; p=0.011, respectively). Echocardiography-derived gradients did not show a significant association (HR 1.13, 95% CI: 0.87-1.75; p=0.248; HR 1.02, 95% CI: 0.95-1.10; p=0.639; and HR 0.99, 95% CI: 0.94-1.07; p=0.979, respectively) (Table 5).
From a spline curve displaying post-TAVI invasive gradient and HR for all-cause mortality, the cutoff value for the invasive gradient to predict a clinically relevant outcome was identified as >10 mmHg (Supplementary Figure 3). Additional Kaplan-Meier analysis by an invasive gradient <10 mmHg versus >10 mmHg demonstrated a significant difference in all-cause mortality at 1 year between the two groups (HR 1.83, 95% CI: 1.07-3.31; p=0.04) (Supplementary Figure 4). In the multivariable regression, an invasive gradient >10 mmHg was an independent predictor at 30 days, 1 year and 2 years (HR 1.95, 95% CI: 1.13-4.78; p=0.028; HR 1.91, 95% CI: 1.11-3.65; p=0.030; and HR 1.61, 95% CI: 1.03-2.96; p=0.021, respectively) (Table 5).
An invasive gradient >20 mmHg did not show a significant association with all-cause mortality at 30 days, 1 year or 2 years (HR 2.77, 95% CI: 0.37-20.69; p=0.320; HR 2.15, 95% CI: 0.53-8.77; p=0.287; and HR 1.48, 95% CI: 0.37-6.02; p=0.581, respectively). Conversely, a left ventricular ejection fraction below 30% was an independent predictor for all-cause mortality at 30 days, 1 year and 2 years (HR 3.69, 95% CI: 1.14-9.92; p=0.010; HR 3.02, 95% CI: 1.70-5.72; p<0.001; and HR 3.38, 95% CI: 1.73-5.85; p<0.001, respectively).
A subanalysis on the association between transvalvular mean gradients and mortality for SEV and BEV cohorts is displayed in Supplementary Table 3. Invasive gradients independently predicted a higher risk for all-cause mortality at 30 days, 1 year and 2 years for both SEV (HR 1.05, 95% CI: 1.00-1.17; p=0.010; HR 1.04, 95% CI: 1.01-1.17; p=0.029; and HR 1.01, 95% CI: 1.00-1.10; p=0.041, respectively) and BEV (HR 1.07, 95% CI: 1.00-1.13; p=0.020; HR 1.16, 95% CI: 1.01-1.20; p=0.005; and HR 1.13, 95% CI: 1.01-1.18; p=0.029, respectively). Echocardiography-derived gradients did not show a significant association for SEV (HR 1.23, 95% CI: 0.91-1.66; p=0.175; HR 1.08, 95% CI: 0.91-1.11; p=0.946; and HR 0.97, 95% CI: 0.88-1.06; p=0.487, respectively) or BEV (HR 1.05, 95% CI: 0.93-1.19; p=0.436; HR 0.99, 95% CI: 0.89-1.09; p=0.822; and HR 0.96, 95% CI: 0.89-1.04; p=0.301, respectively).
Echocardiography-derived gradients showed no significant association with VARC-3 defined bioprosthetic valve failure at 1 year (HR 1.07, 95% CI: 0.98-1.17; p=0.136 [continuous], HR 1.11, 95% CI: 0.30-7.89; p=0.501 [>10 mmHg], and HR 1.29, 95% CI: 0.16-10.41; p=0.810 [>20 mmHg]). Invasive gradients also did not correlate with bioprosthetic valve failure at 1 year (HR 1.04, 95% CI: 0.98-1.10; p=0.127 [continuous], HR 1.99, 95% CI: 0.45-12.07; p=0.378 [>10 mmHg], and HR 2.17, 95% CI: 0.27-17.19; p=0.463 [>20 mmHg]) (Supplementary Table 4).
Table 1. Baseline characteristics.
| Unmatched (n=1,227) | Matched (n=872) | |||||||
|---|---|---|---|---|---|---|---|---|
| SEV (n=573) | BEV (n=654) | p-value | SMD | SEV (n=436) | BEV (n=436) | p-value | SMD | |
| Age, years | 80 (74-84) | 80 (74-84) | 0.931 | 0.030 | 80 (74-84) | 80 (74-84) | 0.542 | 0.018 |
| Male | 248 (43.2) | 428 (65.4) | <0.001 | 0.462 | 185 (42.4) | 263 (60.0) | <0.001 | 0.370 |
| BMI, kg/m2 | 26.2 (23.1-30.1) | 26.8 (24.1-30.5) | 0.017 | 0.320 | 26.2(23.1-30.1) | 26.4(23.9-30.1) | 0.737 | 0.034 |
| BSA, m2 | 1.8(1.7-2.0) | 1.9(1.8-2.0) | <0.001 | 0.320 | 1.68(1.55-1.83) | 1.76(1.61-1.89) | 0.070 | 0.251 |
| STS score | 3.25(2.28-4.81) | 2.94(1.90-4.70) | 0.007 | 0.160 | 3.41(2.40-5.02) | 3.10(2.01-4.99) | 0.082 | 0.013 |
| Hypertension | 436 (76.1) | 487 (74.4) | 0.454 | 0.036 | 337 (77.3) | 321 (73.6) | 0.216 | 0.085 |
| Hypercholesterolaemia | 349 (60.1) | 384 (58.7) | 0.602 | 0.015 | 271 (62.1) | 259 (59.4) | 0.690 | 0.004 |
| Atrial fibrillation | 190 (33.1) | 210 (32.1) | 0.270 | 0.107 | 147 (33.7) | 141 (32.3) | 0.767 | 0.004 |
| Diabetes | 182 (31.7) | 204 (31.1) | 0.721 | 0.011 | 136 (31.2) | 143 (32.8) | 0.611 | 0.004 |
| Renal failure | 187 (32.6) | 227 (34.7) | 0.338 | 0.043 | 134 (30.7) | 156 (35.8) | 0.293 | 0.018 |
| Antiplatelet therapy | 0.284 | 0.064 | 0.789 | 0.097 | ||||
| Aspirin | 195 (34.0) | 244 (37.3) | 155 (35.5) | 170 (39.0) | ||||
| Clopidogrel | 116 (20.2) | 134 (20.4) | 85 (19.5) | 97 (22.3) | ||||
| Dual therapy | 48 (8.3) | 52 (7.9) | 37 (8.5) | 42 (9.6) | ||||
| Anticoagulation | 0.093 | 0.152 | 0.722 | 0.026 | ||||
| VKA | 114 (19.9) | 151 (23.1) | 95 (21.7) | 102 (23.4) | ||||
| NOAC | 97 (16.9) | 94 (14.4) | 70 (16.1) | 63 (14.5) | ||||
| NYHA Class | 0.611 | 0.044 | 0.473 | 0.121 | ||||
| I | 38/527(7.2) | 46/603(7.6) | 28/422(6.6) | 26/413(6.3) | ||||
| II | 186/527(35.3) | 212/603(35.1) | 149/422(35.4) | 151/413(36.5) | ||||
| III | 258/527(48.9) | 281/603(46.6) | 209/422(49.5) | 193/413(46.7) | ||||
| IV | 45/527(8.5) | 64/603(10.6) | 36/422(8.5) | 43/413(10.4) | ||||
| Echo characteristics | ||||||||
| LVEF, % | 58 (50-60) | 55 (45-60) | <0.001 | 0.204 | 57 (51-59) | 56 (48-59) | 0.108 | 0.140 |
| >50% | 393 (68.6) | 378 (57.8) | <0.001 | 0.228 | 311 (71.3) | 290 (66.5) | 0.093 | 0.154 |
| 40-50% | 115 (20.0) | 174 (26.6) | 0.014 | 0.147 | 78 (17.9) | 101 (23.2) | 0.065 | 0.132 |
| <40% | 65 (11.4) | 102 (15.6) | 0.033 | 0.138 | 47 (10.8) | 55 (12.6) | 0.390 | 0.057 |
| Preprocedural mean aortic gradient, mmHg | 40.0(31.0-50.0) | 38.0(30.0-48.0) | 0.106 | 0.091 | 39.0(30.0-48.0) | 38.0(30.0-48.0) | 0.381 | 0.028 |
| Preprocedural peak aortic gradient, mmHg | 67.0(55.0-81.0) | 64.0(49.0-81.0) | 0.063 | 0.118 | 67.0(52.0-81.0) | 64.0(52.0-81.0 | 0.374 | 0.037 |
| AVA, cm2 | 0.70(0.60-0.90) | 0.80(0.62-0.90) | 0.002 | 0.082 | 0.70(0.6-0.8) | 0.75(0.6-0.80) | 0.062 | 0.07 |
| Moderate/severe mitral regurgitation | 70 (12.2) | 66 (10.1) | 0.237 | 0.052 | 59 (13.5) | 48 (11.0) | 0.216 | 0.096 |
| RVSP >40 mmHg | 71 (12.4) | 78 (11.9) | 0.804 | 0.002 | 42 (9.6) | 47 (10.8) | 0.640 | 0.024 |
| Valve types | ||||||||
| Evolut Ra | 309 (53.9) | 228 (52.3) | ||||||
| Evolut PRO(+)a | 264 (46.1) | 208 (47.7) | ||||||
| SAPIEN 3b | 378 (57.8) | 248 (56.9) | ||||||
| SAPIEN 3 Ultrab | 276 (42.2) | 188 (43.1) | ||||||
| Valve size group | <0.001 | 0.593 | 0.106 | 0.129 | ||||
| Very small | 33 (5.8) | 13 (2.0) | <0.001 | 0.212 | 14 (3.2) | 12 (2.8) | 0.690 | 0.027 |
| Small | 207 (36.1) | 142 (21.7) | <0.001 | 0.321 | 149 (34.2) | 140 (32.1) | 0.517 | 0.044 |
| Medium | 286 (49.9) | 294 (44.9) | 0.068 | 0.101 | 226 (51.8) | 218 (50.0) | 0.588 | 0.037 |
| Large | 47 (8.2) | 205 (31.3) | <0.001 | 0.601 | 47 (10.8) | 66 (15.1) | 0.070 | 0.130 |
| Procedural characteristics | ||||||||
| Predilatation | 292 (44.6) | 132 (23.0) | <0.001 | 0.224 | 192 (44.0) | 113 (25.9) | <0.001 | 0.398 |
| Post-dilatation | 164 (28.6) | 158 (23.5) | 0.074 | 0.106 | 136 (31.2) | 116 (26.6) | 0.096 | 0.102 |
| Computed tomography measurements | ||||||||
| Annulus area, mm2 | 462(415-480) | 495(441-512) | <0.001 | 0.153 | 469(421-472) | 483(440-497) | 0.105 | 0.062 |
| Valve morphology | 0.282 | 0.081 | 0.271 | 0.070 | ||||
| Bicuspid | 41 (7.0) | 59 (9.0) | 0.282 | 0.081 | 34 (7.7) | 44 (10.1) | 0.271 | 0.070 |
| Tricuspid | 532 (93.0) | 595 (91.0) | 0.282 | 0.081 | 402 (92.2) | 392 (89.9) | 0.271 | 0.070 |
| Degree of calcification | 0.042 | 0.141 | 0.542 | 0.064 | ||||
| Severe | 488 (85.1) | 586 (89.6) | 0.019 | 0.139 | 360 (82.6) | 377 (86.4) | 0.338 | 0.074 |
| Moderate | 72 (12.6) | 61 (9.3) | 0.069 | 0.118 | 68 (15.6) | 58 (13.3) | 0.283 | 0.080 |
| Mild | 13 (2.3) | 7 (1.1) | 0.010 | 0.217 | 4 (0.9) | 5 (1.1) | 0.759 | 0.013 |
| None | 0 (0) | 0 (0) | 1.000 | 0.000 | 0 (0) | 0 (0) | 1.000 | 0.000 |
| Values are median (25th-75th percentile), n (%) or n/N (%). aBy Medtronic; bby Edwards Lifesciences. AVA: aortic valve area; BEV: balloon-expandable valve; BMI: body mass index; BSA: body surface area; LVEF: left ventricular ejection fraction; NOAC: non-vitamin K oral anticoagulants; NYHA: New York Heart Association; RVSP: right ventricular systolic pressure; SEV: self-expanding valve; SMD: standardised mean difference; STS: Society of Thoracic Surgeons; VKA: vitamin K antagonist | ||||||||
Table 2. Pre- and postprocedural invasive and echocardiographic gradient measurements.
| Unmatched (n=1,211) | Matched (n=861) | |||||
|---|---|---|---|---|---|---|
| SEV | BEV | p-value | SEV | BEV | p-value | |
| Echocardiography | ||||||
| Pre-TAVI | (n=573) | (n=654) | (n=436) | (n=436) | ||
| Mean PG, mmHg | 40.0 (32.0-50.0) | 38.0 (30.0-48.0) | 0.106 | 39.0 (30.0-48.0) | 38.0 (30.0-48.0) | 0.379 |
| Peak PG, mmHg | 67.0 (55.0-81.0) | 64.0 (49.0-81.0) | 0.063 | 67.0 (52.0-81.0) | 64.0 (52.0-81.0) | 0.343 |
| Predischarge | (n=567) | (n=644) | (n=436) | (n=431) | ||
| Mean PG, mmHg | 8.0 (6.0-11.0) | 11.0 (8.0-14.0) | <0.001& | 8.0 (6.0-11.0) | 11.0 (8.0-14.0) | <0.001& |
| Peak PG, mmHg | 14.0 (9.5-18.5) | 19.0 (16.0-25.0) | <0.001& | 14.0 (12.0-19.0) | 19.0 (15.0-27.0) | <0.001& |
| 1-year follow-up | (n=503) | (n=579) | (n=384) | (n=391) | ||
| Mean PG, mmHg | 8.0 (6.0-10.0) | 10.0 (8.0-12.0) | <0.001& | 8.0 (6.0-10.0) | 9.0 (8.0-12.0) | <0.001& |
| Peak PG, mmHg | 16.0 (12.0-19.0) | 18.0 (14.0-23.0) | <0.001& | 16.0 (12.0-19.0) | 18.0 (14.0-23.0) | <0.001& |
| Invasive | ||||||
| Pre-TAVI | (n=573) | (n=654) | (n=436) | (n=436) | ||
| Mean PG, mmHg | 36.5 (26.0-47.0) | 34.0 (26.0-45.0) | 0.240 | 36.0 (26.0-46.0) | 34.0 (27.0-42.0) | 0.311 |
| Peak PG, mmHg | 50.0 (33.0-66.0) | 44.0 (31.0-63.0) | 0.012& | 49.0 (31.0-63.0) | 44.0 (31.0-60.0) | 0.023& |
| Post-TAVI | (n=573) | (n=654) | (n=436) | (n=436) | ||
| Mean PG, mmHg | 3.0 (0.0-6.0) | 3.0 (0.0-6.0) | 0.834 | 3.0 (0.0-6.0) | 3.0 (0.0-6.0) | 0.166 |
| Peak PG, mmHg | 2.0 (0.0-7.0) | 2.0 (0.0-6.0) | 0.212 | 2.0 (0.0-6.0) | 2.0 (0.0-6.0) | 0.570 |
| Difference between gradients | ||||||
| Pre-TAVI echo mean PG –pre-TAVI invasive mean PG, mmHg | 3.5 (1.0-5.5) (p<0.001)*& | 3.5 (1.5-5.0) (p<0.001)*& | 0.664 | 3.5 (1.0-5.0) (p<0.001)*& | 3.5 (1.5-5.0) (p<0.001)*& | 0.302 |
| Post-TAVI echo mean PG –post-TAVI invasive mean PG, mmHg | 5.0 (2.0-7.0) (p<0.001)*& | 7.0 (4.0-10.5)(p<0.001)*& | <0.001& | 5.0 (2.0-7.0) (p<0.001)*& | 7.0 (4.0-11.0)(p<0.001)*& | <0.001& |
| Pre-TAVI echo peak PG –pre-TAVI invasive peak PG, mmHg | 17.0 (8.0-28.0)(p<0.001)*& | 19.0 (8.0-32.0)(p<0.001)*& | 0.296 | 17.0 (7.0-28.0)(p<0.001)*& | 19.0 (8.0-32.0)(p<0.001)*& | 0.281 |
| Post-TAVI echo peak PG –post-TAVI invasive peak PG, mmHg | 12.0 (8.0-17.0)(p<0.001)*& | 18.0 (13.0-23.0)(p<0.001)*& | <0.001& | 12.0 (8.0-16.0)(p<0.001)*& | 17.0 (12.0-23.0)(p<0.001)*& | <0.001& |
| Number of patients displaying a mean PG >20 mmHg post-TAVI | ||||||
| Echocardiography | 9 (1.6) | 20 (3.1) | 0.085 | 6 (1.4) | 13 (3.0) | 0.099 |
| Echocardiography + confirmed by invasive measurement >20 mmHg | 0 (0) | 5 (0.8) | 0.022& | 0 (0) | 5 (1.1) | 0.025& |
| Invasive | 0 (0) | 5 (0.8) | 0.022& | 0 (0) | 5 (1.1) | 0.02& |
| Values are median (25th-75th percentile) or n (%). *P-value applies to the difference between the echo-derived mean gradient and the invasive mean gradient within groups. &Indicates statistical significance. BEV: balloon-expandable valve; PG: pressure gradient; SEV: self-expanding valve; TAVI: transcatheter aortic valve implantation | ||||||
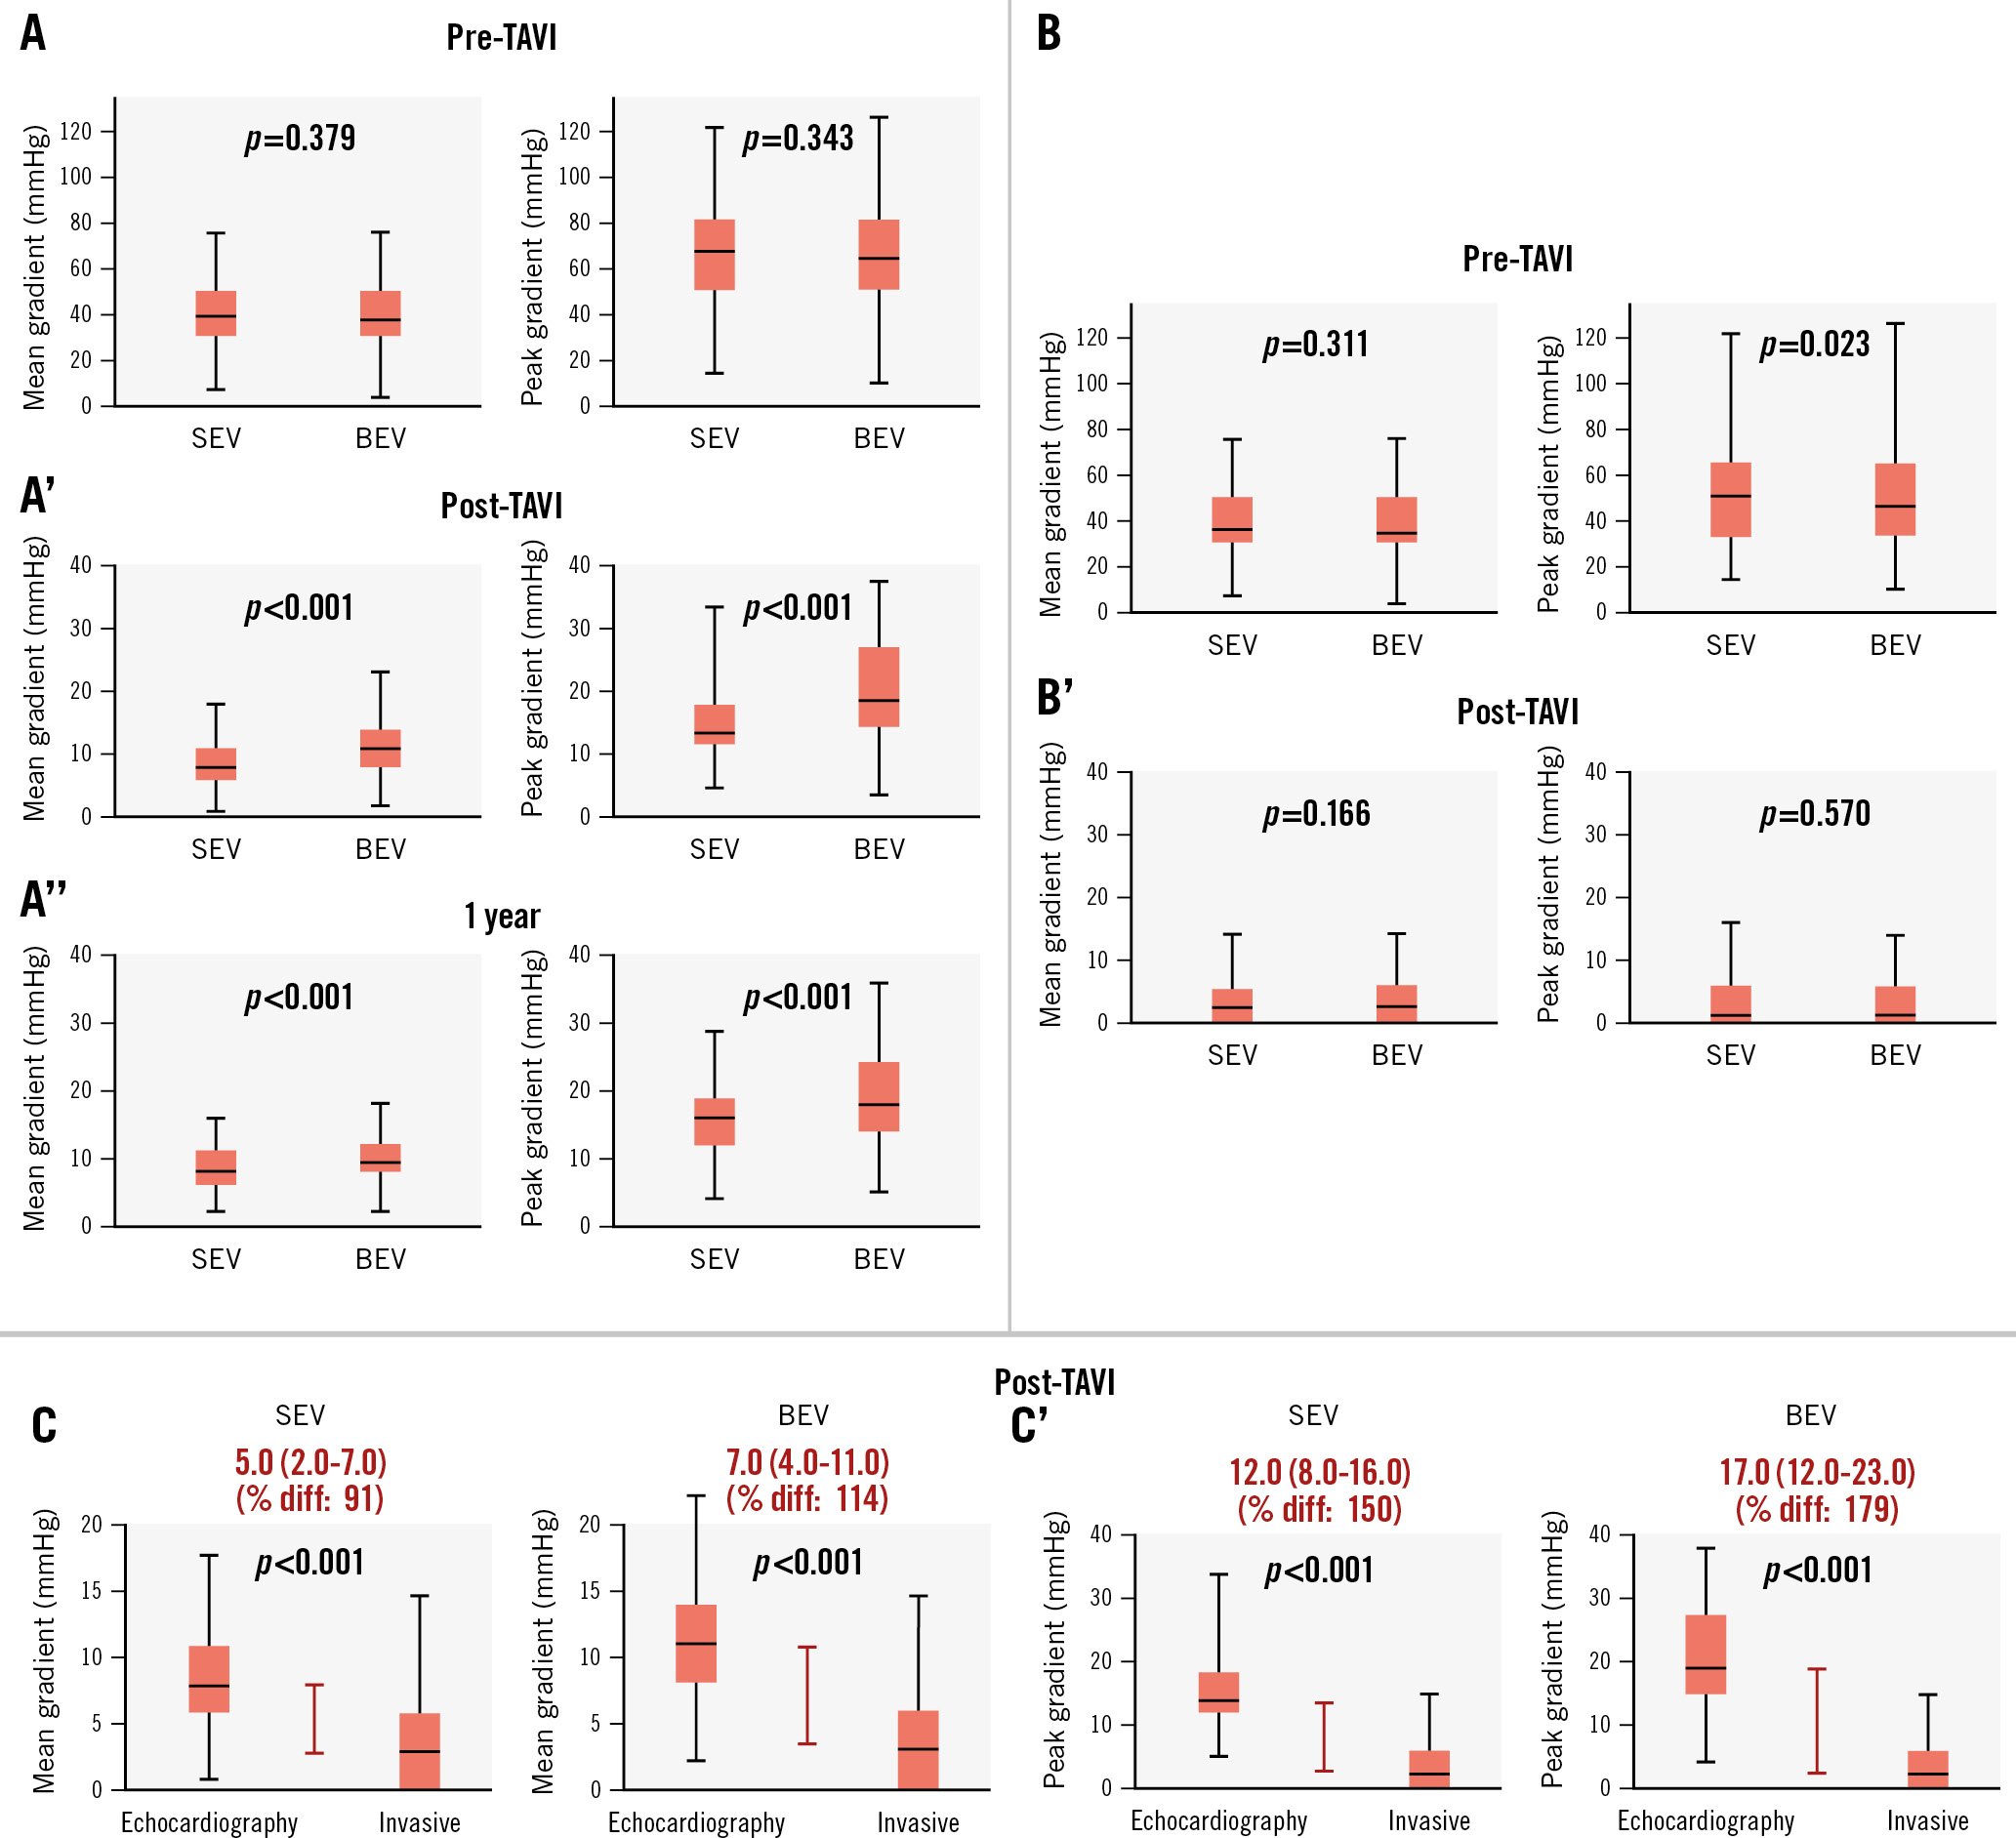
Figure 1. Echocardiographic and invasive pressure gradient measurements in self-expanding valve and balloon-expandable valve patients. A) Echocardiographic mean and peak pressure gradients pre-TAVI. A’) Echocardiographic mean and peak pressure gradients post-TAVI. A’’) Echocardiographic mean and peak pressure gradients at 1 year. B) Invasive mean and peak pressure gradients pre-TAVI. B’) Invasive mean and peak pressure gradients post-TAVI. C) Difference between post-TAVI invasive and echocardiographic mean gradients. C’) Difference between post-TAVI invasive and echocardiographic peak gradients. BEV: balloon-expandable valve; diff: difference; SEV: self-expanding valve; TAVI: transcatheter aortic valve implantation
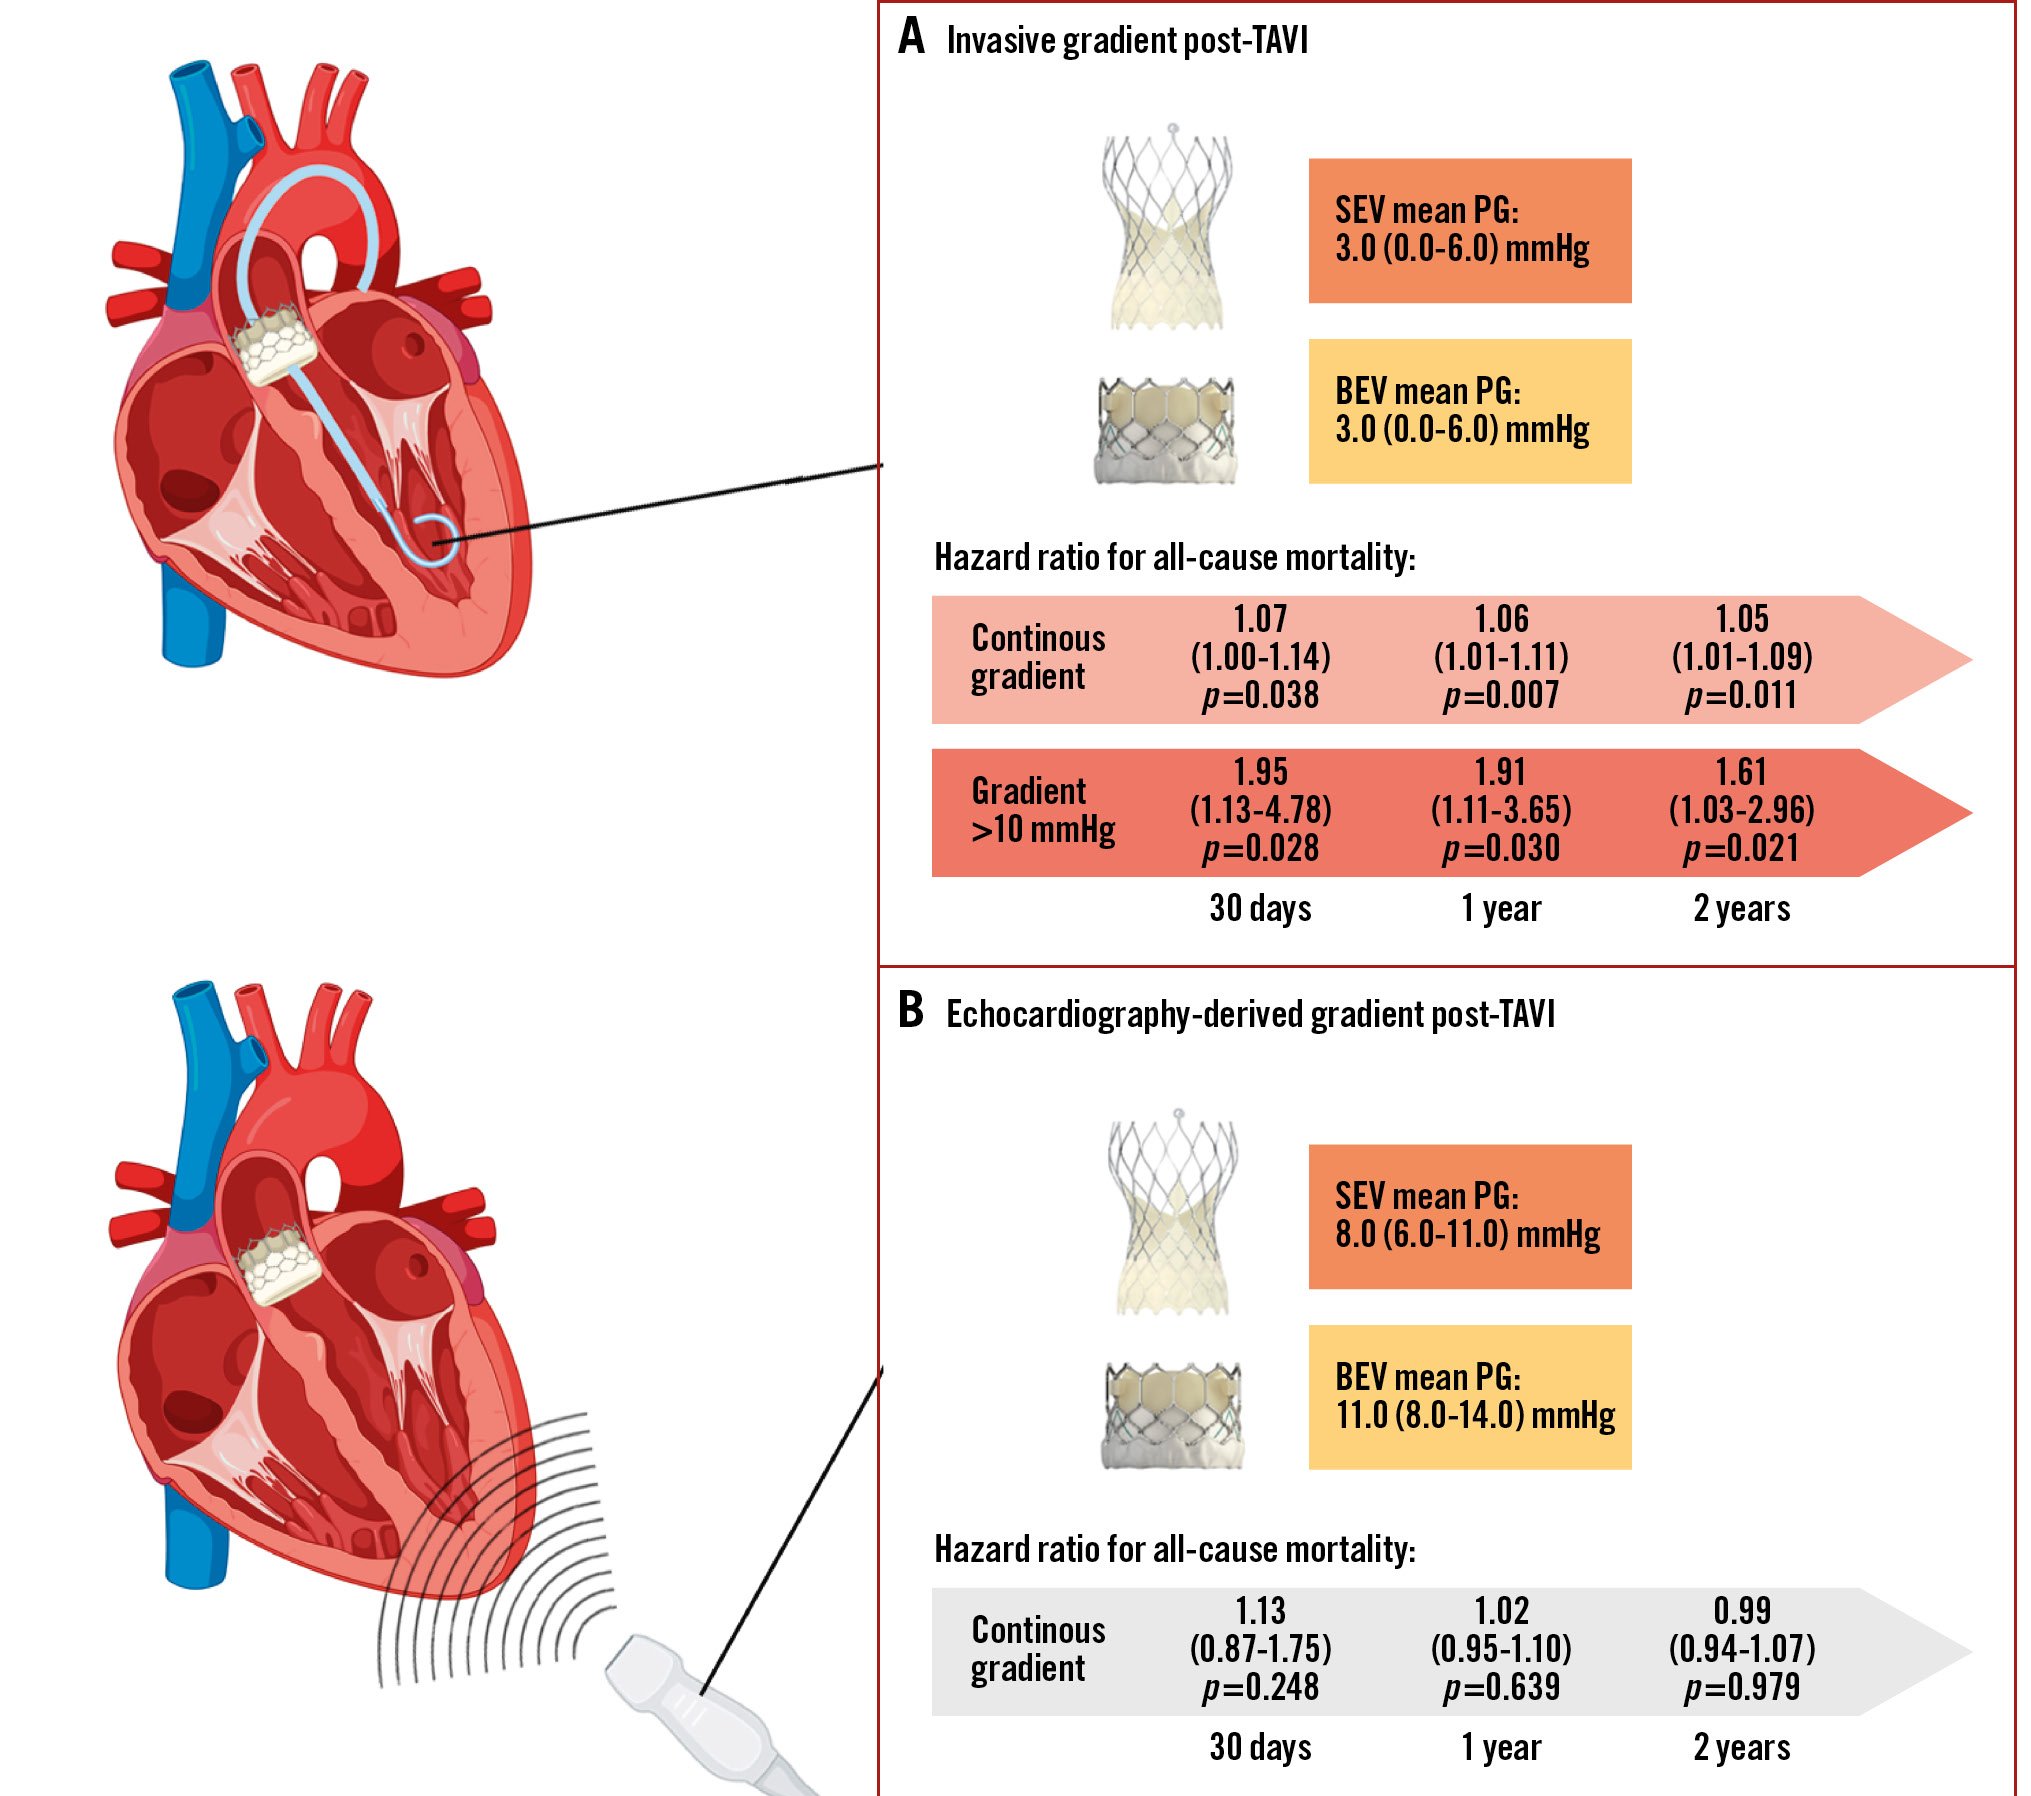
Central illustration. Discordance between echocardiographic and invasive gradient measurements after TAVI using self-expanding and balloon-expandable valves. A) Invasive mean gradients post-TAVI were equal in SEV and BEV. Invasive mean gradients independently predicted a higher risk for all-cause mortality at 30 days, 1 year and 2 years as a continuous variable and by using >10 mmHg as the cutoff. B) Echocardiography-derived mean gradients post-TAVI were higher in BEV than SEV. Echocardiography-derived mean gradients showed no significant association with all-cause mortality. BEV: balloon-expandable valve; PG: pressure gradient; SEV: self-expanding valve; TAVI: transcatheter aortic valve implantation
Table 3. Median difference between echo-derived versus invasive mean gradients (mmHg) post-TAVI for different valve size categories, LVEF categories, stroke volume index categories and aortic valve calcification degrees.
| Unmatched (n=1,211) | Matched (n=861) | |||||||||||||
|---|---|---|---|---|---|---|---|---|---|---|---|---|---|---|
| SEV+BEV | p-value | SEV (n=567)(ref=5.0) | p-value | BEV (n=644)(ref=7.0) | p-value | p-value(SEV vs BEV) | SEV+BEV | p-value | SEV (n=430)(ref=5.0) | p-value | BEV (n=431)(ref=7.0) | p-value | p-value(SEV vs BEV) | |
| Valve size* | ||||||||||||||
| Very small(VS) | 9.0(6.0-14.0) | ref | 8.0(4.0-13.0) | ref | 12.0(7.0-16.5) | ref | 0.109 | 8.0(4.0-14.0) | ref | 7.0(2.0-10.0) | ref | 11.0(5.5-17.0) | ref | 0.370 |
| Small(S) | 7.0(3.0-10.0) | 0.004& | 5.0(2.0-8.0) | 0.012& | 9.0(6.0-13.0) | 0.681 | <0.001& | 6.0(3.0-9.0) | 0.003& | 5.0(2.0-8.0) | 0.002& | 9.0(6.0-12.0) | 0.124 | <0.001& |
| Medium(M) | 6.0(3.0-9.0) | 0.006& | 4.0(2.0-7.0) | 0.001& | 7.0(4.0-10.0) | 0.005& | <0.001& | 6.0(3.0-9.0) | <0.001& | 5.0(2.0-7.0) | <0.001& | 7.0(5.0-11.0) | 0.008& | <0.001& |
| Large(L) | 5.0(4.0-8.0) | 0.022& | 4.0(2.0-6.0) | 0.039& | 6.0(4.0-9.0) | 0.018& | 0.013& | 5.0(3.0-8.0) | <0.001& | 4.5(2.0-6.5) | 0.011& | 7.0(3.0-9.0) | 0.001& | 0.058 |
| LVEF** | ||||||||||||||
| >50% | 7.0(3.0-10.0) | ref | 5.0(2.0-8.0) | ref | 8.0(5.0-11.0) | ref | <0.001& | 7.0(3.0-10.0) | ref | 5.0(2.0-7.0) | ref | 8.0(5.0-11.0) | ref | <0.001v |
| 40-50% | 6.0(3.0-9.0) | 0.416 | 4.0(0.0-7.0) | 0.104 | 7.0(4.0-9.0) | 0.220 | <0.001& | 6.0(3.0-9.0) | 0.164 | 5.0(1.0-7.0) | 0.739 | 7.0 (5.0-10.0) | 0.263 | <0.001& |
| <40% | 6.0(2.0-8.0) | 0.039& | 5.0(1.0-8.0) | 1.000 | 6.0(3.0-9.0) | 0.020& | 0.401 | 5.0(2.0-8.0) | 0.041& | 5.0(1.0-8.0) | 0.616 | 6.0(3.0-9.0) | 0.021& | 0.227 |
| Stroke volume index*** | ||||||||||||||
| >35 ml/m2 | 7.0(3.0-10.0) | ref | 5.0(2.0-7.8) | ref | 9.0(5.0-12.0) | ref | <0.001& | 7.0(3.0-9.0) | ref | 5.0(2.0-7.0) | ref | 9.0(5.0-12.0) | ref | <0.001& |
| ≤35 ml/m2 | 6.0(3.0-8.0) | 0.044& | 5.0(2.0-8.0) | 0.794 | 7.0(4.0-9.0) | 0.002& | <0.001& | 5.0(3.0-8.0) | 0.048& | 5.0(2.0-8.0) | 0.730 | 6.0(4.0-10.0) | 0.002& | <0.001& |
| AoV calcification**** | ||||||||||||||
| Severe | 7.0(3.0-9.0) | ref | 5.0(2.0-8.0) | ref | 9.0(5.0-11.0) | ref | <0.001& | 7.0(3.0-10.0) | ref | 5.0(2.0-7.0) | ref | 9.0(5.0-11.0) | ref | <0.001& |
| Moderate | 7.0(3.0-10.0) | 0.697 | 5.0(1.0-8.0) | 0.794 | 8.0(4.0-10.0) | 0.367 | <0.001& | 7.0(2.0-9.0) | 0.521 | 5.0(2.0-9.0) | 0.450 | 8.0(3.0-10.0) | 0.502 | <0.001& |
| Mild | 6.5(3.0-9.0) | 0.246 | 6.0(2.0-8.0) | 0.107 | 8.0(5.0-12.0) | 0.301 | <0.001& | 7.0(3.0-9.0) | 0.638 | 5.0(1.0-8.0) | 0.477 | 8.0(6.0-11.0) | 0.230 | <0.001& |
| Values are median (25th-75th percentile). &Indicates statistical significance. *For comparisons between valve size categories, “very small” is used as the reference. Other comparisons for the unmatched cohort: Total group: S vs M: p=0.357; S vs L: p=0.687; M vs L: p=0.706; SEV: S vs M: p=1.000; S vs L: p=1.000; M vs L: p=1.000; BEV: S vs M: p=0.0203; S vs L: p=0.000; M vs L: p=0.252. Other comparisons for the matched cohort: Total group: S vs M: p=0.169; S vs L: p=0.631; M vs L: p=0.423; SEV: S vs M: p=0.300; S vs L: p=0.837; M vs L: p=0.751; BEV: S vs M: p=0.005; S vs L: p≤0.001; M vs L: p=0.050. **For comparisons between LVEF tertiles, LVEF >50% is used as the reference category. Other comparisons for the unmatched cohort: Total group: LVEF <40% vs 40-50%: p=0.981; SEV: LVEF <40% vs 40-50%: p=0.720; BEV: LVEF <40% vs 40-50%: p=0.809. Other comparisons for the matched cohort: Total group: LVEF <40% vs 40-50%: p=0.840; SEV: LVEF <40% vs 40-50%: p=0.285; BEV: LVEF <40% vs 40-50%: p=0.216. ***For comparisons between stroke volume index category, SVI >35 ml/m2 is used as the reference. ****For comparisons between calcification degrees, severe calcification is used as the reference. Other comparisons for the unmatched cohort: Total group: moderate vs mild: p=0.731; SEV: moderate vs mild: p=0.570; BEV: moderate vs mild: p=0.469. Other comparisons for the matched cohort: Total group: moderate vs mild: p=0.387; SEV: moderate vs mild: p=0.206; BEV: moderate vs mild: p=0.588. AoV: aortic valve; BEV: balloon-expandable valve; LVEF: left ventricular ejection fraction; ref: reference; SEV: self-expanding valve; SVI: stroke volume index; TAVI: transcatheter aortic valve implantation | ||||||||||||||
Table 4. Clinical outcomes.
| Unmatched (n=1,211) | Matched (n=872) | |||||
|---|---|---|---|---|---|---|
| 30 days | SEV (n=573) | BEV (n=654) | Log-rank p | SEV (n=436) | BEV (n=436) | Log-rank p |
| All-cause mortality | 15 (2.5) | 14 (2.2) | 0.581 | 13 (3.0) | 8 (1.8) | 0.240 |
| Cardiovascular mortality | 10 (1.7) | 11 (1.7) | 0.659 | 9 (2.1) | 8 (1.7) | 0.259 |
| Rehospitalisation for heart failure | 5 (1.0) | 5 (0.7) | 0.834 | 1 (0.2) | 1 (0.2) | 0.707 |
| NYHA Class | 0.411* | 0.637 | ||||
| NYHA I | 287/466 (61.6) | 308/527 (58.4) | 212/361 (58.7) | 208/363 (57.3) | ||
| NYHA II | 136/466 (29.2) | 170/527 (32.2) | 116/361 (32.1) | 121/363 (33.3) | ||
| NYHA III | 41/466 (8.8) | 45/527 (8.5) | 31/361 (8.6) | 31/363 (8.5) | ||
| NYHA IV | 2/466 (0.4) | 4/527 (0.8) | 2/361 (5.5) | 3/363 (0.8) | ||
| Change in NYHA Class | –1.0(–1.5 to –0.5) | –1.0(–2.0 to 0.0) | 0.950* | –1.0(–1.0 to –0.5) | –1.0(–2.0 to 0.0) | 0.831 |
| 1 year | ||||||
| All-cause mortality | 49 (8.9) | 51 (7.7) | 0.628 | 41 (9.4) | 39 (8.9) | 0.215 |
| Cardiovascular mortality | 13 (2.2) | 15 (2.3) | 0.514 | 12 (2.8) | 10 (2.3) | 0.655 |
| Rehospitalisation for heart failure | 12 (2.2) | 12 (1.9) | 0.738 | 11 (2.5) | 8 (1.8) | 0.187 |
| Bioprosthetic valve failure | 17 (3.0) | 23 (3.5) | 0.254 | 13 (3.0) | 17 (3.9) | 0.389 |
| NYHA Class | 0.340* | 0.612 | ||||
| NYHA I | 135/247 (54.7) | 193/335 (57.6) | 121/231 (52.4) | 137/234 (58.5) | ||
| NYHA II | 84/247 (34.0) | 97/335 (28.9) | 85/231 (36.8) | 59/234 (25.2) | ||
| NYHA III | 26/247 (10.5) | 40/335 (11.9) | 23/231 (10.0) | 34/234 (14.5) | ||
| NYHA IV | 2/247 (0.8) | 5/335 (1.5) | 2/231 (0.9) | 4/234 (1.7) | ||
| Change in NYHA Class | –1.0(–2.0 to 0.0) | –1.0(–2.0 to 0.0) | 0.463* | –0.5(–1.0 to 0.0) | –0.5(–1.0 to 0.0) | 0.391 |
| 2 years | ||||||
| All-cause mortality | 74 (12.9) | 80 (12.2) | 0.481 | 58 (13.3) | 65 (14.9) | 0.648 |
| Cardiovascular mortality | 24 (4.2) | 22 (3.3) | 0.101 | 20 (4.6) | 16 (3.7) | 0.914 |
| Rehospitalisation for heart failure | 26 (4.5) | 22 (3.4) | 0.077 | 20 (4.6) | 21 (4.8) | 0.378 |
| Bioprosthetic valve failure | 25 (4.4) | 30 (4.6) | 0.850 | 19 (4.4) | 21 (4.8) | 0.792 |
| NYHA Class | 0.317* | 0.473 | ||||
| NYHA I | 108/228 (47.3) | 98/214 (45.8) | 103/215 (47.9) | 91/195 (46.6) | ||
| NYHA II | 96/228 (42.1) | 83/214 (38.7) | 92/215 (42.8) | 78/195 (40.0) | ||
| NYHA III | 24/228 (10.5) | 30/214 (14.0) | 20/215 (9.3) | 24/195 (12.3) | ||
| NYHA IV | 0/228 (0) | 3/214 (1.4) | 0/215 (0) | 2/195 (1.0) | ||
| Change in NYHA Class | –1.0(–1.5 to 0.0) | –1.0(–1.0 to 0.0) | 0.349* | 0.0(–0.5 to 0.0) | –0.0(–0.5 to 0.0) | 0.293 |
| Values are n (%) or n/N (%). *P-values for (change in) NYHA Class were calculated by the (McNemar) chi-square test. BEV: balloon-expandable valve; NYHA: New York Heart Association; SEV: self-expanding valve | ||||||
Table 5. Cox proportional hazards regression model for all-cause mortality.
| Univariable | 30 days | 1 year | 2 years | |||
|---|---|---|---|---|---|---|
| HR (95% CI) | p-value | HR (95% CI) | p-value | HR (95% CI) | p-value | |
| Age | 1.00 (0.95-1.05) | 0.798 | 0.98 (0.97-1.02) | 0.140 | 0.99 (0.98-1.02) | 0.787 |
| Male | 1.02 (0.96-1.09) | 0.224 | 0.95 (0.60-1.49) | 0.812 | 0.75 (0.51-1.12) | 0.163 |
| BMI | 1.05 (0.98-1.12) | 0.175 | 1.03 (0.99-1.07) | 0.165 | 1.03 (0.99-1.07) | 0.100 |
| STS score | 1.02 (0.96-1.09) | 0.724 | 1.03 (1.00-1.05) | 0.039& | 1.04 (1.00-1.08) | 0.034& |
| AVA | 0.83 (0.51-1.15) | 0.230 | 0.94 (0.82-1.12) | 0.723 | 1.49 (0.79-2.81) | 0.215 |
| Diabetes | 1.58 (0.66-3.71) | 0.299 | 1.09 (0.69-1.73) | 0.715 | 1.05 (0.71-1.56) | 0.806 |
| Hypertension | 0.73 (0.30-1.77) | 0.489 | 0.81 (0.50-1.29) | 0.378 | 0.78 (0.52-1.17) | 0.232 |
| eGFR | 0.99 (0.98-1.02) | 0.661 | 0.99 (0.98-1.01) | 0.641 | 1.00 (0.99-1.01) | 0.717 |
| eGFR <30 mL/min/1.73 m2 | 1.80 (0.66-4.92) | 0.251 | 1.48 (0.83-2.64) | 0.185 | 1.23 (0.72-2.09) | 0.450 |
| Baseline LVEF | 0.98 (0.95-1.02) | 0.304 | 0.99 (0.97-1.01) | 0.245 | 0.99 (0.97-1.00) | 0.135 |
| Baseline LVEF <30% | 3.45 (1.34-8.92) | 0.021& | 1.91 (1.04-3.50) | <0.001& | 3.16 (1.85-5.37) | <0.001& |
| Valve type (BEV/SEV) | 0.49 (0.20-1.18) | 0.112 | 0.89 (0.53-1.21) | 0.284 | 0.91 (0.56-1.24) | 0.279 |
| Echo gradients | ||||||
| Echo mean gradient post-TAVI (continuous) | 1.13 (0.87-1.75) | 0.248 | 1.02 (0.95-1.10) | 0.639 | 0.99 (0.94-1.07) | 0.979 |
| Echo mean gradient post-TAVI >10 mmHg | 1.07 (0.95-1.19) | 0.189 | 1.76 (0.51-7.66) | 0.309 | 1.32 (0.66-11.02) | 0.573 |
| Echo mean gradient post-TAVI >20 mmHg | 1.05 (0.96-1.14) | 0.205 | 2.37 (0.33-17.23) | 0.394 | 2.33 (0.32-16.90) | 0.404 |
| Invasive gradients | ||||||
| Invasive mean gradient post-TAVI (continuous) | 1.08 (1.01-1.15) | 0.034& | 1.05 (1.00-1.10) | 0.047& | 1.05 (1.01-1.09) | 0.009& |
| Invasive mean gradient post-TAVI >10 mmHg | 2.94 (1.12-8.31) | 0.030& | 1.83 (1.07-3.31) | 0.042& | 1.71 (1.04-2.82) | 0.036& |
| Invasive mean gradient post-TAVI >20 mmHg | 2.77 (0.37-20.69) | 0.320 | 2.15 (0.53-8.77) | 0.287 | 1.48 (0.37-6.02) | 0.581 |
| Multivariable | 30 days | 2 years | 2 years | ||||||
| B | HR(95% CI) | p-value | B | HR(95% CI) | p-value | B | HR(95% CI) | p-value | |
| Model 1 | |||||||||
| STS score | - | 0.043 | 1.04 (0.99-1.10) | 0.097 | 0.053 | 1.06 (0.99-1.12) | 0.099 | ||
| LVEF <30% | 1.234 | 3.43 (1.17-10.12) | 0.025& | 1.075 | 2.93 (1.58-5.45) | <0.001& | 1.171 | 3.23 (1.83-5.70) | <0.001& |
| Invasive mean gradient post-TAVI (continuous) | 0.067 | 1.07 (1.00-1.14) | 0.038& | 0.060 | 1.06 (1.01-1.11) | 0.007& | 0.050 | 1.05 (1.01-1.09) | 0.011& |
| Model 2 | |||||||||
| STS score | - | 0.157 | 1.17 (0.97-1.18) | 0.365 | 0.048 | 1.05 (0.99-1.13) | 0.096 | ||
| LVEF <30% | 1.306 | 3.69 (1.14-9.92) | 0.010& | 1.105 | 3.02 (1.70-5.72) | <0.001& | 1.218 | 3.38 (1.73-5.85) | <0.001& |
| Invasive mean gradient post-TAVI >10 mmHg | 0.667 | 1.95 (1.13-4.78) | 0.028& | 0.647 | 1.91 (1.11-3.65) | 0.030& | 0.476 | 1.61 (1.03-2.96) | 0.021& |
| &Indicates statistical significance. AVA: aortic valve area; B: beta value; BEV: balloon-expandable valve; BMI: body mass index; CI: confidence interval; eGFR: estimated glomerular filtration rate; HR: hazard ratio; LVEF: left ventricular ejection fraction; SEV: self-expanding valve; STS: Society of Thoracic Surgeons; TAVI: transcatheter aortic valve implantation | |||||||||
Discussion
The main findings of our comparative study of transprosthetic gradients by invasive measurement or echocardiography in TAVI with SEV or BEV are as follows: (1) only invasive mean gradients post-TAVI were associated with early, 1-year and 2-year mortality in both SEV and BEV; (2) invasive mean gradients post-TAVI were similar with SEV and BEV; (3) echocardiography-derived gradients were lower in SEV versus BEV patients; (4) there is a discordance between invasive and echocardiographic measurements before and after TAVI, with consistently lower invasive gradients; (5) this discordance is more pronounced with BEV than SEV; and (6) smaller THV size, higher LVEF and higher SVI increased the discordance.
Our data corroborate previous studies that showed a discordance between invasive and echocardiographic gradients. The randomised SOLVE-TAVI trial documented similar invasive gradients but higher gradients by echocardiography after BEV versus SEV20. Rodés-Cabau et al identified similar differences between BEV and SEV in valve-in-valve patients in the randomised LYTEN trial8. Abbas et al reported systematically higher gradients by echocardiography compared to invasive measurement and poor correlation between modalities614. Other authors have since reproduced these findings, both within the context of TAVI for native aortic valve stenosis as well as in degenerated bioprostheses1315.
Haemodynamic valve performance directly after valve implantation is assessed by invasive pressure recordings in the catheterisation laboratory and by echocardiography predischarge and at follow-up. It is vital to appreciate how both measurements are obtained. The invasive transaortic gradient is calculated as the net difference between left ventricular and aortic pressure and incorporates all contributing factors to flow, including pressure recovery. The technical limitations of invasive measurements are related to the need to calibrate the fluid-filled catheters and variation in catheter positioning in the ascending aorta (e.g., close to the sinotubular junction vs closer to the aortic arch). The ongoing DISCORDANCE TAVR (ClinicalTrials.gov: NCT04827238) study aims to evaluate the effects of catheter positioning on invasive pressure gradients15. Furthermore, catheters with multiple side holes may not capture the maximal gradient. Filling status, transient cardiac stunning and sedatives/anaesthesia may affect immediate flow post-TAVI, and changes in the hours following TAVI may result in different gradients over time621. These phenomena, however, would likely occur in both SEV and BEV groups, and our findings of equally low invasive gradients after TAVI in both groups corroborate this assumption. Moreover, in our centre, general anaesthesia is not applied, but instead, TAVI procedures are performed under local anaesthesia (with no sedation).
Echocardiography relies on Doppler flow velocities to determine transvalvular pressure gradients. However, echocardiography has intrinsic limitations (Supplementary Table 5). Sample errors can occur when the ultrasound beam is not properly aligned with actual flow direction. There is also no consensus on where the Doppler beam should be positioned relative to the stent frame of different THV platforms910.
Inherent limitations of the simplified Bernoulli formula may partly explain the discrepancies between invasive and echocardiographic gradients: the Bernoulli equation assumes laminar flow and a single level of stenosis and discards proximal LV velocity and pressure recovery, which may be accentuated after TAVI2223.
Pressure recovery relates to the phenomenon that the maximum speed of blood flow occurs at the narrowest point (vena contracta) and then decelerates entering the ascending aorta924252627. The loss of velocity occurs when kinetic energy is converted back to potential energy (e.g., blood pressure)2728. Pressure recovery is taken into account with an invasive measurement that is assessed above the valve in the ascending aorta. Conversely, with echocardiography, the maximum velocity is measured at the level of the vena contracta where pressure recovery has not yet occurred (Figure 2A).
We found lower echocardiographic maximum and mean gradients after TAVI with SEV versus BEV despite equal invasive gradients. The discordance between invasive and echocardiographic gradients was more pronounced with BEV than SEV in our series, which is consistent with previous research67891014. Furthermore, results from our subanalysis of patients with a small aortic annulus, which are in accordance with data from the recent SMART trial, yielded even greater discordance for BEV compared to SEV29.
We speculate that the greater discordance in BEV versus SEV could be related to THV frame design: the SEV outflow expands into the aorta and is approximately twice the size of the BEV outflow. An earlier study on the haemodynamic effects of THV design illustrated that SEV exhibit a longer conduit upstream of the leaflets compared to BEV, which may contribute to an increase in turbulent flow distal to the valve, less conversion to potential energy and hypothetically less pressure recovery10. Because of the assumed blunted pressure recovery with SEV, the invasively measured gradient may be higher, and the discrepancy between invasive and (overestimated) echocardiographic pressure measurements may therefore be smaller for SEV. An exaggerated representation of this phenomenon is illustrated in Figure 2B-Figure 2C. It is important to note that in the setting of a normally functioning THV, the overall proportion of turbulent flow is very limited.
For the first time, we have demonstrated that THV size, LVEF and SVI further affect the discordance between invasive and echocardiographic measurements. Indeed, we found greater discordance with a smaller THV size, which seems consistent with the notion that pressure recovery is more pronounced in smaller anatomies25. This phenomenon occurred with BEV and SEV but was most pronounced in BEV. Abbas et al found higher echocardiographic gradients in small compared to large THV sizes in BEV but not in SEV patients616.
Our data further suggest that a higher LVEF reinforces the discordance between invasive gradients and those derived by echocardiography. Although no specific studies on this phenomenon are available, we hypothesise that this is again related to limitations of the Bernoulli formula, which is not linear but contains a quadratic function. A higher transvalvular flow velocity with a higher LVEF will increase the transvalvular gradient in a quadratic proportion, which enhances the magnitude of the absolute echo versus invasive difference. This hypothesis is further supported by our finding that increasing SVI expands the magnitude of discordance, which was also shown by Stanová et al and Abbas et al916.
For the first time, we have shown that invasive but not echocardiographic gradients post-TAVI are an independent predictor for all-cause mortality at 30 days, 1 year and 2 years. This may help explain why in the randomised CHOICE trial, even though gradients by echocardiography were higher with BEV, there was no difference in outcome at 1 year or 5 years between BEV and SEV30. Also in the SOLVE-TAVI trial, there was no difference in clinical outcome between contemporary BEV and SEV platforms20. Abbas et al found no association between invasive gradients (>10 mmHg) and 2-year mortality, while Khalili et al described lower mortality with low (<5 mmHg) invasive gradients relative to higher gradients (>20 mmHg)618.
We hypothesise that invasive measurements ultimately provide the purest reflection of left ventricular load as they take pressure recovery into account (as opposed to echocardiography). This may explain why elevated echo gradients, which in some patients may be attributable to the intrinsic limitations of echocardiography rather than reflecting cardiac manifestations, are not predictors of all-cause mortality. Moreover, a substantial group of patients with elevated echo gradients relative to the median (e.g., 15.0-20.0 mmHg) demonstrated no mortality events during follow-up, which consequently further attenuates the association of echocardiographic gradients with mortality. In contrast, we typically registered low mean gradients by invasive assessment (median 3.0 mmHg), but when elevated (>10 mmHg), the likelihood of mortality was higher (Supplementary Figure 4). Collectively, our data underscore the value of invasive pressure acquisition immediately after TAVI and the importance for optimisation techniques (e.g., balloon post-dilatation) when a high residual gradient is invasively measured in the catheterisation laboratory. Echocardiography remains the standard for transprosthetic gradient follow-up over time, but the difference between predischarge echocardiography and invasive assessment should be documented to appropriately interpret an elevated gradient by echocardiography at a later follow-up. Furthermore, it seems reasonable to confirm any relevant gradient increments by invasive measurements before attributing clinical and therapeutic consequences.
Clinically relevant differences in pressure recordings between invasive and echocardiographic measurements are further demonstrated by our data – out of 19 patients with an elevated gradient (>20 mmHg) post-TAVI by echocardiography, only 5 patients (26.3%) had an invasive mean transaortic gradient >20 mmHg.
Future studies should further investigate differences in blood flow dynamics after implantation with BEV and SEV by using advanced imaging techniques, such as four-dimensional flow cardiovascular magnetic resonance.
Our findings highlight the importance of routine invasive assessment of transvalvular gradient after TAVI and suggest that a mean gradient >10 mmHg by invasive assessment should trigger further action.
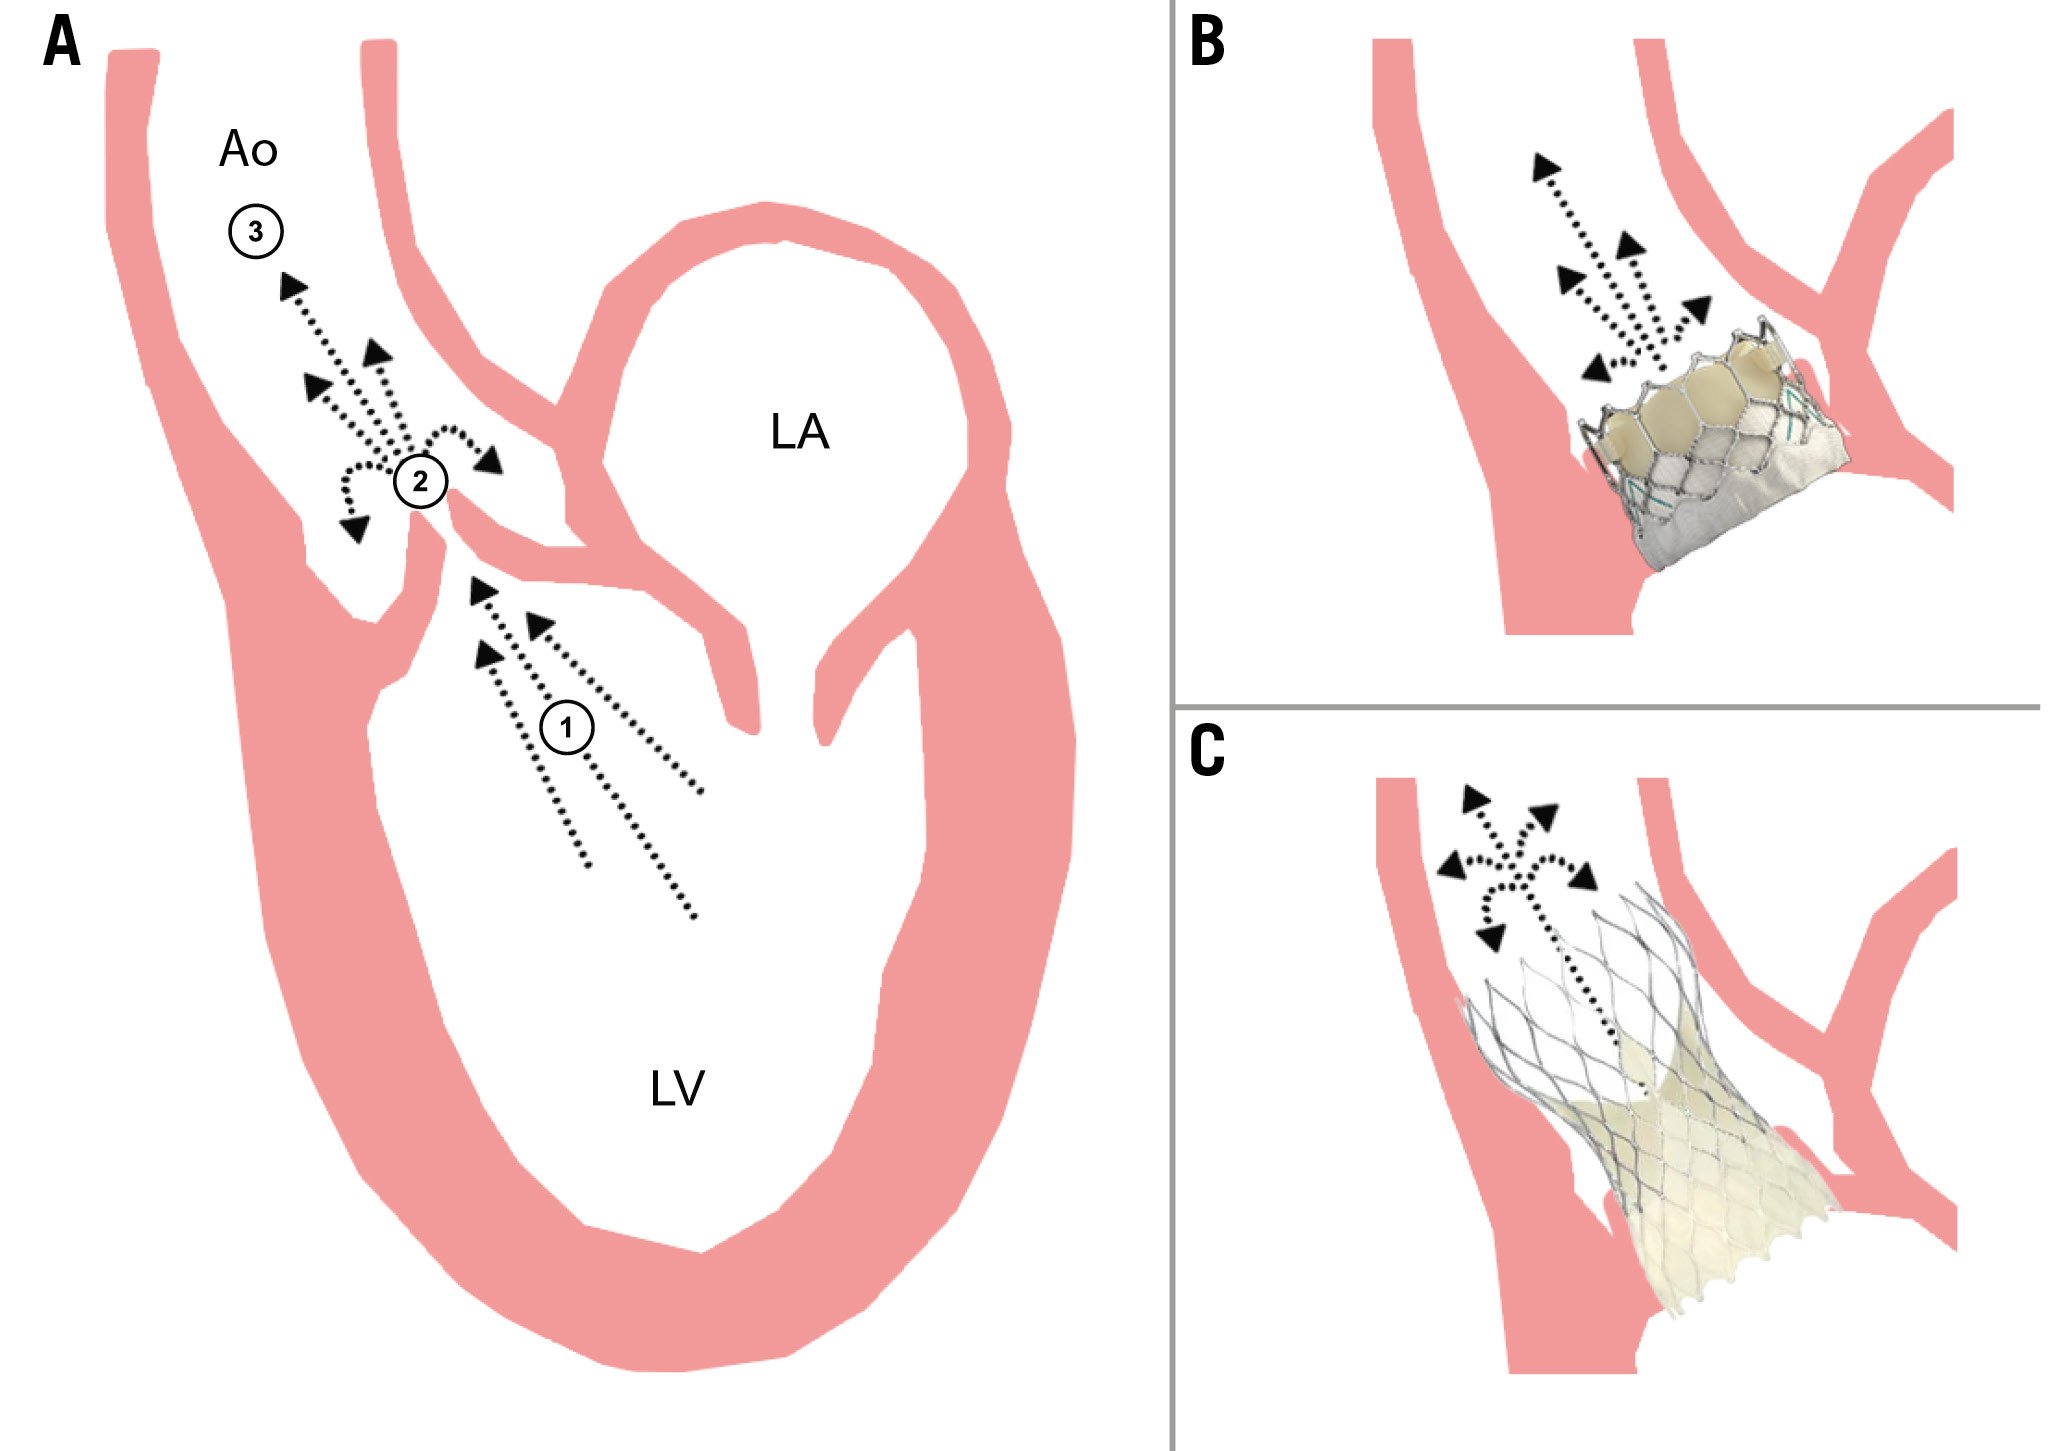
Figure 2. Illustration of the pressure recovery phenomenon. A) Maximum speed of blood flow occurs at the narrowest point (vena contracta) and decelerates entering the ascending aorta. Velocity loss occurs when kinetic energy is converted back to potential energy (e.g., blood pressure). Invasive transvalvular gradients are measured between the LVOT (1) and the ascending aorta (3) by using double-lumen fluid-filled catheters for simultaneous LV and aortic pressure measurements. Echo-derived measurement requires manual alignment of the interrogating Doppler beam with the highest-velocity flow across the aortic valve at the level of the vena contracta (2). B) Illustration of a balloon-expandable (SAPIEN 3 [Edwards Lifesciences]) THV. C) Illustration of a self-expanding (Evolut [Medtronic]) THV. SEV exhibit a longer conduit upstream of the leaflets compared to BEV, which contributes to increased turbulent flow distal to the valve, possibly dampening pressure recovery. BEV therefore exhibit a higher rate of pressure recovery than SEV. Ao: aorta; BEV: balloon-expandable valve; LA: left atrium; LV: left ventricle; LVOT: left ventricular outflow tract; SEV: self-expanding valve; THV: transcatheter heart valve
Limitations
Limitations of this study include (1) its retrospective nature – consequently, no randomised comparison between THV platforms was feasible; (2) selection bias – the transcatheter platform selection was per operator discretion and based on the aortic root anatomy as determined by MSCT. Baseline characteristics between the SEV and BEV cohorts displayed statistical differences; however, it seems unlikely these differences were relevant for our findings since a propensity-matched analysis corroborated our main findings; (3) the absence of an independent core lab; and (4) the time interval between the immediate invasive measurements and the later echocardiographic measurements (up to 24 hours after implantation) may coincide with different haemodynamic loading conditions, LV recovery and ongoing (nitinol) frame expansion at the time of the respective gradient assessments.
Many previous studies comparing invasive and echocardiographic pressure measurements after TAVI had smaller sample sizes, were restricted to patient subsets, relied on suboptimal echocardiography in the catheterisation laboratory with the patient in supine position814, or had longer intervals between invasive and echocardiography-derived measurements89. The relatively larger sample size, meticulous and methodological data acquisition and correlation with clinical outcome make our dataset robust.
Conclusions
Only invasively measured but not echocardiography-derived transvalvular mean gradients correlate with 30-day, 1-year and 2-year mortality. Aortic gradient measurements are higher by echocardiography than by invasive assessment, and more so for BEV than SEV. Smaller valve size, higher ejection fraction and higher stroke volume increase this discordance between echocardiography and invasive assessment.
Impact on daily practice
In transcatheter aortic valve implantation (TAVI) patients, invasive but not echocardiographic gradients are a predictor of all-cause mortality. This highlights the clinical relevance of invasive-echocardiography discordance and the importance of invasive pressure acquisitions after TAVI. Aortic gradient measurements are higher by echocardiography than by invasive assessment, and this discordance is larger after TAVI with balloon-expandable than self-expanding valves.
Conflict of interest statement
N.M. Van Mieghem reports grants or contracts from Abbott, Boston Scientific, Biotronik, Edwards Lifesciences, Medtronic, PulseCath BV, Abiomed, and Daiichi Sankyo; consulting fees from JenaValve, Daiichi Sankyo, Abbott, Boston Scientific, and Medtronic; and payment or honoraria for lectures, presentations, speakers bureau, manuscripts and educational events from Abiomed, Amgen, and JenaValve. J. Daemen reports grants or contracts from AstraZeneca, Abbott, Boston Scientific, Acist Medical, Medtronic, MicroPort, Pie Medical, and Recor Medical; and consultancy and speaker fees from Abbott, Abiomed, Acist Medical, Boston Scientific, Cardialysis BV, CardiacBooster, Kaminari Medical, Recor Medical, PulseCath, Pie Medical, Sanofi, Siemens, and Medtronic. A. Hirsch reports grants and consultancy fees from GE HealthCare; speaker fees from GE HealthCare and Bayer; and he is also a member of the medical advisory board of Medis Medical Imaging Systems. The other authors have no conflicts of interest to declare.
Supplementary data
To read the full content of this article, please download the PDF.