Abstract
BACKGROUND: Continuous intracoronary thermodilution with saline allows for the accurate measurement of volumetric blood flow (Q) and absolute microvascular resistance (Rμ). However, this requires repositioning of the temperature sensor by the operator to measure the entry temperature of the saline infusate, denoted as Ti.
AIMS: We evaluated whether Ti could be predicted based on known parameters without compromising the accuracy of calculated Q. This would significantly simplify the technique and render it completely operator independent.
METHODS: In a derivation cohort of 371 patients with Q measured both at rest and during hyperaemia, multivariate linear regression was used to derive an equation for the prediction of Ti. Agreement between standard Q (calculated with measured Ti) and simplified Q (calculated with predicted Ti) was assessed in a validation cohort of 120 patients that underwent repeat Q measurements. The accuracy of simplified Q was assessed in a second validation cohort of 23 patients with [15O]H2O positron emission tomography (PET)-derived Q measurements.
RESULTS: Simplified Q exhibited strong agreement with standard Q (r=0.94, confidence interval [CI]: 0.93-0.95; intraclass correlation coefficient [ICC] 0.94, CI: 0.92-0.95; both p<0.001). Simplified Q exhibited excellent agreement with PET-derived Q (r=0.86, CI: 0.75-0.92; ICC=0.84, CI: 0.72-0.91; both p<0.001). Compared with standard Q, there were no statistically significant differences between correlation coefficients (p=0.29) or standard deviations of absolute differences with PET-derived Q (p=0.85).
CONCLUSIONS: Predicting Ti resulted in an excellent agreement with measured Ti for the assessment of coronary blood flow. It significantly simplifies continuous intracoronary thermodilution and renders absolute coronary flow measurements completely operator independent.
Coronary microvascular dysfunction (CMD) is an important cause of morbidity in patients with angina with non-obstructive coronary arteries (ANOCA). Current guidelines recommend a dedicated diagnostic workup, including microvascular function testing, in patients with ANOCA1. Yet, CMD remains an ill-defined entity, mainly because of the difficulty in quantifying it. Microvascular resistance (Rμ), the quintessential metric that describes the function of the microcirculation, is derived from the measurement of coronary blood flow (Q). Thus, a reliable quantification of Rμ depends on an accurate measurement of Q. Until recently, the measurement of Q in humans had not been possible. Since the introduction of continuous intracoronary thermodilution23, the technique has been simplified4 and extensively validated5678910, now permitting the measurement of Q (in ml/min) at rest and during hyperaemia, without the requirement for a pharmacological agent. A standardised approach to the technique and its use for the diagnosis of CMD was recently published11.
However, the technique of continuous intracoronary thermodilution relies on the precise measurement of the temperature of the infusate when it enters the coronary artery, denoted as Ti. The measurement of Ti requires the careful repositioning of the temperature sensor to the tip of the infusion catheter under fluoroscopic guidance. Eliminating the need for an actual measurement of Ti would significantly simplify and shorten the procedure, and render the technique completely operator independent. Yet, such a simplification of the technique can only be applied if its accuracy (i.e., closeness of a measurement to its true value) and precision (i.e., how close repeat measurements are to one another) are preserved.
Accordingly, in the present study, we propose a major simplification of the continuous intracoronary thermodilution technique that eliminates the pullback of the sensor to measure Ti. We investigate whether the proposed modification preserves the accuracy of thermodilution-derived measurements of Q by comparison with measurements of Q derived from [15O]H2O positron emission tomography (PET).
Methods
THEORETICAL BACKGROUND AND RATIONALE
To perform continuous thermodilution-derived flow measurements, saline at room temperature is infused at a defined flow rate (Qi) into the proximal artery via a dedicated microcatheter (RayFlow catheter [Hexacath]) that ensures instantaneous mixing with blood. The temperature of blood in the distal vessel (T) is recorded continuously during the infusion using a standard pressure/temperature wire (PressureWire X [Abbott]) connected to dedicated software (CoroFlow [Coroventis]) and displayed on the main screen next to the fluoroscopy screen. If the temperature of the infusate at the tip of the catheter (Ti) is known, absolute coronary flow (Q) can be calculated using the following equation (Equation 1), with values of T and Ti both being relative to the blood temperature: Equation 1
Continuous thermodilution-derived absolute flow demonstrates excellent agreement with absolute flow measured using [15O]H2O PET perfusion imaging, the gold standard for the quantification of absolute coronary flow12. Furthermore, coronary indices derived from continuous intracoronary thermodilution exhibit markedly better repeatability than when derived from bolus and Doppler techniques1314. Yet, continuous thermodilution-derived Q requires the measurement of Ti for its calculation, as highlighted in Equation 1. The RayFlow catheter has two 50 μm inner holes (sensor holes) between its outer and inner lumen. These sensor holes are located 2.5 mm distal to a radiopaque marker that is visible during angiography. These holes permit direct contact between the infused saline and the temperature sensor of the guidewire, when the latter is pulled back into the catheter. This results in the precise assessment of the temperature of saline at the very moment it enters into the coronary artery. In practice, upon measurement of T in the distal vessel, the operator is required to withdraw the temperature sensor and carefully reposition it at the level of the inner holes of the infusion catheter, i.e., 2.5 mm distal to the catheter’s radiopaque marker. The operator is then required to wait for stabilisation of the temperature signal (typically ~30 seconds) before recording a value for Ti. This process is required for both resting and hyperaemic Qi. The imprecise positioning of the temperature sensor relative to the infusion holes of the catheter is a potential source of error introduced by the operator.

Equation 1.
PATIENTS
A total of 514 patients were included in the study, divided into 3 distinct cohorts: derivation cohort (n=371), validation cohort 1 (agreement; n=120), and validation cohort 2 (accuracy; n=23) (Figure 1). For the derivation cohort and validation cohort 1, patients with ANOCA, defined as the absence of an angiographically significant epicardial stenosis (diameter stenosis [DS] >50%) by visual estimate, were included from 5 European centres (Cardiovascular Center OLV, Aalst, Belgium; Catharina Hospital Eindhoven, the Netherlands; Department of Cardiology of the Vrije Universiteit Amsterdam, the Netherlands; Radboud University Medical Center, the Netherlands; Essex Cardiothoracic Centre, United Kingdom) between February 2020 and June 2023. Patients were excluded if they had clinical signs or symptoms of congestive heart failure, severe valvular heart disease requiring either surgical or percutaneous intervention, a history of coronary artery bypass grafting, or a tortuous coronary anatomy in which wire manipulation might have been complex.
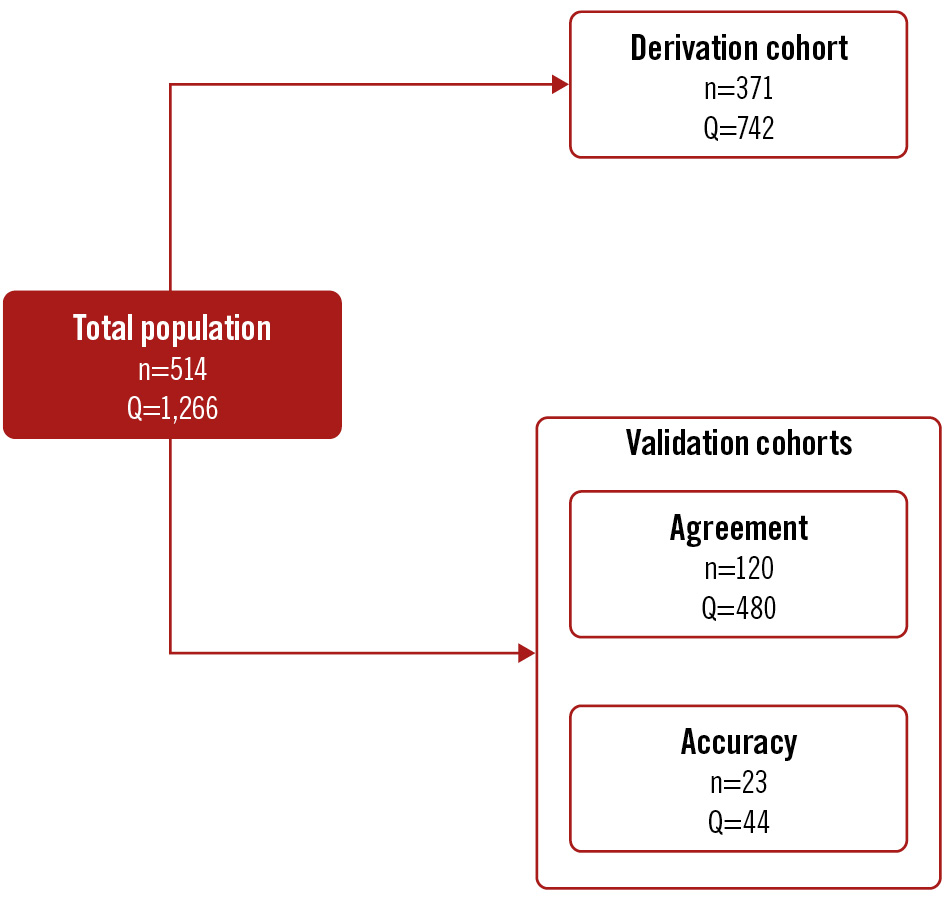
Figure 1. Summary of the study cohorts. Q: the number of absolute coronary flow measurements peformed
I. DERIVATION COHORT
The derivation cohort was used to derive an equation for the prediction of Ti (predicted Ti). This cohort contained patients from multiple centres in order to capture any heterogeneity in practices/measurements. Critically, only centres with adequate experience in the technique were included. All measurements were performed under both resting and hyperaemic conditions. For patients in the derivation cohort, microvascular function was assessed in the left anterior descending artery (LAD; n=338), left circumflex artery (LCx; n=7) or right coronary artery (RCA; n=26). For resting measurements, saline infusion rates of 8 ml/min were used to simulate resting conditions in the RCA, 8 or 10 ml/min in the LCx, and 10 ml/min in the LAD. For hyperaemic measurements, a saline infusion rate of 15 ml/min was used for the RCA and the LCx, and 20 ml/min was used for the LAD15. Of note, a rate of 15 ml/min was employed in the RCA and LCx (particularly in a dominant LCx) in order to reduce the risk of atrioventricular block8.
II. VALIDATION COHORT FOR AGREEMENT AND PRECISION
This unique cohort was used to compare the correlation, absolute agreement, and precision of Q calculated with measured Ti versus predicted Ti. In addition, this cohort permitted analysis of the variability in measured Ti between repeat thermodilution runs performed by the same operator minutes apart. The inclusion and exclusion criteria for the validation cohort were identical to those of the derivation cohort. Further details of this cohort have been reported previously13. For patients in the validation cohort, all measurements were made in the LAD. Saline infusion rates of 10 ml/min and 20 ml/min were used for resting and hyperaemic measurements, respectively. In addition, all temperature measurements were performed in duplicate, with a strict 2 minute interval between measurements. Thus, a total of 240 resting and 240 hyperaemic measurements were performed in the validation cohort.
III. VALIDATION COHORT FOR ACCURACY
Full details of this cohort have been described previously12. Patients were included if they had undergone [15O]H2O PET followed by invasive coronary angiography (ICA) and continuous intracoronary thermodilution within 7 days. All measurements were performed during hyperaemic conditions induced by infusion rates of 15 ml/min or 20 ml/min for the LCx and LAD, respectively (no adenosine was used for continuous intracoronary thermodilution measurements). For direct comparison with Q (ml/min) measured by continuous thermodilution, values of myocardial perfusion from PET (ml/min/g) were obtained during intravenous adenosine infusion (140 μg/kg/min for at least 4 minutes) and were adjusted by subtended myocardial mass measured by coronary computed tomography angiography (CCTA). This permitted the calculation of absolute coronary flow (ml/min) from myocardial perfusion (ml/min/g).
CONTINUOUS INTRACORONARY THERMODILUTION
Coronary angiography was performed via radial or femoral artery access. A 6 Fr guiding catheter was used, and 0.2 mg of intracoronary isosorbide dinitrate was administered. A guidewire equipped with a pressure/temperature sensor (PressureWire X) was connected to dedicated software for tracing analysis (CoroFlow) and, after zeroing, was advanced through the guiding catheter. The pressures recorded by the pressure/temperature wire and by the fluid-filled guide catheter were equalised close to the tip of the guiding catheter. Next, the wire was advanced into the distal part of the coronary artery, and the temperature zeroed.
For the measurement of absolute coronary flow, a dedicated monorail infusion 2.52 Fr microcatheter with 4 distal side holes (RayFlow) was advanced over the pressure/temperature wire and connected to the 200 ml motorised syringe of an automated injection system (MEDRAD Stellant [Bayer]) filled with room temperature saline (typically between 20°C and 23°C). The infusion catheter was advanced into the artery being investigated, and its tip was positioned into the first millimetres of the vessel. Absolute resting (Qrest) and hyperaemic (Qhyper) flow measurements were obtained using saline infusion rates as described above.
The resting and hyperaemic infusion protocols were either performed with separate runs for resting and hyperaemic states with a manually programmed infusion pump or a single run with an automatically programmed infusion pump16.
CORONARY INDICES
Absolute coronary flow (Q) in ml/min was calculated as per Equation 1. Absolute microvascular resistance (Rμ) in Wood units (WU) was calculated at rest using Equation 2, where Pa is the central aortic pressure: Equation 2
Rμ in WU was calculated during hyperaemia using Equation 3, where Pd is the distal coronary pressure: Equation 3
Coronary flow reserve (CFR) was calculated using the following equation (Equation 4): Equation 4
Microvascular resistance reserve (MRR) was calculated with the following equation (Equation 5) where Pa,rest and Pa,hyper correspond to the aortic pressure measured during resting and hyperaemic conditions, respectively. Equation 5

Equation 2.

Equation 3.

Equation 4.

Equation 5.
STATISTICS
Continuous variables with normal distribution are expressed as mean±standard deviation (SD) and non-normally distributed variables as median and the first and third quartiles (Q1-Q3). Categorical variables are expressed as count and percentages.
Using the derivation cohort, multivariate linear regression was performed with Ti as the dependent variable in order to derive an equation for the prediction of Ti. The following variables were tested as covariates in a multivariate model: T, Qi, body mass index (BMI), height, weight, sex.
The association between two continuous variables was assessed using (i) Pearson’s correlation coefficient to assess for a linear correlation, and (ii) Bland-Altman analysis and the intraclass correlation coefficient (ICC) computed using a 2-way mixed-effect model in order to assess the absolute agreement between values. Comparisons between 2 independent Pearson’s correlation coefficients (non-overlapping variables, e.g., A-B and X-Y) were performed using Fisher’s z-transformation for correlation coefficients17. Comparisons between dependent coefficients (overlapping variables e.g. X-Y and X-Z) were performed as described by Steiger18. The comparison of the SD of differences of one Bland-Altman analysis with another was performed using the F-test19. The repeatability coefficient (RC) was used to assess the variability between repeat measures of the same parameter20. Variability between 2 measurements (e.g., A and B) was assessed as their difference (A−B) divided by their mean, and expressed as a percentage. Passing-Bablok regression was used in the agreement analysis comparing indices calculated with measured Ti and predicted Ti in order to assess for systematic and proportional differences. For Passing-Bablok regression analysis, no systematic bias between measurements was assumed if the 95% confidence interval (CI) of the intercept included the value 0, whereas an absence of significant proportional bias was assumed if the 95% CI of the slope included the value 1.
All analyses were performed using Python 3.11.4 (Python Software Foundation). A p-value<0.05 was considered statistically significant.
Results
IV. PRECISION: DOES THE SUBSTITUTION OF Ti INFLUENCE THE REPEATABILITY OF CORONARY INDICES?
In validation cohort 1 (agreement+precision), repeat measurements of standard Q demonstrated a strong correlation (r=0.94, CI: 0.92-0.95; p<0.001) with excellent absolute agreement (ICC=0.94, CI: 0.92-0.95; p<0.001) (Supplementary Figure 3A, Supplementary Figure 3B). When Q was recalculated with predicted Ti, the correlation between simplified Q1 and Q2 (r=0.95, CI: 0.94-0.96; p<0.001) remained unchanged (p=0.115) (Supplementary Figure 3C). However, the SD of differences between Q1 and Q2 decreased significantly (predicted Ti: SD 24.05 vs measured Ti: SD 29.58; F-test p<0.001), and the repeatability coefficient decreased (predicted Ti: 48.77 vs measured Ti: 60.01) (Supplementary Figure 3D, Supplementary Figure 3F).
Similarly, simplified Rμ, CFR and MRR all demonstrated improved repeatability with the use of predicted Ti (Supplementary Figure 4-Supplementary Figure 6).
A summary of the study findings is shown in the Central illustration.
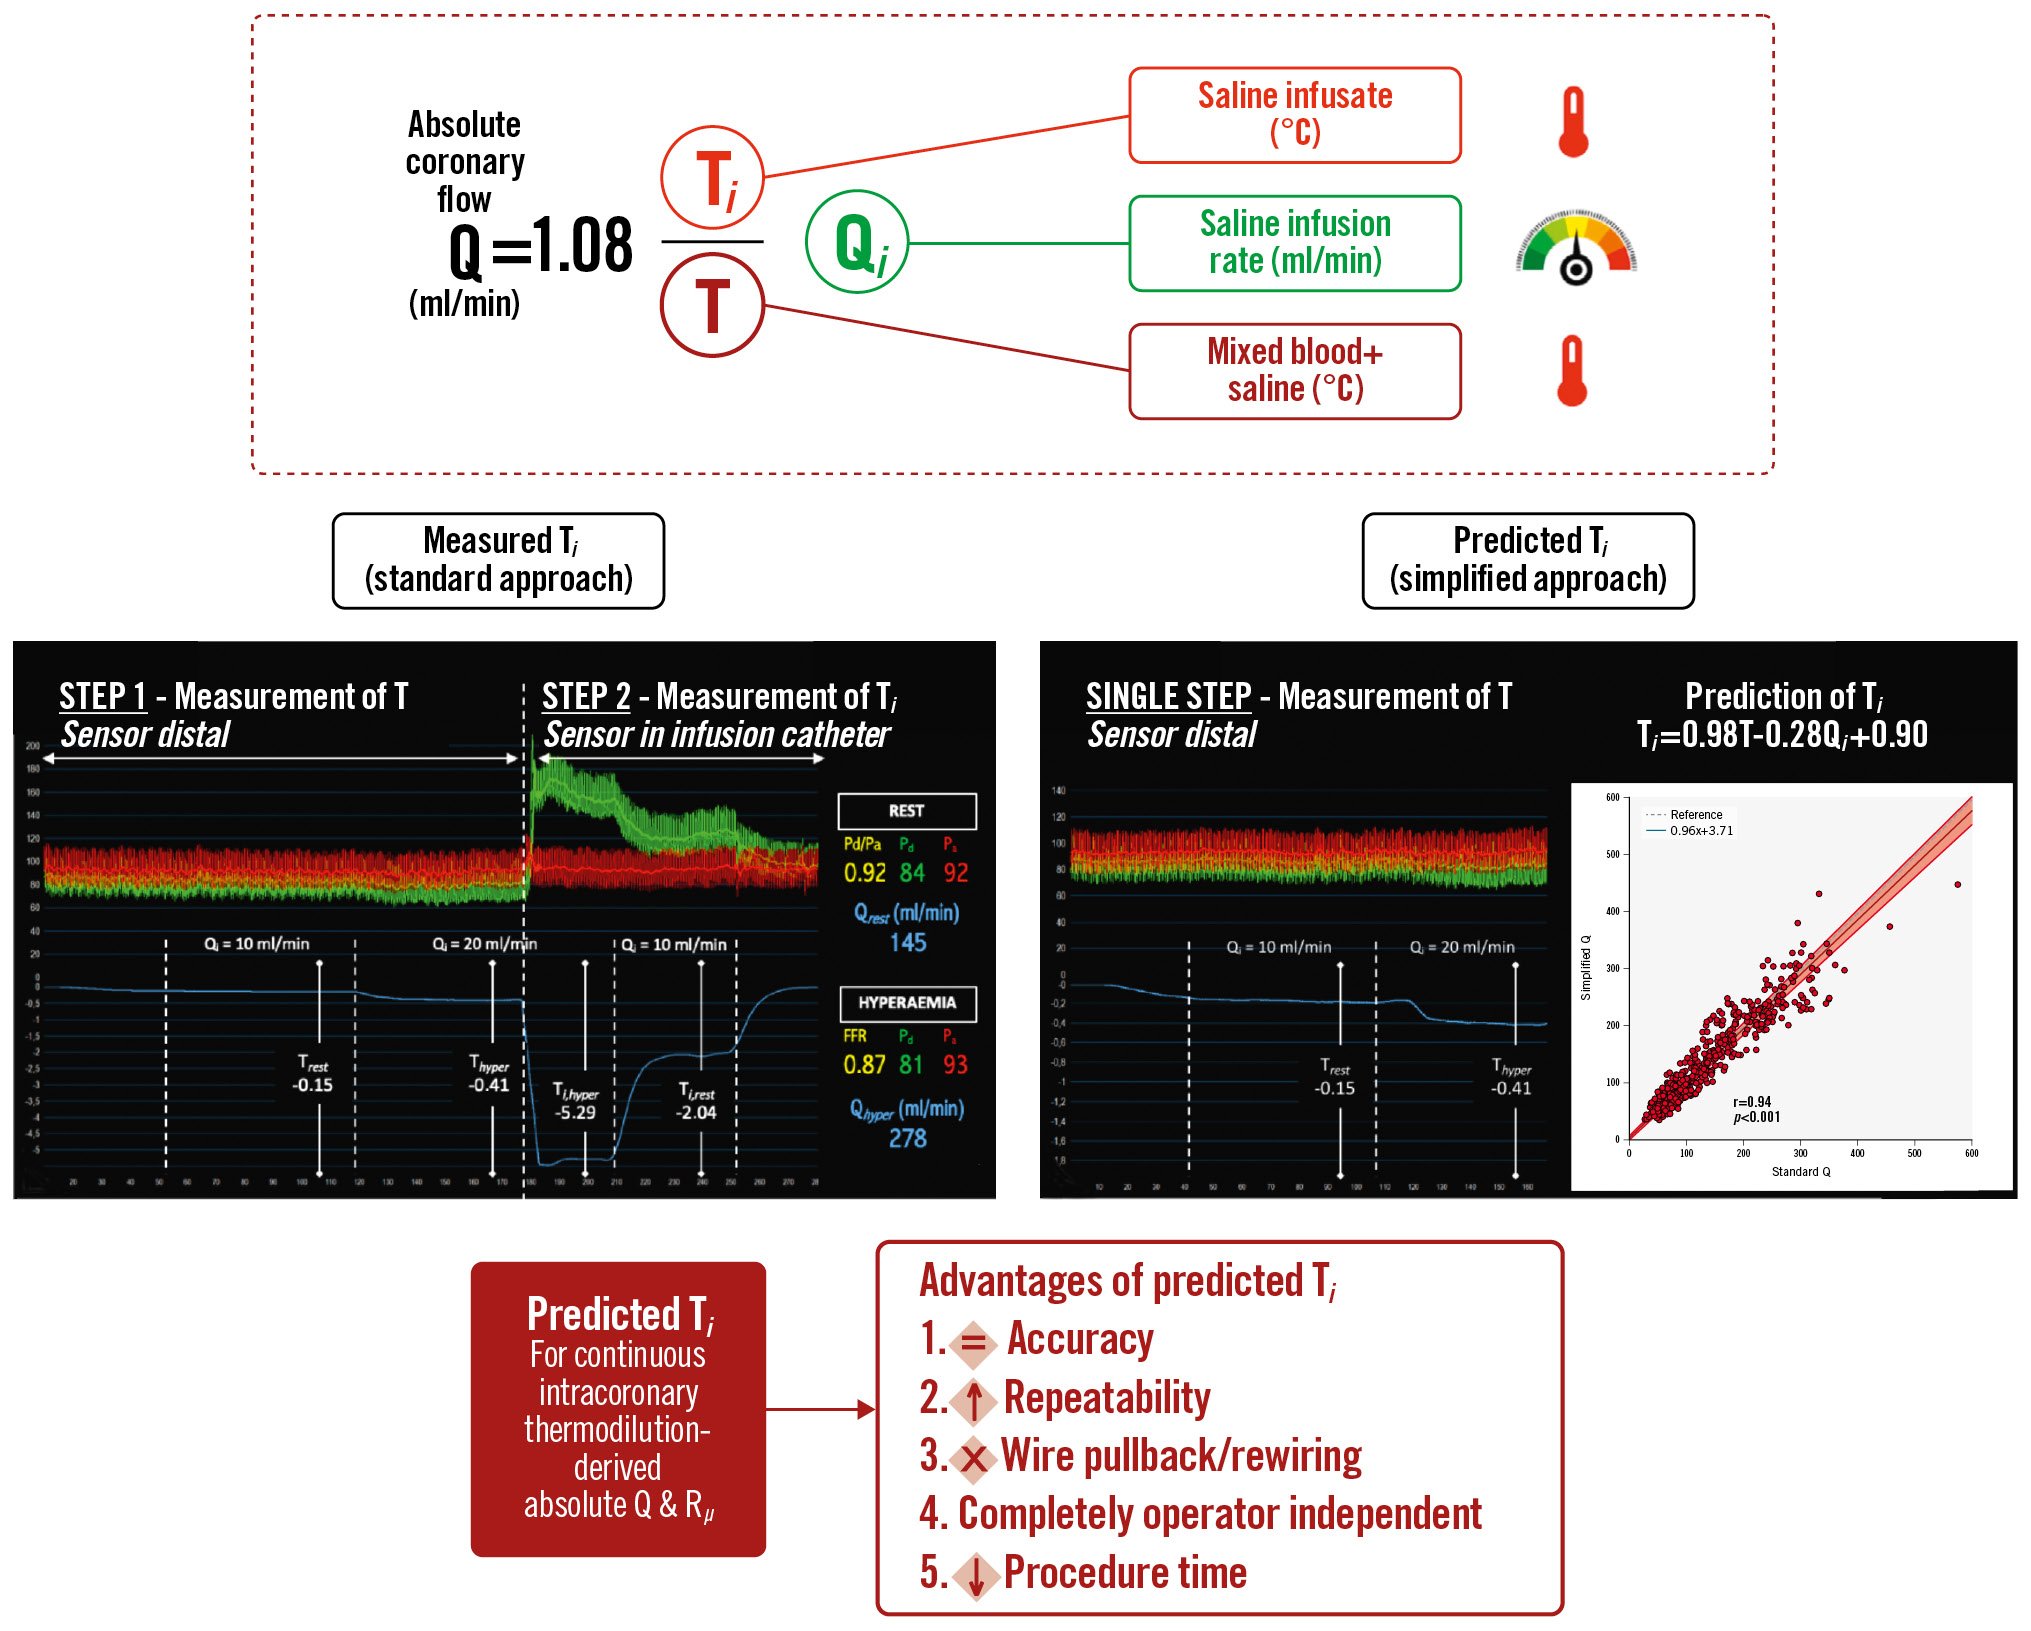
Central illustration. Simplifying continuous intracoronary thermodilution using absolute coronary flow and microvascular resistance. The simplification of continuous intracoronary thermodilution through the derivation of an equation for the prediction of the temperature of the saline infusate. FFR: fractional flow reserve; Pa: aortic pressure; Pd: distal coronary pressure; Pd/Pa: distal coronary-to-aorta pressure ratio; Q: absolute coronary flow; Qhyper: Q at hyperaemia; Qi: saline infusion rate; Qrest: Q at rest; Rµ: absolute microvascular resistance; T: temperature of mixed blood and saline; Thyper: T at hyperaemia; Ti: temperature of saline infusate before entering the bloodstream; Trest: T at rest
I. DERIVATION OF AN EQUATION FOR THE PREDICTION OF Ti
A total of 371 patients with ANOCA were included in the derivation cohort. All patients underwent continuous intracoronary thermodilution measurements in a single coronary artery during both resting and hyperaemic conditions, and thus 742 measurements were available in total (LAD=676, RCA=52, LCx=14). Multivariate linear regression testing a range of covariates found that only T and Qi were significant predictors of Ti (both p<0.0001), with all other covariates having p-values>0.500. The final bivariate model with just T and Qi as covariates was strongly predictive of Ti (R2=0.811). Standardisation of the model coefficients using the z-score demonstrated that Qi (standardised coefficient 1.39) was a significantly stronger contributor to the prediction of Ti than T (standardised coefficient 0.28). The final equation (Equation 6) for Ti derived from the bivariate regression model is shown (of note, T and Ti should always have negative values): Equation 6
Given the large value of Qi relative to T, the value of Ti is most strongly governed by Qi, with a small correction applied using T. The addition of the constant of 0.90 prevents a systematic bias in the prediction of Ti.
For simplicity and to improve the readability of the results, values of Q calculated with measured Ti will be referred to as standard Q, and values of Q calculated with predicted Ti will be referred to as simplified Q.

Equation 6.
II. AGREEMENT BETWEEN STANDARD Q AND SIMPLIFIED Q
Validation cohort 1 (agreement) consisted of 120 patients who underwent repeat absolute coronary flow measurements during both resting (Qrest1 and Qrest2) and hyperaemic (Qhyper1 and Qhyper2) conditions, corresponding to 480 separate measurements.
Q was calculated with Equation 1 using measured Ti (standard Q) and with predicted Ti (simplified Q). An example of continuous intracoronary thermodilution and the calculation of Q using both standard and simplified approaches in the same patient are shown in Figure 2.
Simplified Q exhibited a strong correlation with standard Q (r=0.94, CI: 0.93-0.95; p<0.001) as well as excellent absolute agreement (ICC 0.94, CI: 0.92-0.95; p<0.001) (Figure 3). Passing-Bablok regression analysis found no significant systematic (intercept A: 3.71, CI: −0.01 to 7.01) or proportional (slope B: 0.96, CI: 0.93-1.00) bias. Strong agreement was also seen with separate analyses for Qrest and Qhyper (Supplementary Figure 1, Supplementary Figure 2).
Strong correlations with excellent absolute agreement were also seen with Rμ (resting and hyperaemic), CFR and MRR (Supplementary Figure 3-Supplementary Figure 6).
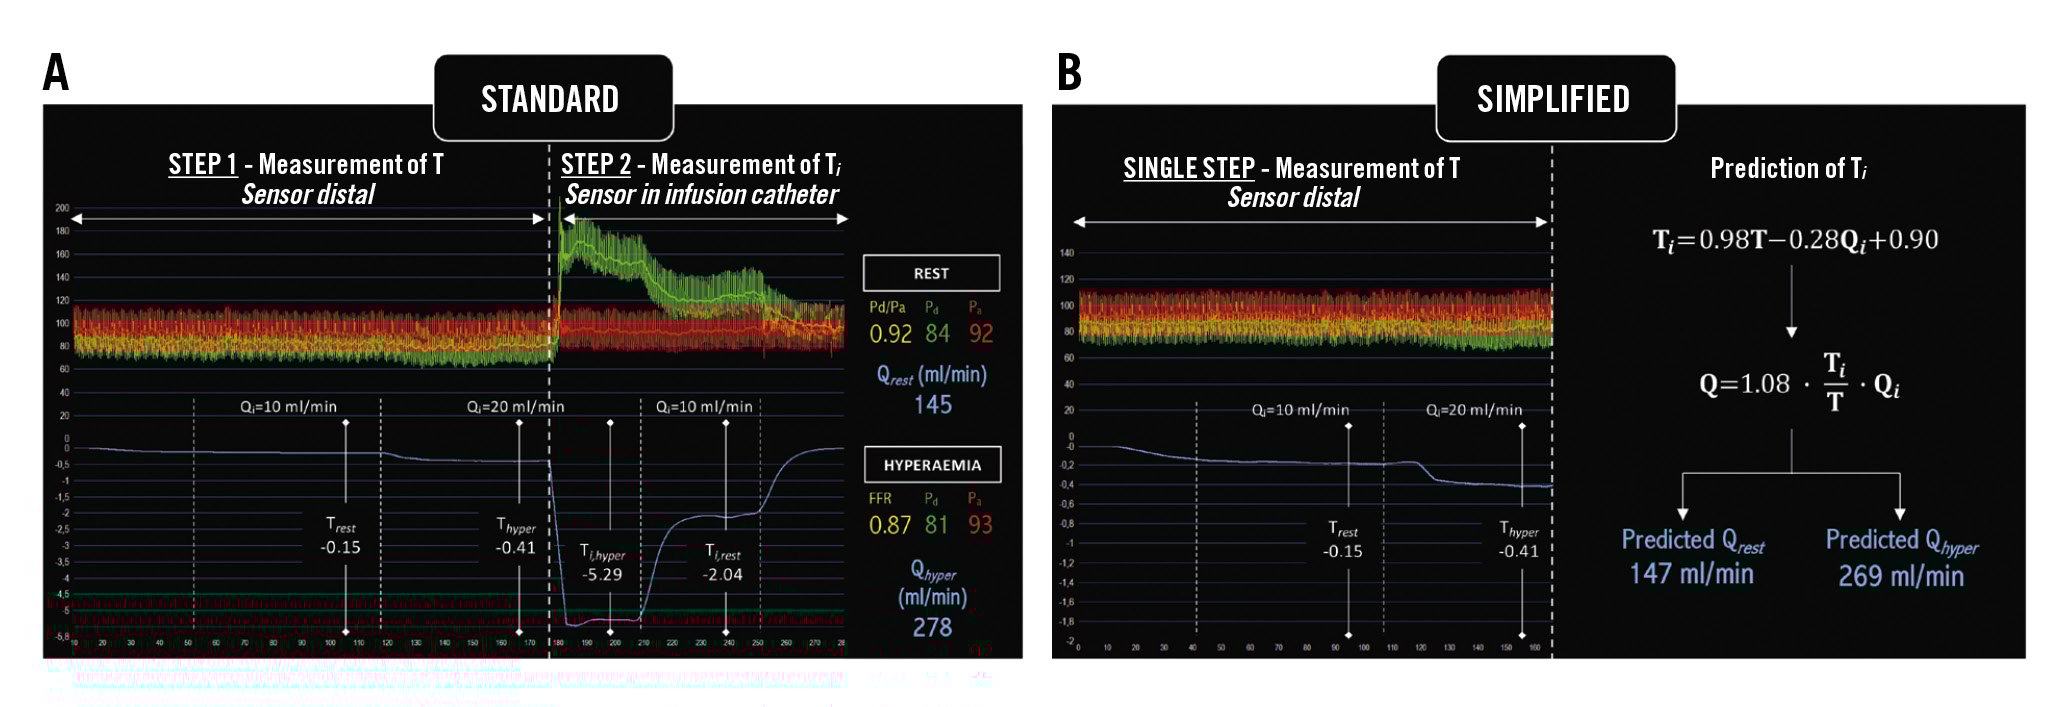
Figure 2. An example of continuous intracoronary thermodilution and the calculation of Q using the two approaches. A) Standard approach; (B) Simplified approach (prediction of Ti). FFR: fractional flow reserve; Pa: aortic pressure; Pd: distal coronary pressure; Pd/Pa: distal coronary-to-aorta pressure ratio; Q: absolute coronary flow; Qhyper: Q at hyperaemia; Qi: saline infusion rate; Qrest: Q at rest; Rµ: absolute microvascular resistance; T: temperature of mixed blood and saline; Thyper: T at hyperaemia; Ti: temperature of saline infusate before entering the bloodstream; Trest: T at rest
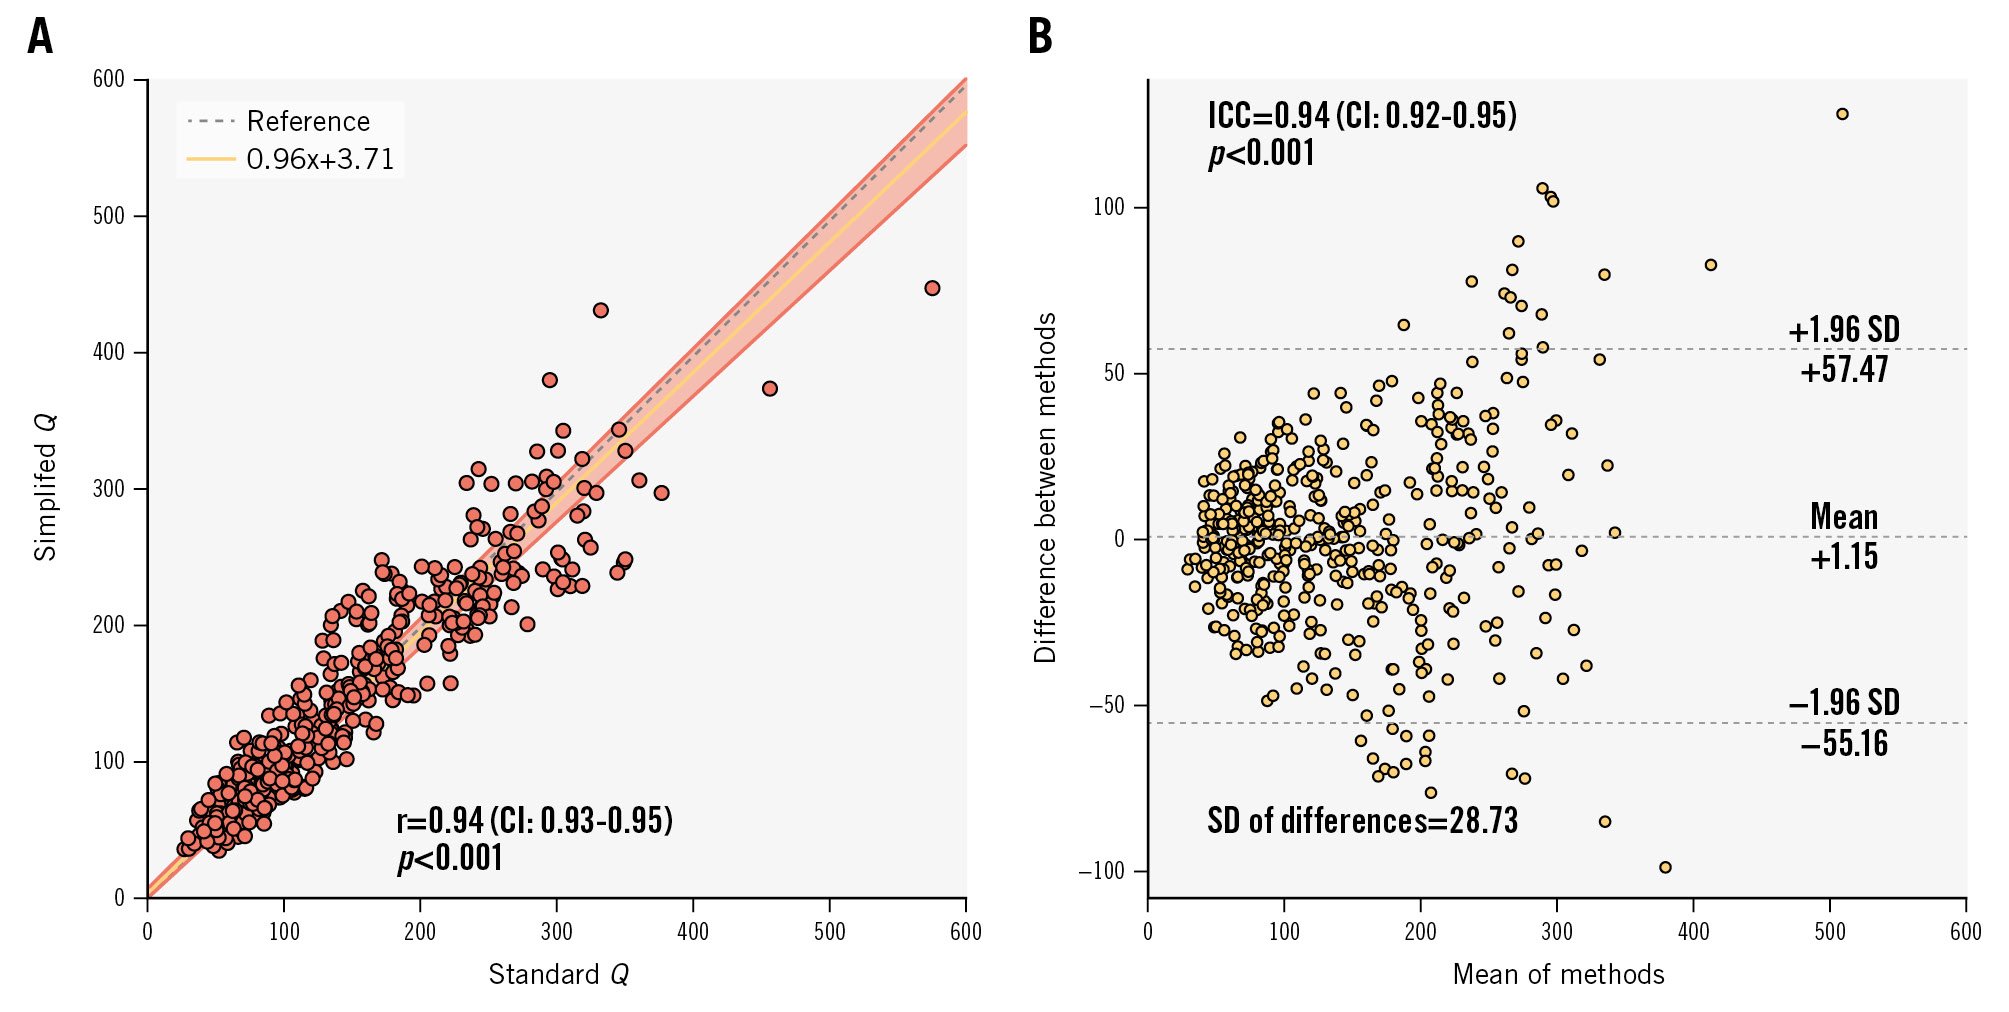
Figure 3. Agreement: correlation and absolute agreement between standard Q and simplified Q. A) Scatter plot of standard Q and simplified Q, and (B) Bland-Altman plot. CI: confidence interval; ICC: intraclass correlation coefficient; Q: absolute coronary flow; r: Pearson correlation coefficient; SD: standard deviation
III. ACCURACY: IMPACT OF PREDICTED Ti ON THE CORRELATION OF ABSOLUTE FLOW WITH [15O]H2O PET PERFUSION IMAGING
Validation cohort 2 (accuracy) contained 44 separate continuous intracoronary thermodilution measurements (LAD=23, LCx=21) obtained during hyperaemia (infusion rate of 20 ml/min or 15 ml/min, respectively, without a pharmacological agent) from 23 patients. For each artery, coronary flow was also calculated using [15O]H2O PET perfusion imaging adjusted by subtended myocardial mass.
In the PET cohort, standard Q exhibited a strong correlation with simplified Q (r=0.95, CI: 0.91-0.97; p<0.001) with excellent absolute agreement (ICC 0.95, CI: 0.90-0.97; p<0.001).
Standard Q exhibited a strong correlation with PET-derived Q (r=0.90, CI: 0.82-0.94; p<0.001) as well as excellent absolute agreement (ICC 0.89, CI: 0.81-0.94; p<0.001) (Figure 4A-B).
Similarly, the correlation between simplified Q and PET-derived Q remained strong with a negligible loss of accuracy (r=0.86, CI: 0.75-0.92; p<0.001) (Figure 4C), with no statistically significant difference between its correlation coefficient and that seen with the standard methodology (p=0.29). The absolute agreement remained high (ICC=0.84, CI: 0.72-0.91; p<0.001), with no statistically significant difference in SD (predicted Ti: SD 42.90 vs measured Ti: SD 36.49; F-test p=0.80) (Figure 4D).
There was no significant systematic (intercept A: 11.83, CI: −7.50 to 36.01) or proportional (slope B: 0.89, CI: 0.76-1.02) bias between PET-derived Q and standard Q. There was no significant systematic bias (intercept A: 18.01, CI: −2.90 to 36.70) between PET-derived Q and simplified Q, but a small proportional bias was present (slope B: 0.80, CI: 0.68-0.96).
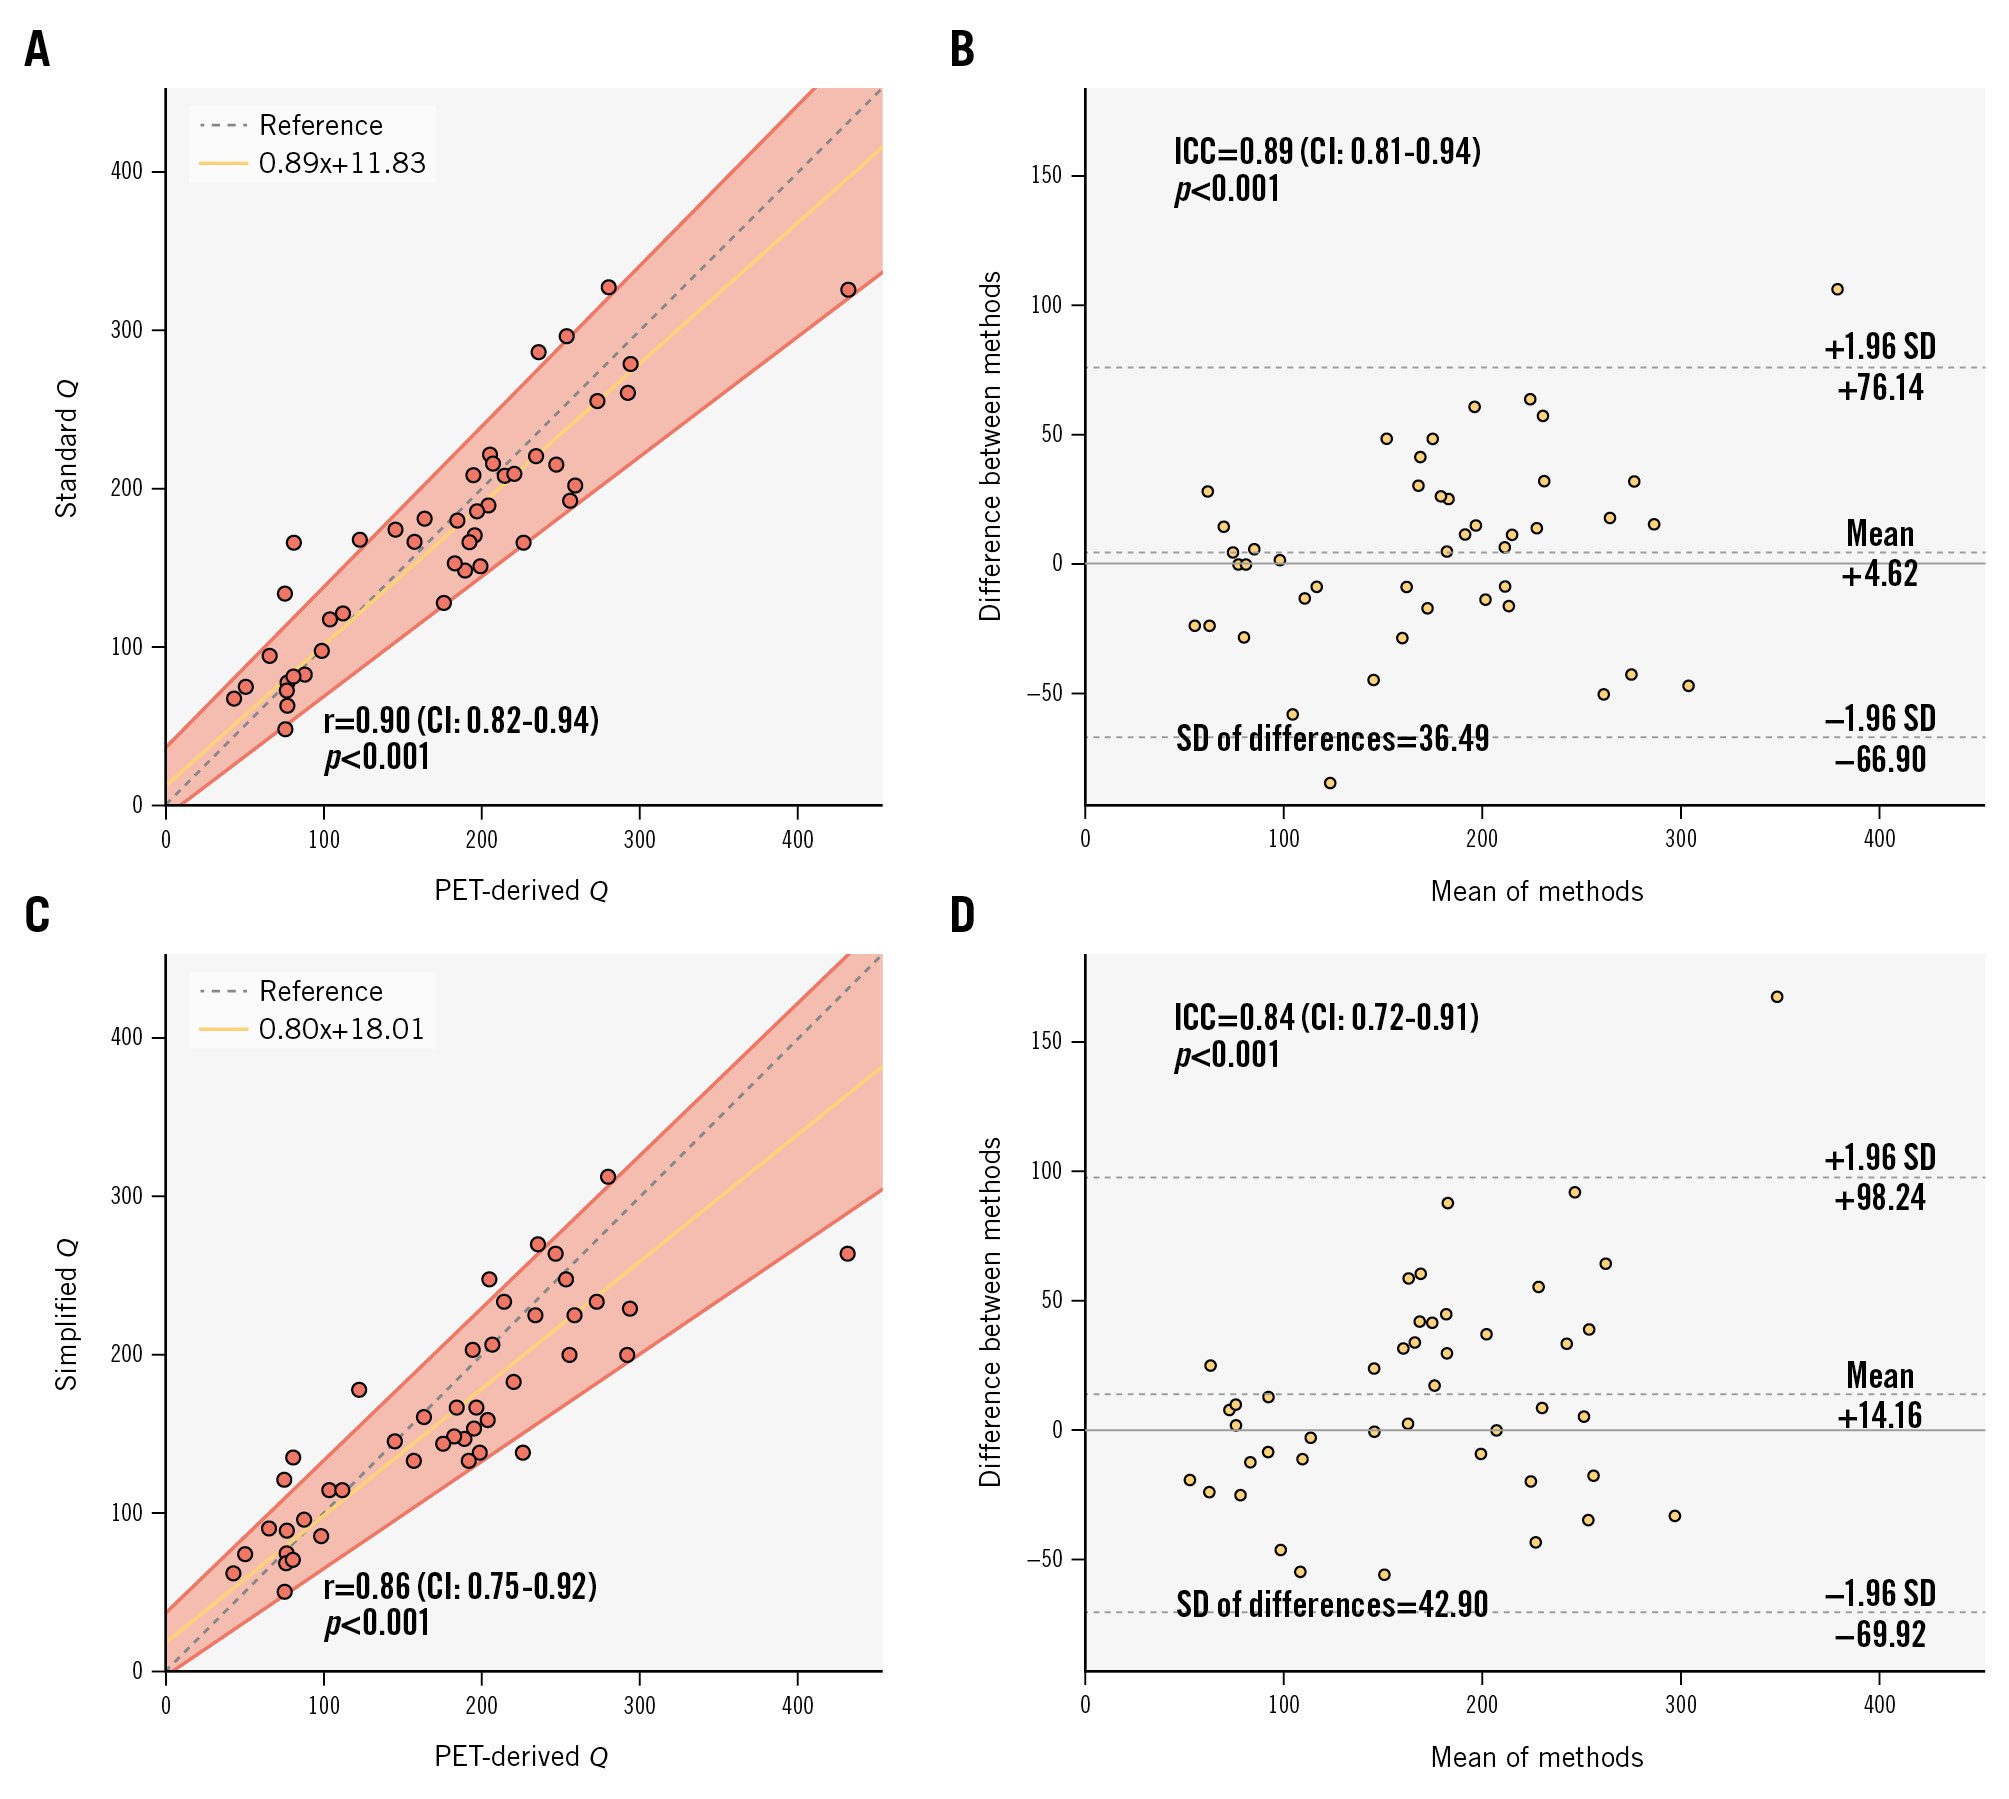
Figure 4. Accuracy: correlation and absolute agreement between [15O]H2O PET-derived Q and continuous thermodilution-derived Q. A, B) Correlation and agreement with measured Ti; (C, D) Correlation and agreement with predicted Ti. CI: confidence interval; ICC: intraclass correlation coefficient; PET: positron emission tomography; Q: absolute coronary flow; r: Pearson correlation coefficient; SD: standard deviation; Ti: temperature of saline infusate before entering the bloodstream
Discussion
We present a major simplification of the continuous intracoronary thermodilution technique that eliminates the requirement to measure Ti. This modification does not compromise accuracy significantly and markedly simplifies the practical aspects of the measurements, which can now be considered completely operator independent.
The principal findings of the study can be summarised as follows:
i. A multivariate linear regression model using just Qi and T as covariates is strongly predictive of Ti. Other covariates such as BMI, height and weight did not improve the model.
ii. Coronary indices (Q, Rμ, and CFR, MRR) calculated using predicted Ti demonstrated strong agreement with those calculated using measured Ti, as well as improved repeatability.
iii. The use of predicted Ti did not compromise the accuracy of Q as compared with the gold-standard modality, [15O]H2O PET.
CLINICAL IMPLICATIONS OF PROPOSED SIMPLIFICATION
Continuous intracoronary thermodilution is considered the gold-standard intracoronary technique for the measurement of coronary indices due to its excellent agreement with [15O]H2O PET imaging12 and excellent repeatability13, as compared with bolus thermodilution-derived indices212223. Yet, an ideal clinical test needs to be operator independent, i.e., its measurements are not influenced by the individual performing the test. Bolus thermodilution is operator dependent because of both inter- and intraoperator variability in injection technique. The issues with both its accuracy and precision described above may, in part, be explained by this operator dependence.
In contrast, our proposed simplification of continuous intracoronary thermodilution renders it straightforward to perform and completely operator independent. In practice, the operator is now only required to place the temperature sensor in the distal vessel and the dedicated infusion catheter in the proximal vessel. The infusion of saline at resting Qi is then initiated with the operator standing back while steady-state measurements are recorded. The infusion pump is then set to hyperaemic Qi, and new steady-state measurements are recorded. Crucially, no manipulation of intracoronary material is required between the start and end of testing.
In addition, our proposed simplification significantly shortens the overall procedure. The average length of the coronary thermodilution protocol is approximately 4 minutes and 30 seconds1316. The proposed simplification shortens the procedure by approximately 2 minutes through the elimination of Ti measurements for both resting and hyperaemic infusion rates. In addition, in cases where a manual switch of pump infusion rate is required, no rewiring of the vessel is required.
Of note, the use of predicted Ti was also associated with improved repeatability of all indices. Continuous intracoronary thermodilution is already recognised for its excellent repeatability compared with bolus coronary thermodilution1314. Whilst an improvement in repeatability is an added benefit of the simplification, it is also completely expected given that the use of Equation 6 eliminates the variability of measured Ti from the calculation of all indices.
CMD is increasingly recognised as a key cause of ANOCA. Patients with clear angina referred for ICA should ideally undergo an immediate assessment of microvascular function during the same exam. Yet, the reflex to test for CMD on finding no significant epicardial stenoses at ICA is far from widespread in cardiac catheterisation laboratories. Explanations for this include a lack of widespread knowledge of the condition and of diagnostic techniques such as continuous thermodilution, although this has increased in recent years. Another explanation is the additional cost related to this diagnostic adjunct, with the need for a pressure wire (if not already employed in the preceding angiography), a dedicated infusion catheter, and an infusion pump. Furthermore, the additional time requirement for setting up the apparatus and completing the procedure are likely barriers in some centres. With this in mind, the time saved and the reduction in complexity offered by the proposed simplification may improve the uptake of this technique.
Limitations
Firstly, despite utilising multiple clinical cohorts for the derivation and validation of the proposed simplification, the study sample sizes were relatively small, reflecting the relatively recent uptake of the continuous intracoronary thermodilution technique in clinical practice.
Secondly, although the simplification demonstrated excellent agreement with PET-derived Q, the PET cohort contained a limited number of potentially highly selected patients. In addition, patients in this cohort did not have values of Q measured in resting conditions. This relates to the fact that, at that time, thermodilution-derived resting flow measurements had not yet been validated15.
Thirdly, in theory, measurement of the saline temperature in the pump before starting the infusion would have been a valuable covariate to include in the multivariate linear regression model. Unfortunately, this information was not available, as it is not routinely collected. However, given the strong predictive power of the final model, any gains from this addition would be expected to be marginal, provided that saline at room temperature was used.
Finally, the length of infusion catheter in the bloodstream was not accounted for in the model. However, this length was not expected to vary significantly between patients and thus likely had a minimal impact on Ti.
Conclusions
Assessing volumetric coronary flow by continuous intracoronary thermodilution with predicted Ti instead of measured Ti does not compromise its accuracy when compared to [15O]H2O PET. It significantly simplifies the technique and renders absolute coronary flow measurements completely operator independent.
Impact on daily practice
We present a major simplification of the continuous intracoronary thermodilution technique that eliminates the requirement to measure the entry temperature of saline (Ti). Absolute coronary blood flow, calculated with this new approach, demonstrated excellent agreement with the standard approach as well as with positron emission tomography-derived measurements. This modification significantly shortens and simplifies the technique and renders absolute coronary flow measurements completely operator independent. Given the increasing awareness of angina with non-obstructive coronary arteries and its prognostic implications, the proposed simplification should facilitate a more widespread adoption of continuous intracoronary thermodilution in the evaluation of microvascular function.
Conflict of interest statement
T. Mahendiran is supported by a research grant from the Swiss National Science Foundation (SNSF). P. Damman received research grants from Abbott, Philips, and AstraZeneca; and consultancy fees from Philips. A. Wilgenhof, M. Viscusi, D. Bertolone, and M. Belmonte report receiving research grants provided by the Cardiopath PhD programme. N.H.J. Pijls received institutional research grants from Abbott; has consulting relationships with and receives fees from Abbott and Coroventis; has equity in ASML, GE HealthCare, HeartFlow, and Philips; is a member of the Scientific Advisory Board (SAB) of HeartFlow; and has patents pending in the field of the coronary microcirculation and aortic valve stenosis. C. Collet reports receiving research grants from Biosensors, Coroventis Research, Medis Medical Imaging, Pie Medical Imaging, CathWorks, Boston Scientific, Siemens, HeartFlow Inc, and Abbott; and consultancy fees from HeartFlow Inc, OpSens, Abbott, and Philips/Volcano. B. De Bruyne reports receiving consultancy fees from Boston Scientific and Abbott; research grants from Coroventis Research, Pie Medical Imaging, CathWorks, Boston Scientific, Siemens, HeartFlow Inc, and Abbott; and owning equity in Siemens, GE HealthCare, Philips, HeartFlow Inc, Edwards Lifesciences, Bayer, Sanofi, and Celyad. The other authors have no conflicts of interest to declare.
Supplementary data
To read the full content of this article, please download the PDF.