In the last decade, the management of tricuspid regurgitation (TR) has significantly changed owing to the emergence of novel interventional treatment approaches that have allowed safe and effective treatment of TR. While retrospective studies suggested a survival benefit of interventional TR treatment as compared to patients treated conservatively12, the first randomised clinical trial that compared tricuspid transcatheter edge-to-edge repair (T-TEER) to optimal medical treatment, the TRILUMINATE Pivotal Trial, showed no differences at 1 year with regards to mortality or heart failure hospitalisation, albeit meeting its primary endpoint3. A possible explanation for this discrepancy might be attributable to a change in the characteristics of patients who are referred for T-TEER therapy nowadays, as compared to initial treatment experiences. Therefore, the aim of this study was to evaluate changes in the characteristics of patients referred for T-TEER and investigate their influence on outcomes.
Patients from the European Registry of Transcatheter Repair for Tricuspid Regurgitation (EuroTR) who underwent interventional therapy for symptomatic TR from 2016 until 2022 at 12 European study sites (Germany, Italy, Switzerland, Spain, France, and Sweden) were included, and a complete list of investigators can be found in Supplementary Appendix 1. T-TEER was performed using either the PASCAL device (Edwards Lifesciences) or the MitraClip/TriClip system (Abbott).
Data are given as median and corresponding interquartile range (IQR). Continuous variables were compared with the Kruskal-Wallis test. Categorical variables were compared using Fisher’s exact test. Kaplan-Meier analyses were used to compare the survival in different subgroups; the log-rank test was used to test for differences. Patients were split into 3 time periods: (a) 2016 to 2018, (b) 2019 to 2020, and (c) 2021 to 2022.
The analysis comprised 1,031 patients, of whom 157 (15%) underwent T-TEER between 2016 and 2018, 386 (37%) between 2019 and 2020, and 488 (47%) between 2021 and 2022 (Table 1). The rate of atrial fibrillation and/or flutter increased over time (p=0.017). Patients treated in the earlier time periods of T-TEER were younger (p<0.001), more symptomatic with a worse New York Heart Association Class (p=0.010), had higher rates of pleural effusion (p=0.028), and more ascites (p=0.081). The TRI-SCORE was lower in patients treated at later time periods (p=0.019). Biomarkers of organ function showed that renal function was comparable over different time periods, while markers of impaired liver function and congestion, as well as N-terminal pro-brain natriuretic peptide levels, were worse among patients treated in the earlier time periods.
All patients demonstrated at least moderate functional TR on echocardiography (Central illustration), and TR severity increased over the specified time periods. In the later time periods, TR effective regurgitant orifice area (p<0.001), regurgitant volume (p<0.001), and vena contracta (p<0.001) were higher, while right ventricular and tricuspid annulus dimension parameters were smaller (p<0.001). The size of the coaptation gap increased in patients treated at later timepoints (p<0.001), but interestingly markers of tricuspid leaflet displacement, like tenting height and area, were smaller in these patients (p<0.001 for both). In line with this, the incidence of atrial TR, as previously defined4, increased over the included time periods.
The intraprocedural success rates of the procedures (50% MitraClip/TriClip, 50% PASCAL), according to the Tricuspid Valve Academic Research Consortium criteria5, did not significantly differ between the time periods (a: 82% vs b: 83% vs c: 85%; p=0.36). Patients treated in the earliest period had a higher mean number of devices (2.1±0.7) compared to those treated in 2019 to 2020 (1.8±0.6) and 2021 to 2022 (1.9±0.7) (p<0.001).
During the 1-year follow-up (median follow-up 308 [IQR 126 to 365] days), 149 patients (15%) died. Mortality significantly decreased over time and was highest in patients treated between 2016 and 2018 (Kaplan-Meier curve estimated 1-year mortality 29%). Outcomes were comparable for patients treated from 2019 to 2020 and 2021 to 2022 (Kaplan-Meier curve estimated 1-year mortality of 15% and 19%, respectively; log-rank p=0.001) (Central illustration).
This is the first study that has investigated changes in the baseline characteristics of patients undergoing T-TEER in over 1,000 patients since the establishment of the treatment in 2016 until 2022. The main findings of the study were that there has been a significant shift in the baseline characteristics of patients undergoing T-TEER, with patients presenting with fewer symptoms and less systemic involvement in recent years. Despite this, TR severity has increased over time, but 1-year mortality rates have decreased.
TR has been considered to be associated with an adverse prognosis, with high 1-year mortality rates ranging from 10-20%, in T-TEER patients126. This was put into question by one of the lowest ever reported 1-year mortality rates for TR in the TRILUMINATE Pivotal study of 9.4%. Our study also observed a decrease in mortality from 29% to 15-19% over time, despite increased TR severity. This improvement might be attributable to greater awareness of and earlier intervention for TR. Further technological advances have successfully pushed the boundaries for the treatment of more severe TR. The shift from a ventricular to an atrial phenotype of TR over time, which is indicated by more severe TR with concomitant decreases in tethering area and height, might also have contributed to better outcomes46.
In summary, T-TEER patient profiles have shifted over time from a ventricular TR phenotype with high systemic disease burden to an atrial TR phenotype with higher TR severity but fewer systemic issues and possibly earlier disease stage. This shift should be considered in clinical trials, as decreasing 1-year mortality rates in recent TR cohorts could impact the statistical power needed to show treatment differences in clinical endpoints.
Table 1. Baseline characteristics.
| Variables | Overall n=1,031 | 2016 to 2018 n=157 | 2019 to 2020 n=386 | 2021 to 2022 n=488 | p-value |
|---|---|---|---|---|---|
| Age, years | 80 (76, 83) | 78 (75, 82) | 79 (75, 82) | 81 (77, 83) | <0.001 |
| Female sex | 533 (52) | 80 (51) | 193 (50) | 260 (53) | 0.6 |
| BMI, kg/m2 | 26 (23, 29)(n=1,020) | 25 (23, 28) | 26 (23, 29)(n=381) | 26 (23, 29)(n=482) | 0.6 |
| Signs & symptoms | |||||
| NYHA Class | 0.010 | ||||
| II | 134 (13) | 19 (12) | 48 (12) | 67 (14) | |
| III | 753 (73) | 102 (65) | 290 (75) | 361 (74) | |
| IV | 142 (14)(n=1,029) | 36 (23) | 48 (12) | 58 (12)(n=486) | |
| Ascites | 152 (15)(n=1,025) | 31 (20) | 60 (16)(n=385) | 61 (13)(n=483) | 0.081 |
| Pleural effusion | 234 (28)(n=844) | 56 (36) | 81 (24)(n=336) | 97 (28)(n=345) | 0.028 |
| Risk scores | |||||
| EuroSCORE II, % | 4.8 (2.8, 8.1)(n=1,024) | 4.8 (3.3, 7.9)(n=156) | 4.6 (2.7, 8.4) | 4.9 (2.7, 7.7)(n=482) | 0.6 |
| TRI-SCORE, points | 6.0 (4.0, 7.0)(n=616) | 6.0 (5.0, 7.0)(n=123) | 6.0 (4.0, 7.0)(n=240) | 5.0 (4.0, 7.0)(n=253) | 0.019 |
| Past medical history | |||||
| Chronic dialysis | 41 (4.9)(n=845) | 11 (7.0) | 12 (3.6)(n=336) | 18 (5.1)(n=352) | 0.2 |
| Diabetes | 233 (28)(n=845) | 45 (29) | 97 (29)(n=336) | 91 (26)(n=352) | 0.6 |
| Previous cardiac surgery | 337 (33)(n=1,027) | 53 (34) | 131 (34)(n=385) | 153 (32)(n=485) | 0.7 |
| Previous tricuspid valve surgery | 7 (1.2)(n=576) | 1 (1.2)(n=81) | 4 (2.3)(n=173) | 2 (0.6)(n=322) | 0.2 |
| Transtricuspid lead | 299 (29) | 42 (27) | 123 (32) | 134 (27) | 0.3 |
| Atrial fibrillation or flutter | 917 (89)(n=1,029) | 134 (85) | 335 (87)(n=385) | 448 (92)(n=487) | 0.017 |
| Lab charts | |||||
| Estimated glomerular filtration rate, ml/min/1.73 m² |
45 (33, 58)(n=1,027) | 45 (32, 60)(n=156) | 43 (33, 58)(n=384) | 45 (32, 58)(n=487) | 0.7 |
| Bilirubin, mg/dl | 0.83 (0.60, 1.29)(n=830) | 0.99 (0.63, 1.30)(n=139) | 0.80 (0.59, 1.20)(n=296) | 0.80 (0.60, 1.33)(n=395) | 0.079 |
| AST, U/l | 27 (22, 34)(n=954) | 29 (24, 37)(n=153) | 27 (23, 35)(n=369) | 26 (20, 33)(n=432) | <0.001 |
| ALT, U/l | 18 (13, 25)(n=879) | 19 (15, 26)(n=148) | 19 (14, 25)(n=327) | 17 (11, 23)(n=404) | <0.001 |
| GGT, U/l | 95 (50, 189)(n=875) | 98 (67, 196)(n=143) | 104 (55, 194)(n=347) | 88 (44, 179)(n=385) | 0.014 |
| NT-proBNP, pg/ml | 2,268 (1,247, 4,606)(n=971) | 3,038 (1,471, 6,258)(n=145) | 2,082 (1,213, 4,553)(n=371) | 2,350 (1,231, 4,085)(n=455) | 0.008 |
| Echocardiography | |||||
| LVEF, % | 55 (47, 60)(n=979) | 56 (46, 63) | 55 (47, 60)(n=379) | 55 (48, 60)(n=443) | 0.5 |
| TR EROA, cm2 | 0.54 (0.40, 0.75)(n=888) | 0.50 (0.40, 0.70)(n=156) | 0.50 (0.40, 0.70)(n=342) | 0.59 (0.41, 0.80)(n= 390) | <0.001 |
| TR regurgitant volume, ml | 45 (35, 59)(n=847) | 42 (32, 54)(n=154) | 42 (33, 54)(n=325) | 49 (38, 66)(n=368) | <0.001 |
| TR vena contracta, mm | 10.0 (8.0, 14.0)(n=939) | 9.0 (8.0, 12.0) | 10.0 (7.9, 12.0)(n=371) | 11.0 (8.0, 14.0)(n=411) | <0.001 |
| RV mid-ventricular diameter, mm | 41 (36, 47)(n=810) | 42 (37, 47)(n=149) | 43 (37, 49)(n=295) | 39 (33, 45)(n=366) | <0.001 |
| TV annular diameter, mm | 44 (39, 50)(n=912) | 46 (43, 51)(n=153) | 46 (41, 51)(n=340) | 42 (37, 48)(n=419) | <0.001 |
| TAPSE, mm | 17.0 (14.0, 20.0)(n=967) | 16.0 (13.0, 21.0) | 17.0 (14.0, 20.0)(n=374) | 17.0 (14.0, 20.0)(n=436) | 0.15 |
| Estimated pulmonary artery pressure, mmHg | 41 (33, 51)(n=958) | 45 (34, 54) | 41 (34, 52)(n=376) | 41 (32, 49)(n=425) | 0.013 |
| TAPSE/sPAP, mm/mmHg | 0.41 (0.31, 0.52)(n=937) | 0.39 (0.29, 0.47) | 0.40 (0.30, 0.50)(n=367) | 0.43 (0.32, 0.56)(n=413) | 0.002 |
| Coaptation gap, mm | 6.0 (4.0, 8.0)(n=692) | 5.0 (4.0, 7.0)(n=140) | 6.2 (4.5, 8.5)(n=252) | 5.3 (4.0, 7.0)(n=300) | <0.001 |
| TV tenting height, mm | 7.0 (6.0, 10.0)(n=522) | 9.0 (7.0, 11.9)(n=94) | 7.0 (5.0, 9.0)(n=182) | 7.0 (5.8, 9.0)(n=246) | <0.001 |
| TV tenting area, cm² | 1.70 (1.20, 2.40)(n=472) | 2.00 (1.30, 2.86)(n=93) | 1.60 (1.15, 2.14)(n=156) | 1.72 (1.26, 2.52)(n=223) | 0.015 |
| Atrial TR | 445 (47)(n=942) | 62 (40)(n=157) | 167 (45)(n=369) | 216 (52)(n=416) | 0.018 |
| Data are given as median (IQR) or n (%). In case of missing variables, the number of patients with available data is given in parentheses. ALT: alanine transaminase; AST: aspartate aminotransferase; BMI: body mass index; EROA: effective regurgitant orifice area; EuroSCORE: European System for Cardiac Operative Risk Evaluation; GGT: gamma-glutamyl tranferase; IQR: interquartile range; LVEF: left ventricular ejection fraction; NT-proBNP: N-terminal pro-brain natriuretic peptide; NYHA: New York Heart Association; RV: right ventricular; sPAP: systolic pulmonary artery pressure; TAPSE: tricuspid annular plane systolic excursion; TR: tricuspid regurgitation; TV: tricuspid valve | |||||
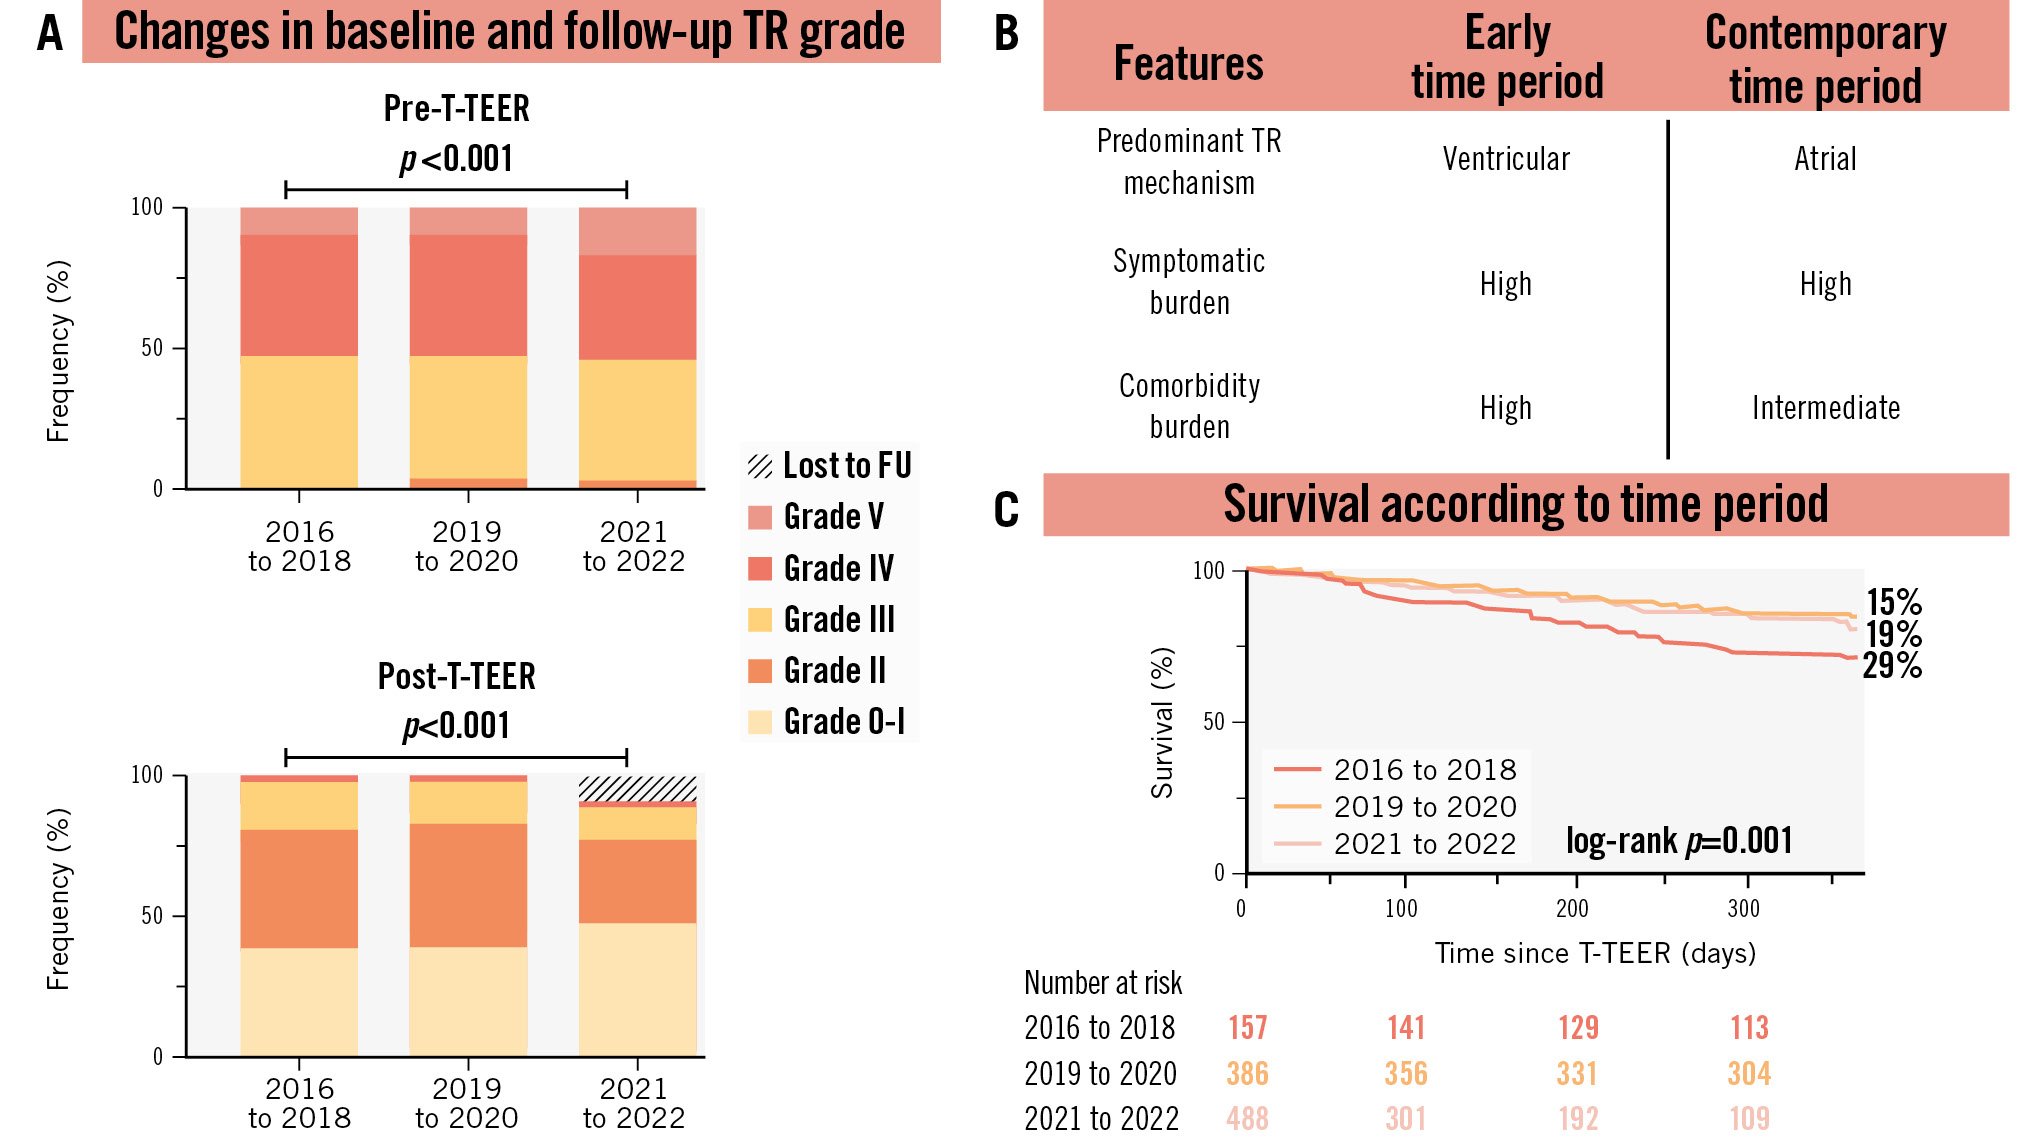
Central illustration. Temporal trends in characteristics of patients undergoing tricuspid transcatheter edge-to-edge repair for tricuspid regurgitation. A) Changes in tricuspid regurgitation grades according to the timepoint of treatment, where pre-T-TEER refers to TR grades immediately before T-TEER, and post-T-TEER refers to TR grades after T-TEER. Kruskal-Wallis test for pre- and postprocedural TR grade: p<0.001 and p=0.001, respectively. B) Comparison of TR features between early and contemporary time periods. C) Changes in survival rates according to the timepoint of treatment. FU: follow-up; TR: tricuspid regurgitation; T-TEER: tricuspid transcatheter edge-to-edge repair
Conflict of interest statement
K.-P. Kresoja reports travel expenses from Edwards Lifesciences. L. Stolz received speaker honoraria from Edwards Lifesciences. W. Rottbauer received speaker honoraria from Edwards Lifesciences and Abbott. P. Denti served as a consultant for InnovHeart, Pi-Cardia, HVR Cardio, and Approxima; and received speaker honoraria from Abbott and Edwards Lifesciences. T. Rassaf received speaker honoraria and consulting fees from AstraZeneca, Bayer, Pfizer, and Daiichi Sankyo. M. Barreiro-Perez received speaker fees from Abbott, Edwards Lifesciences, and Venus Medtech. M. Adamo has received consulting fees in the last three years from Abbott and Edwards Lifesciences. R.-S. von Bardeleben has received institutional grants and served as speaker to Abbott and Edwards Lifesciences. S. Toggweiler has received personal honoraria from Medtronic, Boston Scientific, Biosensors, Abbott, Medira, Shockwave Medical, Teleflex, atHeart Medical, Cardiac Dimensions, Polares Medical, Amarin, Sanofi, AstraZeneca, ReCor Medical, and Daiichi Sankyo; has received institutional research grants from Edwards Lifesciences, Boston Scientific, Fumedica, Novartis, and Boehringer Ingelheim; and holds equity in Hi-D Imaging. M. Metra has received consulting fees in the last three years from Abbott, AstraZeneca, Bayer, Boehringer Ingelheim, Edwards Lifesciences, and Roche Diagnostics. T. Geisler received speaker honoraria/research grants from AstraZeneca, Bayer, Bristol-Myers Squibb/Pfizer, Ferrer/Chiesi, Medtronic, and Edwards Lifesciences, but none of these were related to this study. R. Estévez-Loureiro received speaker fees from Abbott, Edwards Lifesciences, Boston Scientific, and Venus Medtech. P. Luedike received speaker honoraria and consulting fees from AstraZeneca, Bayer, Pfizer, and Edwards Lifesciences; and research honoraria from Edwards Lifesciences. F. Maisano received grant and/or research institutional support from Abbott, Medtronic, Edwards Lifesciences, Biotronik, Boston Scientific, NVT, Terumo, and Venus Medtech; consulting fees, honoraria personal and institutional from Abbott, Medtronic, Edwards Lifesciences, Xeltis, Cardiovalve, Occlufit, Simulands, Mtex, Venus Medtech, Squadra, and Valgen; royalty income/IP rights from Edwards Lifesciences; and is a shareholder (including share options) of Magenta, Transseptal Solutions, and 4Tech. F. Praz received travel expenses from Edwards Lifesciences, Abbott, Polares Medical, Medira, and Siemens Healthineers. M. Kessler received speaker honoraria from Edwards Lifesciences and Abbott. D. Kalbacher has received personal fees from Abbott, Edwards Lifesciences, and Pi-Cardia. V. Rudolph received research grants from Abbott, Boston Scientific, and Edwards Lifesciences. C. Iliadis received consultant fees and travel expenses from Abbott and Edwards Lifesciences. J. Hausleiter reports research grant support and speaker honoraria from Edwards Lifesciences. P. Lurz received institutional grants from Edwards Lifesciences and honoraria from Innoventric. The other authors have no relevant conflicts of interest to declare.
Supplementary data
To read the full content of this article, please download the PDF.