Cory:
Unlock Your AI Assistant Now!
Abstract
Background: Quantifying hypoattenuating leaflet thickening (HALT) on computed tomography angiography (CTA) may provide insights into its clinical implications and guide decisions on oral anticoagulation therapy following transcatheter aortic valve implantation (TAVI).
Aims: We sought to assess the association between quantitative CTA features of HALT and its evolution over time in a real-world cohort after TAVI.
Methods: Among 612 patients who underwent CTA 30 days post-TAVI with balloon-expandable bioprostheses, HALT was detected in 118 (19%). We prospectively followed 99 patients who had undergone a second CTA at 1 year to assess HALT progression. Thrombus volume and mean attenuation were quantified using semiautomated software, and various parameters of bioprosthetic deformation were analysed.
Results: Complete resolution of HALT was observed in 43 patients. Multivariate logistic regression showed that lower thrombus attenuation was an independent predictor of HALT resolution (odds ratio [OR] 0.45; p=0.030), along with the eccentricity index (OR 0.42; p=0.003), deformation index (OR 0.53; p=0.005), and implant canting (OR 1.88; p=0.026). In the 56 patients without complete HALT resolution, thrombus evolution was visually categorised as regression (48%), stability (29%), or progression (23%). In a quantitative assessment, regression was associated with a significant decrease in thrombus volume (291 mm³ to 130 mm³; p=0.007), while progression showed an increase (187 mm³ to 667 mm³; p=0.005). The change in thrombus volume between 30 days and 1 year correlated with the magnitude of changes in mean transvalvular gradients over the same period (r=0.462; p<0.001).
Conclusions: Quantitative thrombus characterisation on CTA is predictive of HALT resolution and correlates with the haemodynamic performance of transcatheter aortic valves.
Subclinical leaflet thrombosis after transcatheter aortic valve implantation (TAVI) occurs in up to 25% of patients1234. Thrombus on the surface of the bioprosthetic leaflet is observed on computed tomography (CT) angiography (CTA) as hypoattenuating leaflet thickening (HALT), with or without reduced leaflet motion, as early as in the first postprocedural days56. HALT is characterised by diverse temporal dynamics, and its clinical significance is not fully understood, with most detected HALT being subclinical78. The presence of HALT may, however, increase the risk of major adverse cardiovascular and cerebrovascular events and may progress to clinical valve thrombosis291011. HALT has also been associated with a slight increase in transvalvular gradients, while its long-term impact on the durability of bioprostheses is yet to be determined112. Due to these uncertainties, there are no guidelines for managing subclinical leaflet thrombosis13. Previous studies have demonstrated that oral anticoagulation is an effective treatment for HALT, leading to its regression in most cases14. Nevertheless, complete thrombus regression without any intervention has also been evidenced1. Current evidence suggests that non-uniform expansion of transcatheter heart valves contributes to HALT development and may influence its evolution151617. Quantitative HALT characterisation could provide insight into its clinical sequelae as well as its potential progression. Importantly, this could aid challenging clinical decisions regarding oral anticoagulation therapy. Several studies have investigated the history of HALT in transcatheter and surgical cohorts, but there is a limited understanding of the imaging features associated with thrombus evolution over time178. Thus, we sought to examine the association between quantitative HALT features from CTA and its evolution in a real-life population.
Methods
Patient cohort
This analysis is based on a prospective observational study conducted at Cedars-Sinai Medical Center. It included patients from the Assessment of TRanscathetEr and Surgical Aortic BiOprosthetic Valve Thrombosis and Its TrEatment With Anticoagulation registry (RESOLVE; ClinicalTrials.gov: NCT02318342) who had undergone TAVI using balloon-expandable prosthetic valves between February 2015 and March 2018, with HALT detected on CTA 30 days post-TAVI, and who completed follow-up CTA 1 year after the procedure (Central illustration). The registry did not consecutively enrol patients treated with TAVI but aimed to include a heterogeneous patient population. Patients with impaired renal function (estimated glomerular filtration rate of <30 mL/min) were excluded from the registry. The institutional review board approved the registry before the study initiation. All patients provided written informed consent.
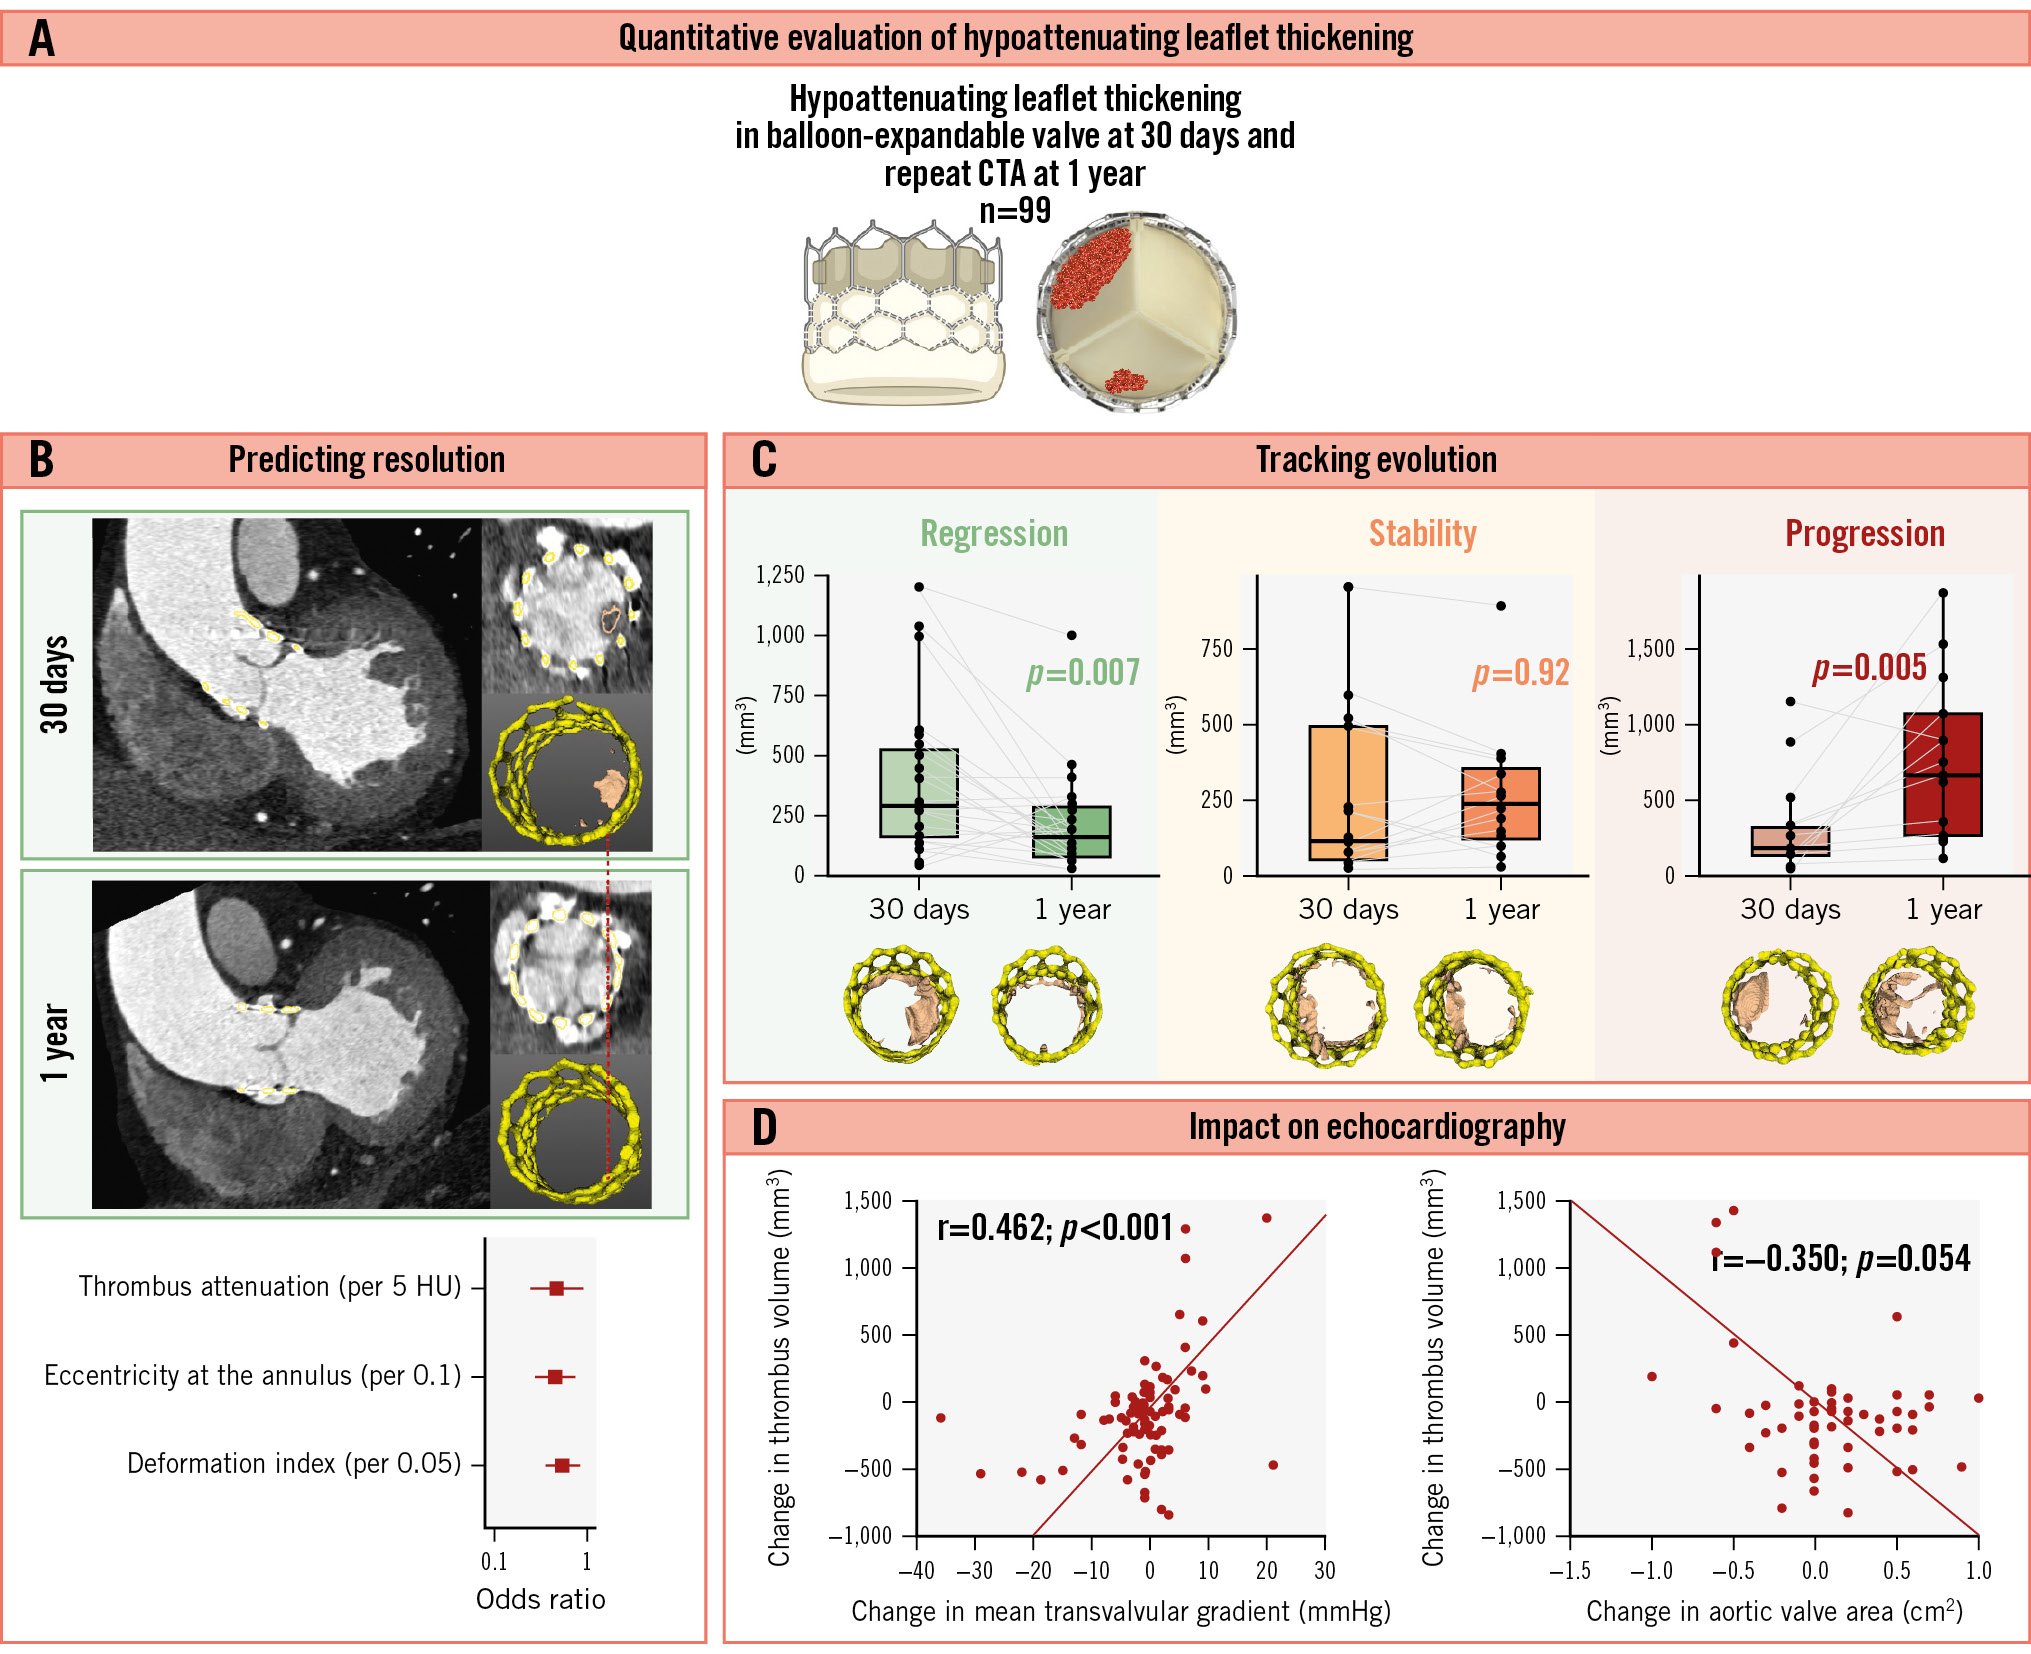
Central illustration. Temporal changes in hypoattenuating leaflet thickening after TAVI. Quantitative thrombus characterisation on computed tomography angiography (CTA) predicts the HALT resolution and correlates with the haemodynamic performance of transcatheter aortic valves. A) Quantitative evaluation of HALT; (B) predicting HALT resolution; (C) tracking the evolution of HALT; (D) impact of HALT on echocardiographic parameters. HALT: hypoattenuating leaflet thickening; HU: Hounsfield units; TAVI: transcatheter aortic valve implantation
Transcatheter aortic valve IMPLANTATION
A multidisciplinary Heart Team at Cedars-Sinai Medical Center discussed the indication for TAVI. Procedural details, including proper device selection and access site, were determined based on preoperative CT imaging and echocardiography. TAVI procedures were conducted under general anaesthesia with fluoroscopic and echocardiographic guidance. Balloon-expandable prostheses, SAPIEN XT and SAPIEN 3 (both Edwards Lifesciences) were used for all TAVI procedures.
CT imaging and evaluation
A detailed description of the contrast-enhanced multidetector CTA image acquisition is provided in Supplementary Appendix 1. Visually identified HALT is the hallmark of subclinical leaflet thrombosis. The hypoattenuating lesions involve the periphery and base of the leaflet and extend to varying degrees towards the edges of the leaflet in the centre of the bioprosthetic frame. If HALT was identified, a careful assessment of leaflet motion was conducted using four-dimensional (4D) CT imaging. Motion reduction of each leaflet was evaluated using multiphase volume-rendered en face cine projection18. Hypoattenuation affecting motion (HAM) was defined as >50% reduction in leaflet motion relative to the radius of the bioprosthetic frame.
Quantitative analysis of HALT was performed using semiautomated software (ValveQuant module, Autoplaque version 2.5 [Cedars-Sinai Medical Center])1920. The region of interest was manually defined from the base to the top of the bioprosthetic aortic valve. Then, serial multiplanar reformatted images orthogonal to the longitudinal axis of the ascending aorta were rendered to obtain cross-sectional images of the respective region with contouring – comprising 15-20 adjustable points within the inner margin of the stent frame. Leaflet thrombus was defined as voxels between −200 Hounsfield units (HU) and 200 HU within the inner margin of the bioprosthetic frame1821. The quantitative thrombus parameters were volume (expressed in mm3) and mean attenuation (expressed in HU).
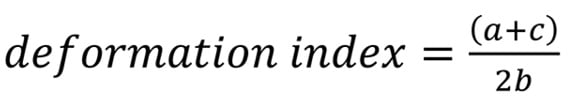
For post-implantation evaluation of bioprosthesis geometry, internal and external stent-frame measurements, including the area, major diameter, and minor diameter, were taken at four levels of the prosthesis: the leaflet outflow (corresponding to the three commissural tabs of the prosthetic leaflets, denoted as “a” in the equation below), the prosthesis waist (located at 1/3 of the first cell for SAPIEN XT and at the tip of the outer skirt for SAPIEN 3, “b”), the leaflet inflow (at the nadir of the prosthetic leaflets, “c”), and the native annulus. The postprocedural native annulus level was determined using the preprocedural distance from the annular plane to the sinotubular junction, measured from the pre-TAVI CTA scans. The prosthesis deformation index was then calculated using the internal area measurements at each level, using the following equation15: Formule_01
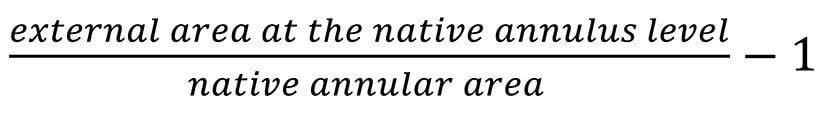
Oversizing at the native annulus level was calculated as follows: Formule_02
Expansion was measured at the four levels: Formule_03
The nominal SAPIEN XT prosthetic valve areas used in the calculations were 415 mm2, 531 mm2, and 660 mm2 for 23 mm, 26 mm, and 29 mm devices, respectively. The nominal SAPIEN 3 prosthetic valve areas used in the calculations were 409 mm2, 519 mm2, and 649 mm2 for 23 mm, 26 mm, and 29 mm devices, respectively22.
Eccentricity was measured at the four levels with the formula: Formule_04
Eccentricity ranges from 0 to 1, with higher values indicating a more oval shape, while lower values (closer to 0) represent a more circular configuration.
The expansion of each prosthetic leaflet was assessed by measuring the angle between the border stent struts of each leaflet and the transcatheter heart valve (THV) centre point at the coaptation level. Ideally, full leaflet expansion corresponds to 120°, based on the design intent for the frame to expand into a uniform, circular shape with three symmetrical leaflets of equal size and shape. Asymmetric leaflet expansion was determined by summing the difference between 120° and the actual measured angle of each leaflet17.
The distance between the inflow edge of the THV prosthesis and the basal plane at the centre of each cusp was recorded and averaged to measure implant depth. The degree of canting was determined by calculating the difference between the maximum and minimum implant depths23.
Commissure alignment was considered misaligned if the coronary ostium was positioned below the inner skirt or directly in front of one of the three bioprosthetic commissural tabs24.
All tomographic analyses were performed at the Cedars-Sinai Medical Center core laboratory (Los Angeles, CA, USA) by two readers (K. Grodecki and J. Geers, with 7 and 5 years of experience in cardiovascular CT, respectively) blinded to echocardiographic and clinical data. A third observer (H. Jilaihawi) adjudicated any disagreements.
Formule_01.
Formule_02.

Formule_03.

Formule_04.
Outcomes and definitions
The primary outcome was HALT resolution – defined as the visually evaluated absence of any hypoattenuating material on the bioprosthetic leaflet. The secondary outcome, in patients without complete resolution of HALT, was its evolution, visually defined as regression (significant reduction of hypoattenuating material and/or resolution of reduced leaflet motion), progression (significant increase in hypoattenuating material and/or hypoattenuating material on the new leaflet and/or new presence of reduced leaflet motion) or stability (no regression or progression). Haemodynamic valve deterioration was classified as moderate or severe according to the Valve Academic Research Consortium-3 definitions25.
Antithrombotic therapy was categorised into oral anticoagulation – comprising both vitamin K antagonists and non-vitamin K antagonists – and compared with no anticoagulation (antiplatelet therapy or no therapy). In patients with HALT, adjustments to antithrombotic therapy were considered if there was an increase in transvalvular pressure gradients and/or the patient experienced significant symptoms.
Statistical analysis
Categorical patient characteristics are presented as absolute numbers with percentages and were compared between groups of patients with and without HALT resolution using a chi-squared test. Data were tested for normality using the Shapiro-Wilk test. Continuous data are expressed as means±standard deviations (SD) or medians with interquartile ranges (IQR), depending on the distribution, and, for patient characteristics, were compared with the Student’s t-test or the Wilcoxon rank-sum test, as appropriate. The Wilcoxon rank-sum test was used for paired sample analysis comparing thrombus volume between the CTAs at 30 days and 1 year. Univariate and multivariate linear regression were performed to examine the association between measures of transcatheter heart valve deformation with the volume of thrombus. The final multivariate model variables were selected based on the univariate results (p<0.1) and adjusted for sex, age at the procedure, and oral anticoagulation at the time of the first CTA. Due to high collinearity between variables describing the same deformation measure at different valve levels, the variable with the highest significance was selected. Univariate and multivariate logistic regression were performed to evaluate the predictive value of the quantitative thrombus measure for HALT or HAM resolution. The final multivariate model variables were selected based on the univariate results (p<0.1) and adjusted for sex, age at the procedure, and oral anticoagulation at the time of the second CTA. Correlations between continuous variables were assessed using Spearman’s rank correlation coefficient: values less than 0.5 indicated poor correlation; between 0.5 and 0.74, moderate correlation; between 0.75 and 0.9, good correlation; and greater than 0.90, excellent correlation. Intra- and interobserver agreement were measured using an intraclass correlation coefficient: values less than 0.5 indicated poor agreement; between 0.5 and 0.74, moderate agreement; between 0.75 and 0.9, good agreement; and greater than 0.90, excellent agreement (Supplementary Appendix 2). Intra- and interobserver variability were measured using Bland-Altman plots with mean bias and limits of agreement. All probability values were 2-tailed, and p<0.05 indicated a statistically significant difference. Data were processed using SPSS software, version 25 (IBM) and MedCalc, version 22 (MedCalc Software).
Results
Study population
The study included 612 patients who underwent their first CTA 30 days after TAVI with a balloon-expandable valve; HALT was detected in 118 (19%) of them (Figure 1). Out of 118 patients with HALT, 7 (6%) patients died during the first year of follow-up, 5 (4%) were lost to follow-up, and 3 (2%) had a second CTA postponed for logistical reasons. A second CTA, 1 year after TAVI, was available in 103 (87%) patients, of whom 4 patients were excluded because of suboptimal CTA quality. Of the 99 patients included in the study (mean age 80±9 years; 68 males, 31 females), 21 were receiving oral anticoagulation at baseline for non-valvular reasons, and 78 were diagnosed with HAM on their initial CTA scan. Following the first CTA, oral anticoagulation was initiated in 2 additional patients (both with HAM). During the 1-year follow-up, oral anticoagulation was discontinued in a single patient. On the second CTA scan, complete thrombus resolution was observed in 9 of 22 patients receiving oral anticoagulation and 34 of 77 patients not receiving oral anticoagulation (p=0.786) (Supplementary Figure 1). Clinical characteristics are presented in Table 1.
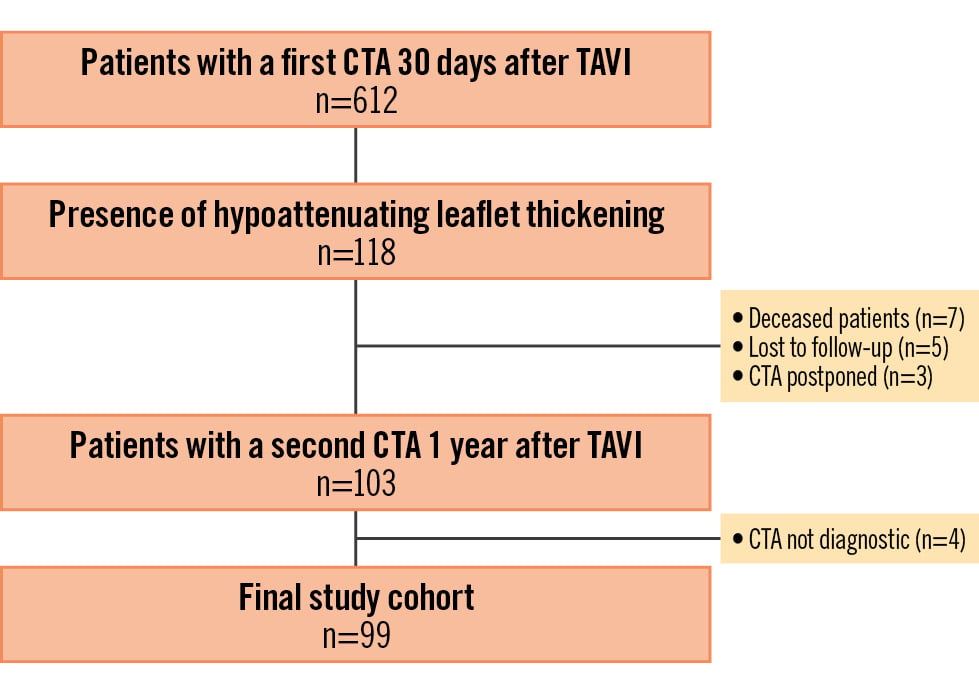
Figure 1. Study flowchart. CTA: computed tomography angiography; TAVI: transcatheter aortic valve implantation
Table 1. Baseline clinical characteristics and procedural data.
| Resolution of HALT | p-value | ||
|---|---|---|---|
| Yes (n=43) | No (n=56) | ||
| Baseline characteristics | |||
| Male | 27 (63) | 41 (73) | 0.283 |
| Age at procedure, years | 78±9 | 83±8 | 0.006 |
| Body mass index, kg/m2 | 28.6±8.6 | 25.8±4.1 | 0.070 |
| Arterial hypertension | 31 (72) | 54 (96) | 0.142 |
| Diabetes | 7 (16) | 18 (32) | 0.143 |
| Atrial fibrillation | 6 (14) | 13 (23) | 0.405 |
| Coronary artery disease | 24 (56) | 34 (61) | 0.814 |
| Previous myocardial infarction | 4 (9) | 10 (18) | 0.371 |
| Glomerular filtration rate, ml/min/1.73 m² | 73 (57-85) | 51 (41-65) | 0.061 |
| STS-PROM | 2.5 (1.9-4.7) | 4.7 (2.3-6.5) | 0.042 |
| Preprocedural echocardiographic data | |||
| Aortic valve area, cm2 | 0.7 (0.5-0.8) | 0.7 (0.5-0.75) | 0.046 |
| Mean transvalvular gradient, mmHg | 41.0 (28.5-44.5) | 46.0 (41.0-54.0) | 0.024 |
| Maximal transvalvular gradient, mmHg | 70.0 (47.0-78.0) | 76.0 (67.0-87.0) | 0.081 |
| Peak velocity, m/s | 3.9±0.6 | 4.3±0.8 | 0.174 |
| Left ventricular ejection fraction, % | 60 (45-66) | 61 (51-69) | 0.565 |
| Moderate or greater aortic regurgitation | 2 (4) | 4 (7) | 0.606 |
| Preprocedural tomographic data | |||
| Aortic annulus area, mm3 | 532 (450-567) | 477 (416-516) | 0.062 |
| Aortic valve calcium score | 2,227 (1,445-4,332) | 2,884 (1,807-3,804) | 0.269 |
| Procedural data | |||
| Non-transfemoral access | 1 (2) | 1 (2) | 1.000 |
| SAPIEN XTa | 2 (5) | 9 (16) | 0.073 |
| SAPIEN 3a | 41 (95) | 47 (84) | |
| Valve size, mm | 0.344 | ||
| 23 | 7 (16) | 12 (21) | |
| 26 | 16 (37) | 26 (46) | |
| 29 | 20 (47) | 18 (32) | |
| Predilatation | 0 (0) | 1 (2) | 1.000 |
| Post-dilatation | 0 (0) | 1 (2) | 1.000 |
| Medications at the first CTA | |||
| Oral anticoagulation | 11 (26) | 10 (18) | 0.663 |
| Aspirin | 41 (95) | 48 (86) | 0.114 |
| P2Y12 inhibitor | 9 (21) | 16 (29) | 0.385 |
| Medications at the second CTA | |||
| Oral anticoagulation | 9 (21) | 13 (23) | 0.894 |
| Aspirin | 42 (98) | 52 (93) | 0.277 |
| P2Y12 inhibitor | 12 (28) | 13 (23) | 0.594 |
| Data are presented as n (%), mean±SD or median (IQR). aby Edwards Lifesciences. CTA: computed tomography angiography; HALT: hypoattenuating leaflet thickening; IQR: interquartile range; SD: standard deviation; STS-PROM: Society of Thoracic Surgeons Predicted Risk of Mortality | |||
Quantitative thrombus measurements and valve deformation
Patients without HAM had a lower volume of thrombus compared to those with HAM (83 mm3 vs 303 mm3; p<0.001) (Figure 2A). These patients also had a higher median thrombus attenuation than patients with HAM (144 HU vs 125 HU; p<0.001) (Figure 2B). Interestingly, deformation parameters did not differ between the groups, except for lower implantation depth and lower eccentricity indices (p<0.001 at all levels) observed in patients without HAM (Supplementary Table 1). In multivariate linear regression adjusted for clinical parameters and oral anticoagulation, the thrombus volume at the first scan was associated with implantation depth (β=75.4; p=0.001) and eccentricity at the waist (β=88.2; p=0.003) (Table 2).
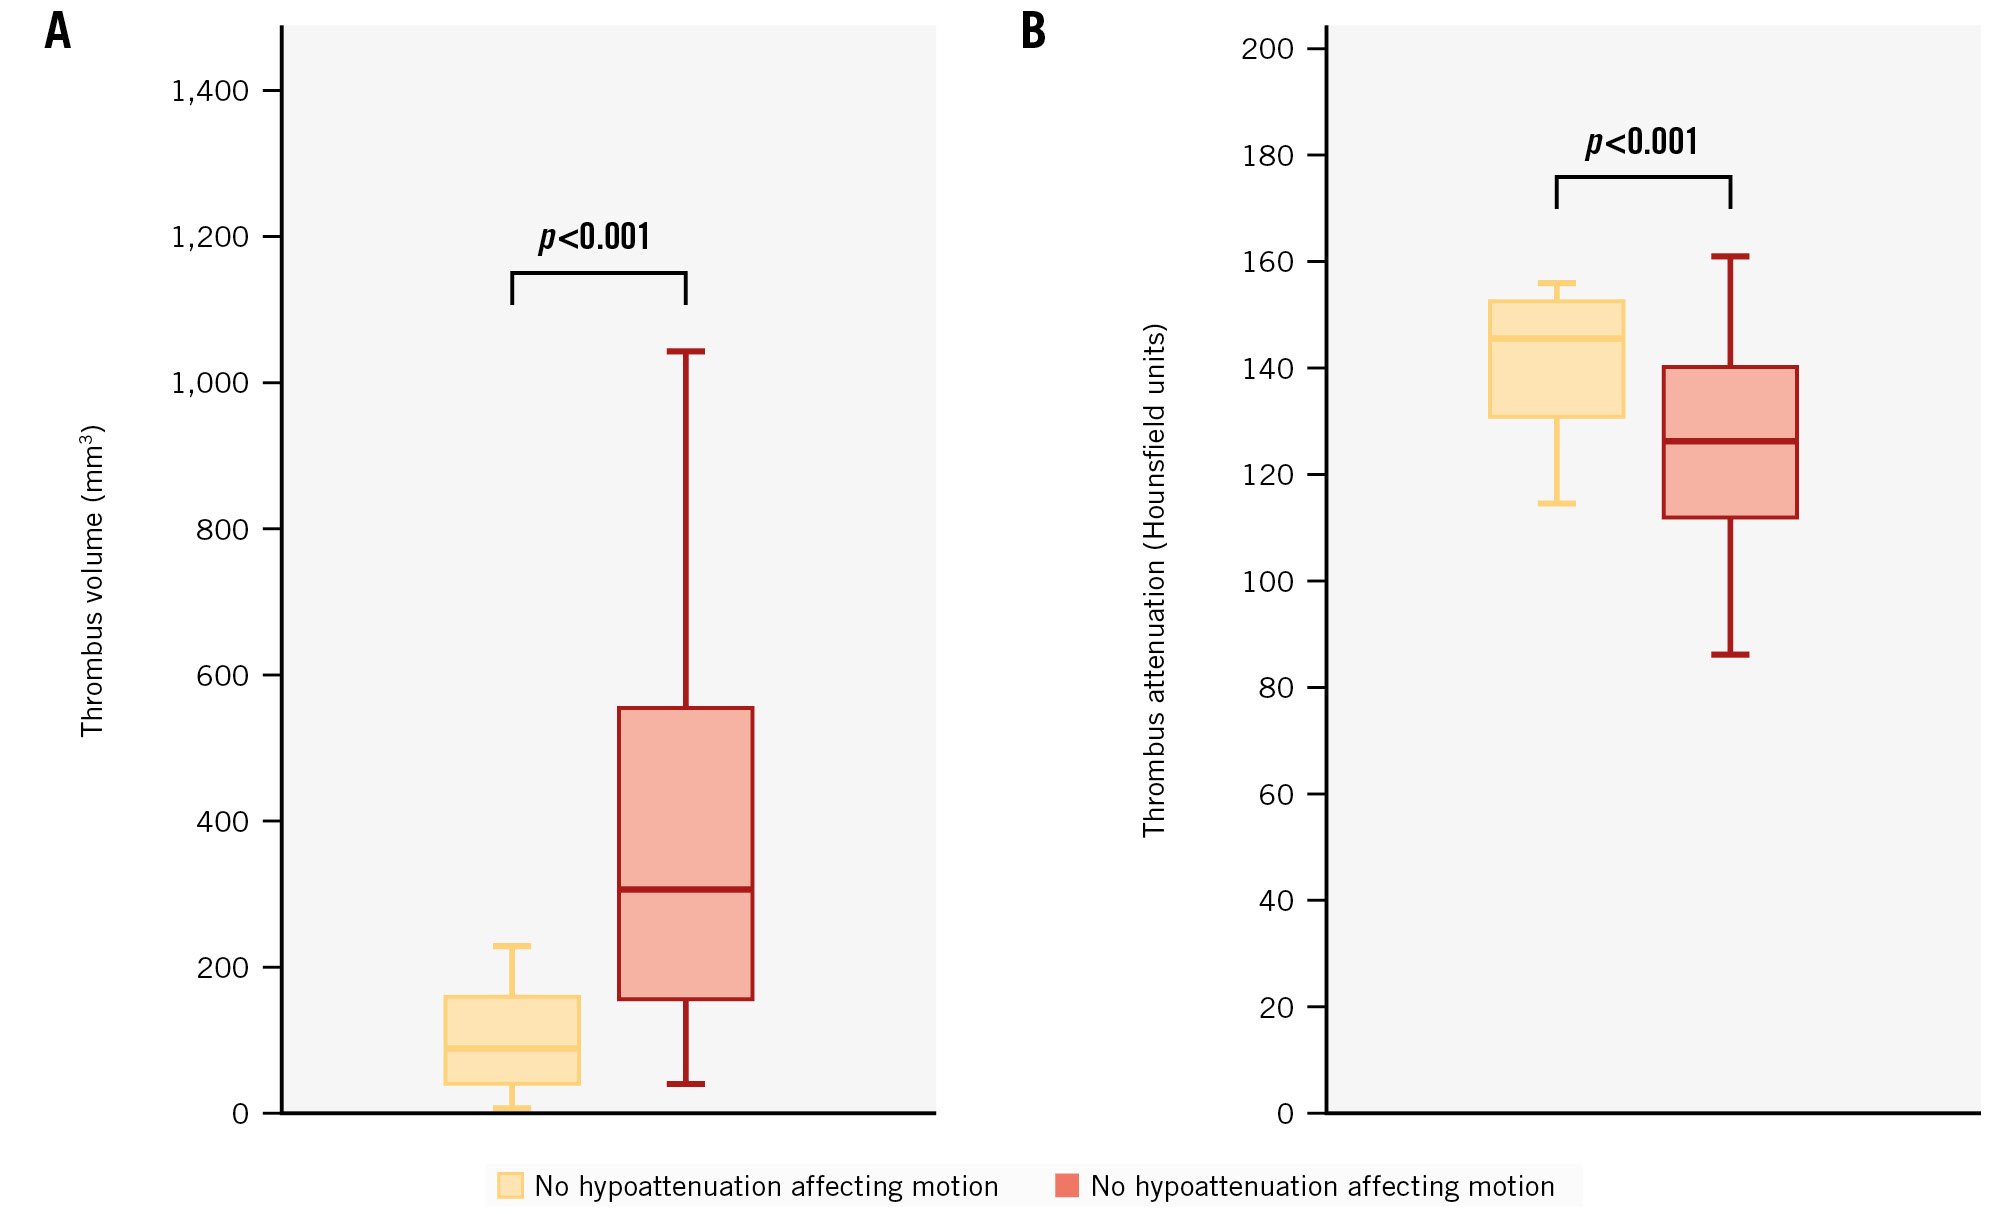
Figure 2. Differences in thrombus volume and attenuation in patients without and with hypoattenuation affecting motion. A) Differences in thrombus volume; (B) differences in thrombus attenuation.
Table 2. Univariate and multivariate associations of clinical variables and transcatheter aortic valve deformation measures with thrombus volume (mm3).
| Univariate | Multivariate | |||||
|---|---|---|---|---|---|---|
| β coefficient | 95% CI | p-value | β coefficient | 95% CI | p-value | |
| Male sex | 210.1 | 76.7 to 343.4 | 0.002 | 93.2 | −50.6 to 237.1 | 0.201 |
| Age at procedure (per 1 year) | −1.0 | −8.2 to 6.2 | 0.784 | −0.6 | −7.0 to 5.9 | 0.860 |
| Oral anticoagulation at the time of the first CTA | −109.9 | −444.5 to 224.5 | 0.515 | −69.4 | −352.9 to 213.9 | 0.627 |
| Valve size | 210.1 | 133.4 to 288.3 | <0.001 | 97.1 | −4.8 to 199.1 | 0.062 |
| Asymmetric leaflet expansion (per 1 degree) | −0.3 | −5.4 to 4.9 | 0.925 | - | - | - |
| Implant depth (per 1 mm) | 97.5 | −55.9 to 1.19 | <0.001 | 75.4 | 30.4 to 120.5 | 0.001 |
| Canting (per 1 mm) | 39.5 | −10.1 to 89.2 | 0.158 | - | - | - |
| Commissure malalignment | ||||||
| Right coronary | −202.3 | −529.2 to 124.5 | 0.222 | - | - | - |
| Left coronary | 151.5 | −44.8 to 347.9 | 0.129 | - | - | - |
| Post-implant oversizing (per 1%) | 1.5 | −17.6 to 20.6 | 0.875 | - | - | - |
| Expansion (per 1%) | ||||||
| Leaflet outflow | −0.2 | −7.3 to 7.0 | 0.958 | - | - | - |
| Prosthesis waist | −0.1 | −7.1 to 7.2 | 0.998 | - | - | - |
| Leaflet inflow | 1.1 | −5.3 to 7.6 | 0.724 | - | - | - |
| Native annulus | −5.3 | −12.8 to 2.1 | 0.156 | - | - | - |
| Eccentricity (per 0.1) | ||||||
| Leaflet outflow | 100.3 | 40.6 to 160.0 | 0.001 | - | - | - |
| Prosthesis waist | 106.6 | 49.6 to 163.6 | <0.001 | 88.2 | 31.1 to 145.4 | 0.003 |
| Leaflet inflow | 53.3 | 70.7 to 99.6 | 0.024 | - | - | - |
| Native annulus | 64.8 | 16.1 to 113.0 | 0.009 | - | - | - |
| Prosthesis deformation index (per 0.05) | −28.6 | −68.3 to 11.1 | 0.156 | - | - | - |
| *Indicates statistical significance. CI: confidence interval; CTA: computed tomography angiography | ||||||
Quantitative predictors of thrombus resolution
Complete resolution of HALT was observed in 43% of all patients. Neither thrombus volume (221 mm3 [IQR 94-514 mm3] vs 260 mm3 [IQR 119-505 mm3]; p=0.794) nor thrombus attenuation (124 HU [IQR 109-144 HU] vs 131 HU [IQR 109-144 HU]; p=0.178) differed between patients with and without HALT resolution. Univariate analysis of clinical data, quantitative thrombus, and transcatheter valve aortic deformation measures is presented in Supplementary Table 2. In multivariate logistic regression adjusted for clinical parameters and oral anticoagulation, lower thrombus attenuation was an independent predictor of HALT resolution (odds ratio [OR] 0.45 per 5 HU increase; p=0.03) as were the eccentricity index at the native annulus (OR 0.42 per 0.1 increase; p=0.003), the deformation index (OR 0.53 per 0.05 increase; p=0.005) and implant canting (OR 1.88 per 1 mm increase; p=0.026) (Table 3). Representative cases are presented in the Central illustration and Supplementary Figure 2. The sensitivity analysis, including only patients with HAM, showed no difference in thrombus volume in patients with or without HAM resolution (332 mm3 vs 290 mm3; p=0.882). However, patients with HAM resolution had lower thrombus attenuation than patients without (122 HU vs 132 HU; p=0.002) (Supplementary Table 3). Univariate analysis of clinical data, quantitative thrombus, and transcatheter valve aortic deformation measures is presented in Supplementary Table 3. In multivariate logistic regression adjusted for clinical parameters and oral anticoagulation, lower thrombus attenuation (OR 0.56 per 5 HU increase; p=0.002) and asymmetric leaflet expansion (OR 0.86 per 1 degree increase; p=0.003) independently predicted HAM resolution (Table 3). The sensitivity analysis for predictors of HALT and HAM resolution, excluding patients on oral anticoagulation, is presented in Supplementary Table 4.
Table 3. Multivariate association of clinical variables, thrombus quantitative parameters, and transcatheter aortic valve deformation measures with resolution of hypoattenuating leaflet thickening or hypoattenuation affecting motion.
| Resolution of hypoattenuating leaflet thickening | Resolution of hypoattenuation affecting motion | |||||
|---|---|---|---|---|---|---|
| Odds ratio | 95% CI | p-value | Odds ratio | 95% CI | p-value | |
| Male sex | 0.69 | 0.18-2.63 | 0.591 | 0.59 | 0.11-3.97 | 0.121 |
| Age at procedure (per 1 year) |
0.91 | 0.85-0.98 | 0.010 | 0.93 | 0.85-1.02 | 0.121 |
| Oral anticoagulation at the time of the second CTA | 0.67 | 0.20-2.28 | 0.512 | 1.21 | 0.25-5.8 | 0.815 |
| Thrombus volume (per 100 mm3) | 0.99 | 0.97-1.01 | 0.314 | 0.99 | 0.96-1.01 | 0.341 |
| Thrombus attenuation (per 5 HU) | 0.45 | 0.21-0.92 | 0.030 | 0.56 | 0.39-0.81 | 0.002 |
| Asymmetric leaflet expansion (per 1 degree) | - | - | - | 0.86 | 0.78-0.95 | 0.003 |
| Eccentricity at the native annulus (per 0.1) | 0.42 | 0.24-0.74 | 0.003 | - | - | - |
| Deformation index (per 0.05) | 0.53 | 0.33-0.83 | 0.005 | 0.60 | 0.33-1.09 | 0.096 |
| Implant canting (per 1 mm) | 1.88 | 1.08-3.30 | 0.026 | - | - | - |
| CI: confidence interval; CTA: computed tomography angiography; HU: Hounsfield unit | ||||||
Quantitative CTA for tracking of thrombus evolution
The temporal dynamics of HALT in a total of 56 patients without complete resolution at 1 year was further visually classified as regression (48%), stability (29%) or progression (23%). A comparison of thrombus volume from quantitative CTA at 30 days and 1 year showed a decrease in the regression group (291 mm3 vs 130 mm3; p=0.007), no change in the stability group (130 mm3 vs 255 mm3; p=0.921), and an increase in the progression group (187 mm3 vs 667 mm3; p=0.005) (Central illustration).
Thrombus volume and echocardiographic parameters
There was no difference in echocardiographic parameters at 30 days or 1 year between patients with and without HALT resolution (p>0.05) (Supplementary Table 5). However, patients with HALT resolution had greater decreases in the mean (−1.0 mmHg vs −1.0 mmHg; p=0.014) and maximum (−1.5 mmHg vs −0.5 mmHg; p=0.032) transvalvular pressure gradients on echocardiography at 30 days and 1 year (Supplementary Table 5). Thrombus volume at 30 days did not correlate with echocardiographic parameters (p>0.05 for all) (Supplementary Table 6). Similarly, no correlation between thrombus volume at 1 year and echocardiographic parameters at 1 year was found (p>0.05 for all) (Supplementary Table 6). However, the change in thrombus volume correlated with the magnitude of change in the mean transvalvular pressure gradient (r=0.462; p<0.001) and maximal transvalvular pressure gradient (r=0.380; p<0.001) between echocardiography at 30 days and 1 year (Table 4). Seven patients met the criteria of haemodynamic valve deterioration 3 years after TAVI: two moderate and five severe. None of the patients received oral anticoagulation at the time of the first CTA; however, it was initiated in two of them following the imaging results. Among patients with haemodynamic valve deterioration, one died of pneumonia during the second year of follow-up, while another required redo-TAVI in the third year. Patients with valve deterioration had a higher thrombus volume at 1 year than the remaining patients (400 mm3 [IQR 98-1,269 mm3] vs 62 mm3 [IQR 0-249 mm3]; p=0.018).
Table 4. Correlation between the change in the thrombus volume and echocardiographic parameters.
| Change in echocardiographic parameters | Change in thrombus volume, mm3 |
|---|---|
| ∆ aortic valve area, cm2 | r=−0.350p=0.054 |
| ∆ mean transvalvular gradient, mmHg | r=0.462p<0.001 |
| ∆ maximal transvalvular gradient, mmHg | r=0.380p<0.001 |
| ∆ peak velocity, m/s | r=0.201p=0.161 |
Discussion
Quantitative characterisation of HALT in relation to valve deformation could provide mechanistic insight into its clinical sequelae and aid decisions about oral anticoagulation therapy. Several studies have investigated the history of HALT in transcatheter and surgical cohorts, but there is a limited understanding of how imaging features influence thrombus evolution over time178. Thus, we sought to examine the association of quantitative HALT features from CTA with its progression in a real-life population. We found that (1) lower thrombus attenuation predicts HALT resolution, independently of clinical characteristics and non-uniform expansion of the prosthesis; (2) volumetric evaluation of thrombus allows precise tracking of HALT evolution; and (3) an increase in thrombus volume is associated with higher transvalvular pressure gradients.
Multiple clinical risk factors, including the absence of anticoagulation therapy, renal impairment, and reduced left ventricular function, have been associated with HALT26. Additionally, the post-implant geometry of transcatheter aortic valves plays a significant role in thrombus formation15. Several studies have identified deformation of the bioprosthetic midsegment and asymmetric leaflet expansion as independent predictors of HALT1617. Indeed, we show that increased thrombus volume is associated with implantation depth (β=75.4, 95% confidence interval [CI]: 30.4-120.5; p=0.001) and eccentricity at the waist (β=88.2, 95% CI: 31.1-145.4; p=0.003) of balloon-expandable valves. These findings are in line with our previous study on transcatheter valve deformation in bicuspid aortic valves, which showed that suboptimal expansion affects the incidence of HALT. Deep valve implantation and deformation, particularly eccentric configurations, may disturb blood flow and negatively affect the microstructure of the leaflets, thus promoting thrombus formation27.
Thrombus incidence and volume are likely influenced by the size of the bioprosthetic valve, as demonstrated in previous studies on fluid mechanics and other large multicentre registries. Indeed, we observed a trend suggesting an association between thrombus volume and valve size, but no association was found between thrombus volume and the resolution of the thrombus. Additionally, we extend the evidence on the role of bioprosthetic valve deformation in HALT by showing an association of eccentricity at the native annulus level and deformation index with thrombus resolution.
While semiquantitative visual grading of HALT remains the clinical standard, the quantitative approach objectifies the evaluation of thrombus. One study by Karády and colleagues measured HALT volume by extracting low-density voxels (between −200 HU and +200 HU) within a bioprosthetic frame using an open-source platform for multipurpose medical image analysis 3D Slicer (https://www.slicer.org/) and described a HALT prevalence of 79% with a median volume of 72 mm321. A high prevalence of small thrombus volumes suggests that quantification was likely affected by photon starvation artefacts adjacent to the high-density bioprosthetic frame. For this reason, we used HALT quantification supplementary to visual detection rather than as a substitute. Moreover, our software is dedicated to aortic valve tissue characterisation and has been previously validated against histology20.
Our volumetric quantification of thrombus is therefore a precise method for accurately tracking HALT evolution between CTA scans. Presented results demonstrate that the difference in thrombus volume between the two scans corresponds closely with visual assessment. Moreover, the magnitude of change in thrombus volume correlated with haemodynamic changes. Whereas the presence of HALT may slightly decrease short-term haemodynamic performance, its impact on the long-term durability of the transcatheter aortic valve remains uncertain112. Volumetric quantification of thrombus allows the detection of visually indescribable HALT evolution in serial imaging that reflects the subtle changes in echocardiographic indices. While quantitative thrombus characterisation requires little additional labour (2-3 minutes per case), the trajectory of changes in thrombus volume could potentially inform decisions on starting oral anticoagulation and refine risk stratification of long-term structural deterioration of bioprostheses.
Our quantitative measures of HALT also included the attenuation. For the first time, we have shown that lower thrombus attenuation independently predicts HALT resolution (OR 0.45 [95% CI: 0.21 - 0.92] per 5 HU increase; p=0.03). Differences in attenuation have been shown to discriminate between thrombosis and pannus formation in mechanical heart valve dysfunction28. Although an optimal threshold of >145 HU was determined for differentiating pannus from thrombus (sensitivity 88%; specificity 96%), the best response to thrombolysis was seen in the lowest attenuation masses (complete resolution in all cases <90 HU and only in 42% at 90-145 HU). Increasing thrombus attenuation may reflect the replacement of cellular material by collagen during its maturation, which could increase the resistance to thrombolytic pathways2930.
The findings of our study may help optimise TAVI procedures by highlighting the role of valve deformation and implantation depth in HALT formation. Both deformation and implantation depth contribute to the risk of HALT formation by affecting neo-sinus characteristics. Greater prosthesis deformation has been linked to a lower sinus volume, which promotes HALT formation15. Similarly, a lower implantation depth has been shown to impair neo-sinus washout, potentially further increasing the risk31. The deformation of the bioprosthesis depends on the anatomy and calcification of the aortic valve complex. While the opportunity to control this aspect is limited, identifying anatomical features associated with HALT can be valuable during the planning stage. On the other hand, high implantation techniques in balloon-expandable valves have been shown to decrease conduction abnormalities and permanent pacemaker implantation rates. Current results suggest that higher implantation may decrease thrombus volume and potentially improve the durability of the bioprosthetic valve.
Limitations
Our study has several limitations. First, we included only balloon-expandable transcatheter aortic valves, which limited the generalisability of the presented findings. Second, long-term clinical outcomes were unavailable; therefore, their association with thrombus characteristics could not be studied. Finally, patients receiving oral anticoagulation were included; thus, the results might not represent the natural history of thrombus, but they do reflect current clinical practice.
Conclusions
In conclusion, quantitative thrombus characterisation on CTA is predictive of HALT resolution and correlates with the haemodynamic performance of transcatheter aortic valves. Quantitative thrombus characterisation may improve risk stratification in patients with HALT and inform therapeutic decisions.
Impact on daily practice
The study highlights the clinical value of quantitative computed tomography angiography (CTA) in evaluating hypoattenuating leaflet thickening (HALT) following transcatheter aortic valve implantation (TAVI). By identifying key factors such as thrombus attenuation and prosthesis deformation, clinicians may more accurately predict HALT resolution and its impact on valve function. This could inform decisions on oral anticoagulation therapy, enabling a more personalised approach based on thrombus evolution. Patients with thrombus progression may benefit from closer monitoring or therapy adjustments. Additionally, serial CTA imaging can aid in the early detection of structural valve deterioration, optimising patient management and improving long-term outcomes post-TAVI.
Funding
This research was funded by the National Institute of Health/National Heart, Lung, and Blood Institute grants (1R01HL175875), the Winnick Family Foundation, and a grant from the Miriam and Sheldon G. Adelson Medical Research Foundation.
Conflict of interest statement
K. Grodecki was supported by the Diamond Grant of the Polish Ministry of Science and Higher Education (DI2017004047), the Foundation for Polish Science (START 2021), and the Polish National Agency for Academic Exchange. D. Dey, D. Berman, and P. Slomka may receive software royalties from Cedars-Sinai Medical Center; and disclose equity in APQ Health Inc. R.R. Makkar reports research grants to the institution from Edwards Lifesciences, Abbott, Medtronic, and Boston Scientific; and support for attending meetings or travel from Edwards Lifesciences, Abbott, Medtronic, and Boston Scientific. The other authors have no conflicts of interest to declare.
Supplementary data
To read the full content of this article, please download the PDF.